Polkadot before the reboundThe price turned out to be in the fan.
The price decline has slowed down, we are near the liquidity zone.
I expect further growth to the level of $19.1.
Tether

Polkadot will continue the correctionThe price continues to move within the descending channel.
Volatility decreased when trying to break through the resistance level.
I expect a fall to the resistance level.

Volumes have decreasedThe price is oversold when testing the trend line and reduced volumes.
I expect a breakdown of the trend line and growth to resistance level.

The bear market has not yet arrivedThe price broke the downtrend line that has been in place since November.
I expect we may still get back to $62,000 this year.

Cardano has bottomed outGlobally, the price of the asset is too low, but the asset is overbought on small timeframes.
Trading is done on low volumes.
I expect price to retest the support level before breaking the trend line.

Ethereum will follow bitcoinPrice failed to fully form an inverted head and shoulders pattern.
On the 4H timeframe, the price broke the downtrend, re-tests, but does not go under it.
I expect a rebound to the resistance level indicated on the chart.

Will the fractal work?The price formed an inverted head and shoulders pattern.
I observe a fractal, similar to last August.
I expect that after that the price can reach $46,000, in case the fractal works out, we can reach $50,000.

A dog can grow upThe price is locally oversold, but is moving in an upward channel near the support level.
From the current levels, I expect that the price will reach the resistance level.
Reduced volatilityThe price is moving between the liquidity zone and the trend line.
Stochastic RSI 4H shows overbought.
A bearish divergence is forming at the 30m timeframe.
I expect a decline to the 0.5 Fibonacci level.

Cardano in the accumulationThe local trend is upward.
The price has held the trend line.
We are at the support level.
I expect the retest of the support level and the trend line, and after reaching the target indicated on the chart.

Litecoin at the beginning of the correctionThe global structure and trend of the coin remains downward.
Stochastic RSI shows overbought on 4H.
On the 1H timeframe the price has formed a double top pattern.
Bounced back down from the 200MA on the 1H timeframe.
I expect a decline to the $126.19 level.

EOSUSDTHello Crypto Lovers,
Mars Signals team wishes you high profits.
We are in the daily time frame. The price has broken the S1 line which was previously the Resistance line. It has also made its pullback to this line. We can buy it here and save profit at the R1 zone. If R1 is also broken and the price stabilizes above it, R2 would be the next target. If the price comes lower than the S1 line, there would be more falling.
Warning: This is just a suggestion and we do not guarantee profits. We advise you to analyze the chart before opening any positions.
Wish you luck

ZILUSDTHello Crypto Lovers,
Mars Signals team wishes you high profits.
We are in the daily time frame. The price has broken the S1 line which was previously the resistance. The price can make a pullback to the S1 line and then go up. Or it can go up straight from here. You can buy half of it here and keep the other half at the S1 line in case the price comes down. R1 and R2 areas are good places to save profit.
Warning: This is just a suggestion and we do not guarantee profits. We advise you to analyze the chart before opening any positions.
Wish you luck

FIO Protocol Vs Tether Weekly Chart | 444% Potential ProfitsOn top of the market cycle, the market sentiment, the clear signals we see of a bullish wave developing for the Altcoins, we are going to be looking at two signals on this chart.
We have the candle from 29-Jan. which is a high wave candle at the bottom of a trend.
This candle can signal indecision (for the continuation of the downtrend) and at this point a potential change of trend (reversal signal).
The negative nine in conjuction with this candle is really strong.
After the high wave candle, we have a bullish candle and now prices are starting to move up.
We also have the BTC pair starting to grow (FIOBTC).
The week just started.
If we see FIOUSDT breaking above EMA10 ($0.1212) this week, we can easily see additional growth in the weeks to come.
On the downside, the red line on the chart is for support/stop-loss.
Namaste.

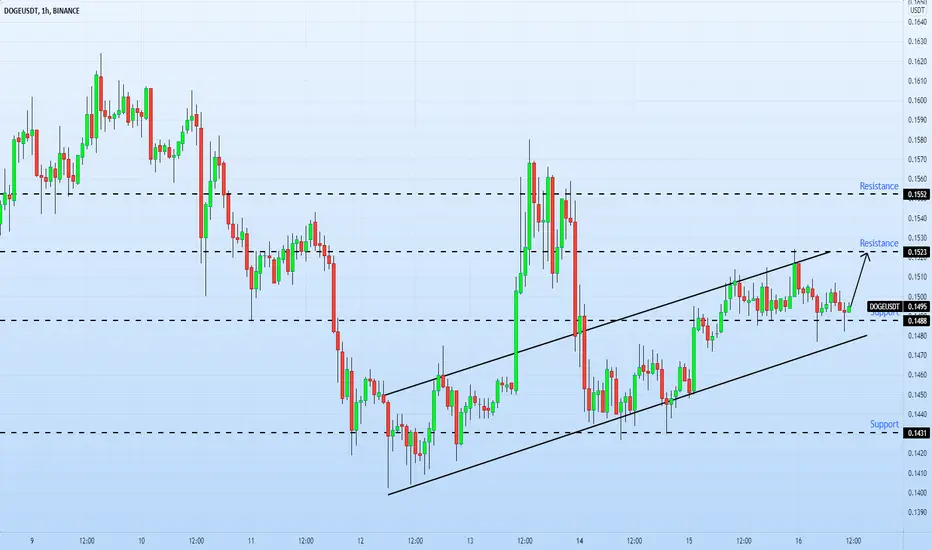
Good opportunity with a good RRRThe price is near the lower boundary of the ascending channel.
Locally Dogecoin is oversold.
I believe that from the current price it is possible to gain coins to the target indicated on the chart.

Polkadot will riseThe price formed an ascending wedge and broke the resistance level.
The stochastic RSI is locally oversold.
I expect a retest of the lower boundary of the wedge and then a rise to the target indicated on the chart.

Litecoin goes together with EthereumThe price formed a double-bottom pattern, made a reversal and reached the resistance level.
Local oversold on the 4H timeframe.
I think that from the current level we will correct to the nearest support level.

An important level of resistanceThe price is approaching an important resistance level.
Local overbought after the pattern of a cup with a handle and continuation of the trend.
I expect a further bounce from the resistance level to the indicated support levels.

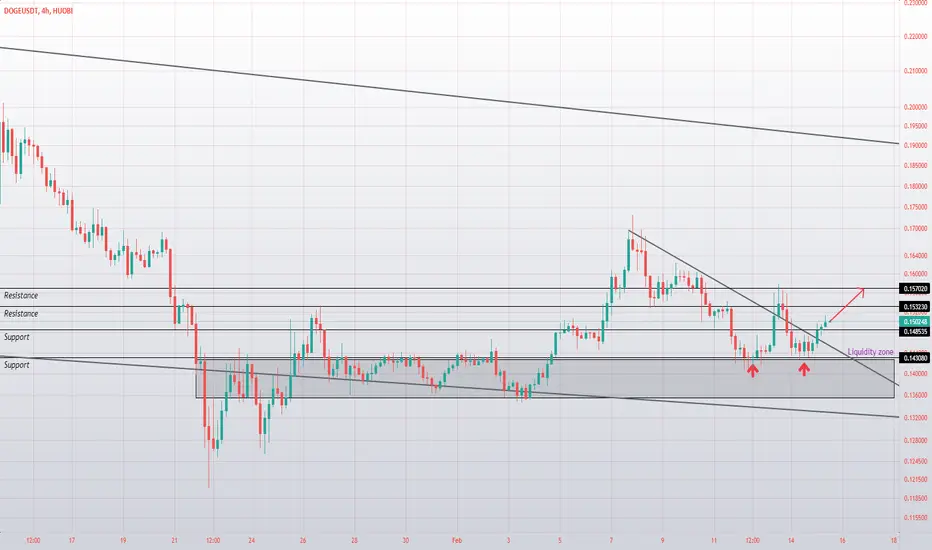
The price formed a double bottomGlobally, the movement is taking place within the downward wedge.
The price rebounded from the liquidity zone, formed a double bottom and also broke the downtrend line.
I expect a test of the resistance level of 0.15702.
Range narrowingThe global upward structure persists, but the trend is downward.
We went down to the liquidity zone, from where we unsuccessfully tried to break the trend line.
Locally oversold. I believe that it can go down to the lower boundary of the liquidity zone.

Smooth Love Potion | The Path to 875%Smooth Love Potion (SLP) had a major breakout two weeks back and it is now entering its second wave.
After the initial breakout we get a correction and then additional growth, this is marked by the red and green arrows on the chart.
The sideways consolidation can vary, for example:
1) You can see a 7-9 days total correction and then prices go up.
2) Or, you can see 15, 20, 30 days total correction and then prices go up.
In both cases SLPUSDT would stay within the previous low.
1)
2) Main chart above.
Patience is key.
Many more opportunities are developing.
While the markets consolidate take the time to study.
Support my work with your love, likes and comments.
I'll be back again tomorrow.
Thanks a lot for the amazing support.
Namaste.

Chainlink (LINK) Analysis | Weekly TimeframeChainlink (LINKUSD) is also one of the TOP/major altcoins within the market by capitalization and it doesn't look like it is going to go up.
There can be a bounce right away at support... Hold on, let's start from the beginning.
We are looking at the weekly timeframe/long-term chart for Chainlink vs the Dollar.
Prices are trading below EMA100/50/10.
A new high was hit back in May 2021 followed by lower highs.
The MACD is strongly bearish below zero and also below support.
Last weeks candle closed bearish after a rejection at EMA100.
This can lead to a test of the next important support level at around $12.38.
This is the Fib. retracement level 0.786 of the full bullish wave from March 2020 until May 2021.
If this level holds as prices drop, we can see a bounce (blue arrow).
After this bounce we can examine the chart again.
If the Fib. retracement level does not hold, we will see a strong crash... Maybe we will just see a long wick down and then prices start to grow, who knows...
But this is also part of the big ones, it is looking bearish like all the other ones.
Either something changes or we are getting closer and closer to the final flush.
The markets can always change.
I hope you are enjoying the content but keep in mind that I am only reading the chart.
Namaste.

Decred Attempts Bearish Channel Breakout (122% Mapped)The USDT pair for Decred (DCRUSDT) is also going bullish as it challenges EMA50 today.
We have small trading volume today but above-average and growing.
We can see a clear descending channel marked while the indicators are turning bullish (MACD/RSI).
You can find the targets and support levels on the chart.
Namaste.
