Tetherusd
ZRXUSDT AnalysisI am neutral on ZRX at the moment while EngineeringRobo remains Bearish.
If you are currently holding ZRX at the moment, You should consider holding to sell at the resistance level (0.73) or with EngineeringRobo sell signals
If you are planning to buy, wait for EngineeringRobo buy signals or buy at the support level (0.37) or at uptrend support line.
No matter which level you are buying, watch EngineeringRobo signals carefully. If you are wanting to use EngineeringRobo, DM me!
BTC; short term bullish?Hello ! A simple and basic strategy and has some positive price action in this sideways market.. I'm hoping we can have a short term bullish cross here, I'm guessing anywhere from 6 - 10 % to the upside. If we get rejected, We may see 9.5 again. We shall see and good luck traders ! :)
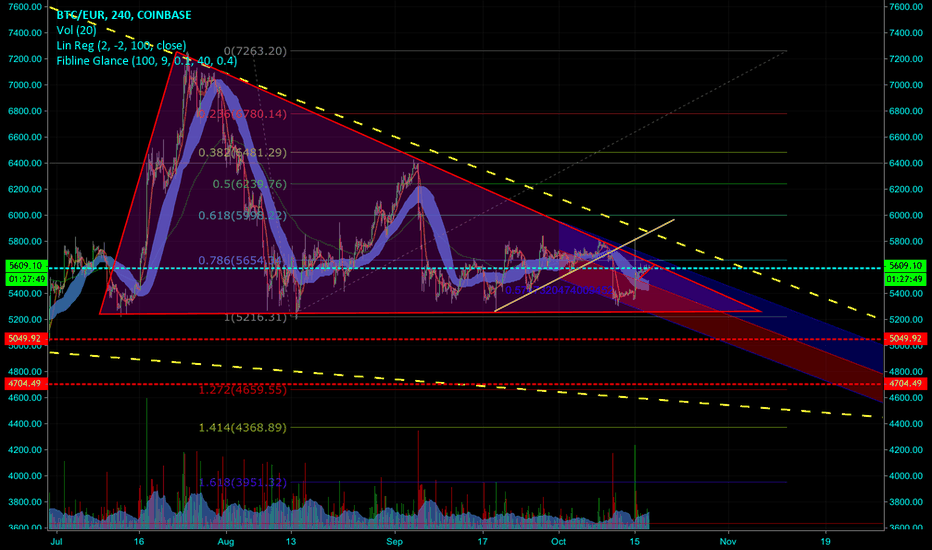
BTC - USDVery messy chart, but seems BTC is breaking for a move up or down.
Red triangle line is the daily pattern, pink triangle is the weekly.
I'm in a long position, aiming for the 4400 area. Seems every signal is heading for the area of 4400, i never use EW and Fib tools, but just for fun i made them up in this chart, because a lot of people are using it.
Trade safe, and always use an stoploss.
BITCOIN inside the small and big triangles.Tether FUD has driven BTC up, but as I can see, there’s been a HUGE rejection and the price is still inside the small and the big triangle. That said, if it broke the small triangle upwards, the resistance of the big one would be nearly impossible to break. RSI 4H is about to turn down and RSI 1D has started to turn down.
Also, if you count the waves, it was the wave E, so the triangle is completed. I think next move is down and it will break the triangle support. But, nothing is sure 100%. What is sure is that descending triangles break out downwards 73% of the times. As I can’t see volume at all, I don’t think BTC can go up this time.
I wouldn’t trade now, since Tether FUD is very dangerous. It can suddenly draw a big red candle and everyone would get trapped.
This is not financial advice. I’m not responsible of your actions.
Have a good day. ;)


