Tezos Rising Wedge Breakdown XTZUSDClear rising wedge
This is a bearish pattern and bearish results can be observed already.
Long term growth potential outpaces the potential 'savings' from selling based on this observation. I advise holding if you are an owner of this coin.
Hence my position on this coin is neutral.
Tezos


Projection off of Vol Candle x100 Tezos potential ETH DominanceLook at the massive accumulation candle from the March 2020 Dip! That's a lot of buying power.
I'm generally bullish on any coin I believe has interesting and groundbreaking technology. Sometimes I am right and sometimes I am wrong. I know the space is crowded, but so is The Nasdaq.
I really like the Tezos set up for a massive bull run potential.
This is not trading advice.

XTZ warms up! $ 3.5-4.5 is comingXTZ is one of the quiet projects but has a lot of development behind the scenes. All chart indicators show Bullish trend. Lets see! My first target would be to see 3.45-3.50

2.12.2020 - Tezos (XTZ / USD)Hi Traders!
Today we look at one of the most popular cryptocurrencies and that is Tezos (XTZ). What does the chart look like? For the purposes of this analysis, we will use a daily chart as we want to see the overall trend. Tezos also went through a slump this year caused by COVID in March. Subsequently, it rocketed and fell again. Let's look at the overall structure.
Tezos wrote off up to 78% of its growth, which is confirmed by the value of 0.786 fibonacci retracement. Tezos was quite good to us also in the falling wedge he formed. At this point, several interesting levels met:
1. Support on the daily chart
2. Fibonacci retracement 0.786
3. Turning pattern - falling wedge
You can see the bottom of the chart, and a reflection has come from this level. The chart has currently stopped at MA21, but this should only be temporary. In time, we expect an attack on the new ATH and the upper edge of this great channel. In general, we see a value of about USD 5, which would represent more than 100% growth. However, it is important that we stay in this channel and not fall below the bottom trend line. So the tariff is USD 5.00.
May the crypto be with you!


#XTZUSD Starting To Take Off!Tezos is a self-amending decentralized platform for building dApps. It's similar to Ethereum in a way that both blockchains support dApps built using smart contracts. ... The most notable one is the network's on-chain governance, which allows holders of XTZ, Tezos' native coin, to vote on the network's future direction.
💠Keep Contemplating Crypto!
💠Check Out The Crypto Collective For More Signals & Set-Ups!💠
💠Like, Comment and Follow Us for More!


Tezos (XTZ) - Potential swing longXTZ long term channel
Price has broken back inside and has now backtested the channel as support.
If the bullish market sentiment continues, I expect XTZ to pump back towards the top of the channel, potential profit taking at channel levels.
DYOR, NFI


XTZ / Tezos Long TermChannel for Tezos / XTZ. Looks like it is sitting on the bottom of the channel.


GETTING READY TO RETEST THE ATHAlmost every TF looks beautiful for XTZ, I've been buying for a couple of weeks now and I will be looking to buy at the retest of the 2,5$ area, looks a nice spot and pivotal point.
XTZUSD to see a breakout(1D) | Potential gap up observedMarket in last 1 week
XTZUSD saw consolidation with the price started to ride the upper Bollinger band
Price volatility was very high. The market moved ~39.79%, between $2.814 and $2.013
Today’s Trend analysis
XTZUSD expected to see a breakout as potential gap up observed with Bollinger band expanding
Price at time of publishing: $2.815
XTZ’s market cap: $2.105 Billion
Oscillator indicators are mostly neutral. RSI at 72
Moving average indicators are biased towards an uptrend. Ichimoku Cloud is neutral and Hull MA indicates a buying opportunity
Volume indicators saw a decrease in volume with price declining while volume increased as price increases
Price expected to see a breakout as potential gap up observed with Bollinger band expanding. Most of the Oscillator indicators are neutral. MACD line moving above the signal line with histogram size increasing in the positive region, suggesting a bullish bias. RSI at 72, in the overbought region indicating a downtrend soon. CCI is around 297, in the overbought region indicating a downtrend. Another interesting point to notice here is that volume saw a decrease in volume with price declining while volume increased as price increases indicating a strengthening buying pressure.
----------------------------------------------------------------------------------------
The analysis is based on signals from 28 technical indicators, out of which 17 are moving averages and remaining 11 are oscillators. These indicator values are calculated using 1 D candles.
Note: Above analysis would hold true if we do not encounter a sudden jump in trade volume .
----------------------------------------------------------------------------------------
If you find the analysis useful, please like and share our ideas with the community!
- Mudrex

Trading plan for XTZRSI above 70 be careful! First selling targets hit, will be buying around to 2.40 to increase stack, Hold on to a little XTZ Incase we keep soaring. Next target 3.20.
The goal here is to increase XTZ holdings!!!

Tezos finally woke up! XTZUSDAnd its about the damn time. Pivot confirmed 24-48 hours ago. Goals are in green, we are going up. Invalidation is in red. Let this baby roll! Not financial advice, as always.


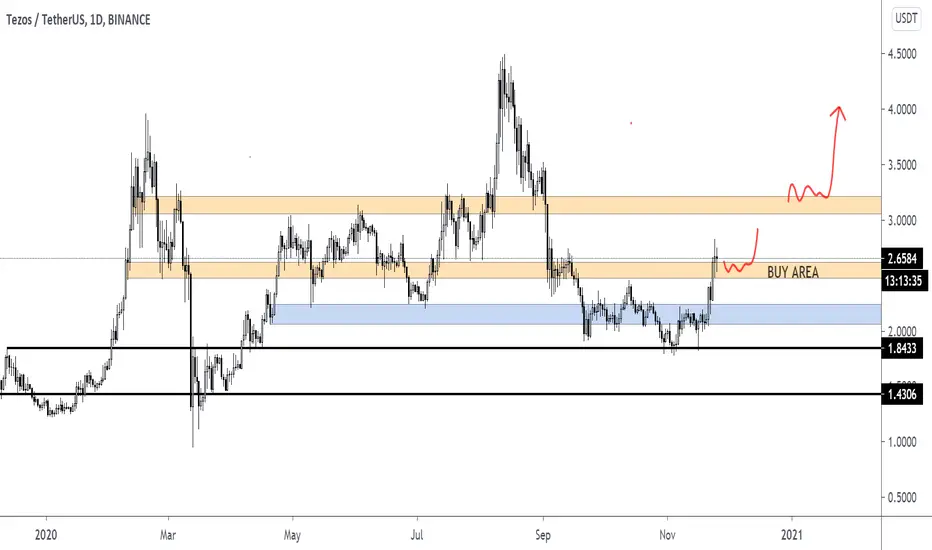
✳️Tezos/USDT (8/11) View + Trading Plan #XTZ $XTZAfter breaking out of the 1.9$ zone, XTZ quickly turned back and closed the 1D candle above the 2$ zone and this is a good sign that the 1.9-2$ zone is very important for XTZ and it can push the XTZ up strongly in this November.
The heading targets will be the 2.5$ and 3.5$ zones
However, if the 1.9-2$ zone continues to fail, there is still a very strong support zone at 1.5-1.6$
📈BUY- LONG
- Buy: 1.9-2$, stoploss if B
📉SELL-SHORT
- Sell: 2.5-2.6$, stoploss if A
- Sell: 3.4-3.5$, stoploss if A
♻️BACK-UP
- Buy: 1.5-1.6$, stoploss if B
- Sell close to 1.9-2$ if B, stoploss if A
❓Details:
Condition A : "If 1D candle closes ABOVE this zone"
Condition B : "If 1D candle closes BELOW this zone"

