XTZ perfect cup and handle formingGood Afternoon Traders,
Crypto Centric here. Is anyone one else watching the XTZ (Tezos) daily chart. There is what looks to be a beautiful cup and handle pattern forming. Now we need to clear the green zone between $7-$8 roughly and then back test it to confirm a breakout. But this is something I will be watching closely.
This analysis is not financial advise and is for educational purposes only as I am not a financial advisor.
Tezosusdt

Tezos clings to life supportWhat do you know, Tezos almost made a new ATH and proceeds to dump 40% over the following week. To say long term holders and the community is dejected is an understatement. This coin has been nothing short of a series of gut punches to its biggest supporters. Right when you get most excited, it reaches in and rips your soul.
Until Tezos proves me wrong I'm convinced this thing will never bring long term holders wealth. No matter how positive the news, the asset cannot ever sustain itself. A tragedy because this really seems like a promising project and the news outside of price action couldn't be more positive.
If September closes red it's going to get dark. By dark I mean we're probably in trouble If it closes in "hell" well, you know what that means. Purgatory would be a win at this point and unfortunately it looks highly probable that this thing will dump for the remainder of the month. Heaven... well it ain't happening any time soon.
Bottom line... Tezos must reverse course now or it's probably over for good.

xtz , Tezos63% profit after providing analysis
considering the negative divergence of Bitcoin and the possibility of correcting the save market seems a reasonable profit
I will buy again in a possible pullback


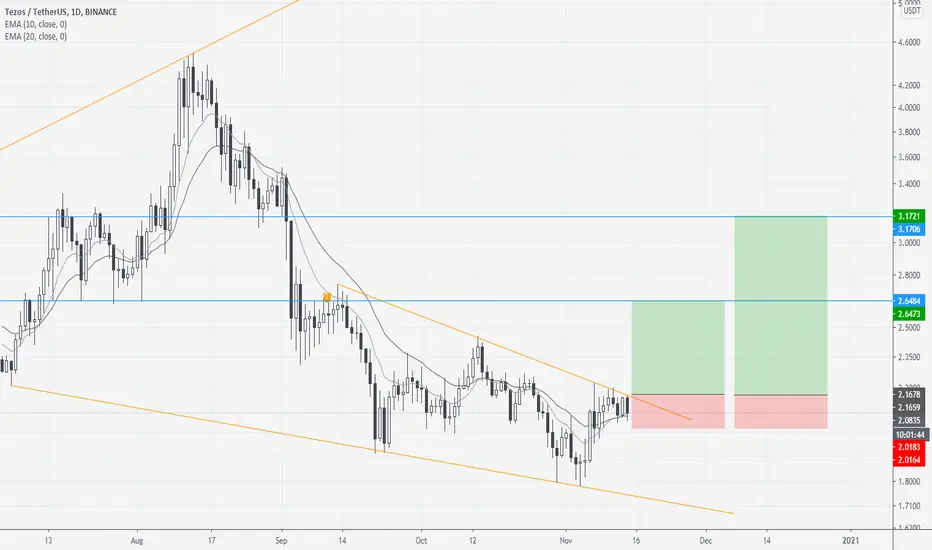
XTZ Potential Drop Before Taking off!?XTZ has been moving somewhat sideways but slightly upwards for the past month and a bit and it looks like we could be in for a little drop coming up soon, i imagine that we will see a drawdown to the pivot point which is about -9-10% from where we are now, however i do really think we are going to catch support and get a bounce, if you take a look at the bollinger bands you notice the midline which right now acts as support lines up perfectly with that pivot point that acts as support, i think its likely that we will atleast see a bounce on the first wick down. Keep in mind that BTC is a big factor in this, if BTC decides to pullback or drop we can expect the same for the rest of the market. The MACD is looking a little shaky we see our Blue MA approaching the orange one while pointing to the downside, i think we are likely due for a bearish cross in the coming day/s. Our histogram is slowly cooling down printing lesser green bars than the previous and we are coming up on the midpoint where we could see this flip to red. Think a little cooloff or pullback is due before we see a big run for XTZ here but keep in mind BTC plays a huge factor so always remember that, very bullish on XTZ longer term i believe it is a great project and will be looking to buy the dips. Not financial advice just my opinion!!

xtz , TezosThe resistance of $ 3.33, which coincides with the average resistance of 100 days, if it breaks, it can reach the first target in the short term.
It has now emerged from the Ichimoku cloud daily, forming a small green cloud.
I put it on the watch list and set an alarm that if break resistance or reach the buying range at a low price, I will enter the trade.


TEZOS Repeating Structure Repeating falling wedges
Green (rise), Red (top), yellow (bottom)
An observation post not a forecast, yet I am still bullish on everything, as I will probably always be.

TEZOS AnalysisAnalysis for TEZOS
When in doubt check the BTC chart
Shows a base forming contradictory to the hanging USD price
Great buy right now for a long hold

Tezos Nice Dip BuyTezos is within a MASSIVE channel on the daily chart
i expect this to correct upward and continue..
Added a line to add a bit of 3D'ness


XTZ still following the planAs the market is seeing a red day, Tezos follows. Volume is still high though.
- Touching $5.36 resistance turned support
- 50 MA served as support 3 times
- MA's going further apart
- RSI still setting higher lows
Possible resistance @ $6.6, but I expect we can see a clear rally towards $7.30
Do you have a position in XTZ?


Tezos looking for channel breakA smol bullflag has formed within the channel
I expect this to likely push the price out of this channel area, once it breaks out
This is the weekly chart so patience may be needed
Very bullish formation

Tezos XTZ looks so hot!Tezos has strong fundamental and has been accumulating for a very long time.
Now she has establish double-bottom, and holding strong against the recent BTC dump.
Next time it stands above the neckline (5.5-6) then retest the line would start a major rally.
Watch the show.

Tezos positioned for its highest monthly closeThe last 6 months have been trying for Tezos holders, but patience might soon pay off. XTZ is currently trading in the $3.50 range, and should it break we could see new all time highs shortly thereafter. If the February close is indeed the highest mark yet, the remainder of 2021 should be electric for Tezos.


Tezos Trust Coming - Multiple Your BTC w XTZ Bitcoin MultiplierTezos until we Bezos. XTZBTC is looking really good for a reversal. Bitcoin should hold steady with institutions holding it down at $30k. This is a great time for altcoin laggards to shine. XTZ will have a candle close above the 50 day EMA and the bull trend should continue. Tezos trust is coming - load up


XTZUSDT: Waiting for a falling wedge breakout herePotential breakout setup for this coin.
We may be looking at a down day today but waiting for the close.
Altcoin market cap needs to stay above 155 billion for this setup to remain viably bullish. Otherwise, I will pass.