Target Beats Expectations Despite Sales Dip.Target Corporation ( NYSE:TGT ) has defied expectations with its latest earnings report, showcasing resilience in the face of challenging market conditions. Despite a dip in holiday sales, the retail giant reported a surge in earnings for the fourth quarter, surpassing analyst estimates and instilling confidence in investors. As the company sets its sights on 2024, it unveils ambitious plans to boost store traffic and reignite sales growth through innovative strategies.
Earnings Surge Amidst Sales Decline:
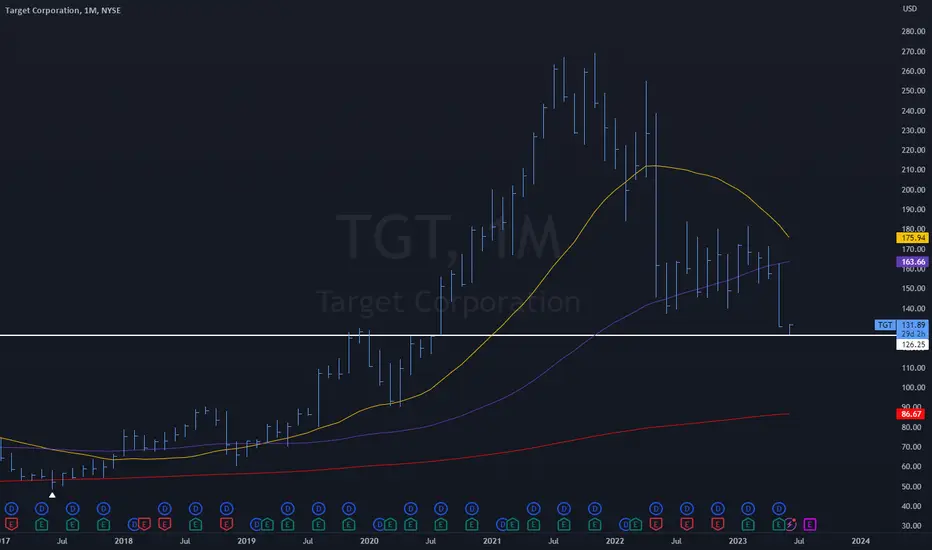
In a surprising turn of events, Target ( NYSE:TGT ) reported a significant increase in earnings for the holiday quarter, with adjusted earnings per share (EPS) reaching $2.98 compared to $1.89 in the same period last year. This remarkable surge comes despite a 4.4% decline in comparable sales, which was lower than the 4.6% decline anticipated by analysts. The company attributes this resilience to a recovery in online sales, driven by a robust Black Friday and Cyber Monday performance.
Strategic Initiatives Driving Growth:
Target's success can be attributed to its strategic initiatives aimed at enhancing customer experience and driving sales. The introduction of same-day pickup services, such as Drive-up, has proven to be a game-changer, accounting for more than 10% of total sales in the quarter. Furthermore, the rollout of new product collections and the launch of a membership program are expected to further stimulate spending at Target stores.
Navigating Challenges and Embracing Opportunities:
Despite facing challenges such as inflation and retail crime, Target remains steadfast in its pursuit of growth. By focusing on expanding its product offerings and improving service offerings, the company aims to capitalize on emerging opportunities in the retail landscape. Additionally, Target's commitment to innovation, as evidenced by its consideration of a new paid membership program, underscores its determination to stay ahead of the curve.
Outlook for 2024:
Looking ahead, Target ( NYSE:TGT ) projects adjusted earnings between $8.60 to $9.60 per share for 2024, signaling confidence in its ability to sustain profitability amidst evolving market dynamics. Furthermore, the company expects annual comparable sales to be flat to up 2% this year, demonstrating optimism regarding its sales recovery trajectory.
Investor Sentiment and Market Analysis:
Target's upbeat earnings report has elicited a positive response from investors, with shares surging by as much as 11% in premarket trading. Despite some moderation in gains, the stock remains undervalued, trading at a favorable forward earnings multiple. This indicates potential upside for investors and reflects market confidence in Target's long-term growth prospects.
Conclusion:
In conclusion, Target's ( NYSE:TGT ) stellar performance in the face of adversity underscores its resilience and adaptability as a retail powerhouse. With a clear focus on driving innovation, enhancing customer engagement, and delivering shareholder value, the company is well-positioned to navigate challenges and capitalize on opportunities in the dynamic retail landscape.
TGT

TGT earning On Tuesday, March 5th, 2024, NYSE:TGT will announce its earnings. Investors eagerly await the outcome, particularly considering recent store closures and potential price adjustments. Will this event bring positive results, or will it signal a downturn for the company?

$TGT Fibonacci Support or Double BottomIn the case of Target Corporation ( NYSE:TGT ), the consideration of whether to rely on Fibonacci support levels or to wait for a potential double bottom formation around $90.17 involves a strategic decision based on technical analysis principles.
### Fibonacci Support Level
- **Fibonacci Retracement**: This tool is used to identify potential support levels based on key Fibonacci ratios (23.6%, 38.2%, 50%, 61.8%, and 100%) calculated from a prior price move. If NYSE:TGT is currently near a significant Fibonacci level, this could indicate a potential area where the stock might find support and possibly rebound.
- **Confirmation**: Traders often look for additional confirmation signals at these levels, such as candlestick patterns, RSI divergences, or volume changes, to validate the strength of the Fibonacci support.
### Waiting for a Double Bottom at $90.17
- **Double Bottom Formation**: This is a bullish reversal pattern characterized by two distinct lows at a similar price level, with a moderate peak in-between. If NYSE:TGT approaches $90.17 and forms a pattern that resembles a double bottom, it could signal a potential reversal from the downtrend.
- **Confirmation and Breakout**: Confirmation of a double bottom would require a rally above the peak between the two lows. This breakout is often accompanied by increased trading volume.
### Considerations for Investors and Traders
1. **Risk Tolerance and Time Horizon**: Your decision might depend on your risk tolerance and investment time horizon. Fibonacci levels can provide earlier entry points, but with potentially higher risk if the support level does not hold. Waiting for a double bottom formation may offer more confirmation but could result in a higher entry price.
2. **Market Context**: Consider overall market conditions and sector performance. Macro factors and company-specific news can influence the effectiveness of technical patterns.
3. **Additional Indicators**: Utilize other technical indicators and analysis methods to supplement the Fibonacci and double bottom analysis, ensuring a more comprehensive decision-making process.
4. **Active Monitoring**: Both approaches require active monitoring of the stock’s price action, particularly near the critical levels of interest, to make timely decisions based on the evolving technical landscape.
In summary, the choice between relying on Fibonacci support and waiting for a double bottom at $90.17 for NYSE:TGT should be made based on a blend of your trading strategy, risk tolerance, and corroborating signals from other technical indicators and market analysis.

Bearish on TGT.
Good evening everybody. I am bearish tomorrow on TGT because we did not close above yesterday's close. Also, we were green but our volume was very low, also we are riding an upward trend line that I drew on the 1 hour chart. I will look for a break of trend-line support and retest to the previous horizontal support. But, if we go up, you can see my scenarios in the picture. Thank you as always for looking at my analysis.

Pending dead cat bounce towards 140?This could be close to its "a bottom". If we have year-end rally, this could hit 140s and then die again. SL 95.

May be close to a bottom, pending dead cat bounce?It could be rough next couple of weeks. Market can rally from middle of October until early January. This can continue to crash next year as showed with my arrows.
This is just a prediction and not an advice.

XLP - Staples are lagging the market XLP has had horrific downside price action over the last several weeks.
As it approaches the Weekly 200 MA I do anticipate a bounce to occur.
Not many sectors are near the weekly 200 MA.
Buying this at the Weekly 200 MA has proven to be a great long term entry for investors.
If a bounce occurs and bearish consolidation on the weekly chart occurs, this sector will likely be a good short side play.
I would never short this sector now since its had a big decline. A bounce is more favourable at this point.

TGT Target Corporation Options Ahead of EarningsLook at how perfectly this TGT price action was followed:
Now analyzing the options chain and the chart patterns of TGT Target Corporation prior to the earnings report this week,
I would consider purchasing the 136usd strike price Calls with
an expiration date of 2023-8-18,
for a premium of approximately $2.66.
If these options prove to be profitable prior to the earnings release, I would sell at least half of them.
Looking forward to read your opinion about it.

TGT stock has both stepped back on 2.618 in golden sectionTGT stock has both stepped back on 2.618 in golden section
This figure shows the weekly candle chart of Target Corporation's stocks over the past two years. The top to bottom golden section is superimposed in the figure. As shown in the figure, Target Corporation's stock peaked three times in August and November of last year, reaching its highest point in January of this year, reaching the 1.618 position of the golden section in the figure! Moreover, the two low points of Target Corporation's stock this year have both stepped back on the 2.618 position in the golden section of the chart, and are about to reverse and move upwards!

Will it hit my $TGT?With NYSE:TGT struggling to find its footing after its May downturn, it's due for good news. The upcoming earnings report might be the catalyst needed to challenge the persistent downward trend. Despite lagging behind NASDAQ:AMZN and NYSE:WMT , TGT is working hard to regain ground it suffered from overstocking issues and inefficient offloading strategies like promotions and sales, logistics updates, and donations. Anticipate news about these strategies, and potential dividend increases to attract new investors.
Bullish Case - TGT, currently range-bound, is trying to incorporate pandemic-related impacts into its pricing. It's at least a $150 stock and should be valued accordingly. The downtrend is a reaction from major investors who want resolution to existing issues and a plan for longevity. They've had plenty of time to address these issues.
Bearish Case - It's a range-bound distribution phase. Note how it's retracted over 50% of its gains from the pandemic low. Typically, continuation is 38%, but it's even surpassed the .618 golden ratio. It would be wise to avoid complications and let sleeping dogs lie. Claiming it would return to pandemic levels is too aggressive, but a price just above $100 should attract stronger supporters for a rebound.
Conclusion - TGT isn't a fan favorite, and understandably so. However, the aggressive pullback is noteworthy, even WMT didn't face this level of pressure. The chart below shows a substantial divergence, presenting an opportunity. At this point, the ball is in TGT's court. How they act in the latter half of the year will determine their fate.
Bullish - 140.27
Bearish - 125.25

Target-ing (TGT) a LongThe Setup
Target NYSE:TGT has had a very bearish fall off All-Time-Highs over the last 2 years. It has finally retraced the entire length of its run from the 2019 Pre-COVID High and returned to it as potential Support. Price MUST hold here or else continue down to lower levels in the "Valley of Risk". It is worth a trade off this level.
The Trade:
Today on the opening 30 minute spike we got such an opportunity for a low-risk entry. The price spike had an acceptable ATR Clearance per my rules and happened on the 50% Retracement of the June low to June high. The first Target is the June high with a following target of the 50% Retracement of the 2023 bear trend around 153.39.

TARGET has more room to the downside, reversal zone identifiedThis idea is based on Wyckoff's method for determining price objectives using the Point & Figure count of distribution ranges. We can see multiple distribution ranges following both schematic 1 and schematic 2 for Wyckoff's distribution.
If we take count the ranges separately, this yields a potential reversal zone between 105.5 and 84.50 dollar per share.
All other information is on the chart.
Good luck,
NQDecipher

TGT monthly chart support TGT monthly chart support at 126, it needs to stay above this level, next support is the 200 monthly moving average.
Target boycott is priced in. Target looks priced in here with a nice technical setup in major demand. TD9 printed yesterday, and we've got a nice hammer forming this morning. I could see a test to $140 within days on this stock.

Target TGT Is it a buy or sell?TGT is presently selling off as a consequence of a social media retail boycott of sorts which
developed after the Bud Lite episode. In the meantime, it had decent earnings despite the
impending or present recession. The volume profiles show previously the highest volume of the
trading range was $ 155 but now it has fallen to $139. So should a trader consider the earnings
and buy this discount or instead pay attention to sentiment and short TGT?

TGT Target Corporation Options Ahead Of EarningsIf you haven`t sold TGT here:
or bought it here:
Now Analyzing the options chain of TGT Target Corporation prior to the earnings report this week,
I would consider purchasing the 160usd strike price Calls with
an expiration date of 2023-5-19,
for a premium of approximately $5.75
If these options prove to be profitable prior to the earnings release, I would sell at least half of them.
Looking forward to read your opinion about it.


Dollar General (DG) a recession stock is Trending UpDG had a swing low in mid-March. While it has retraced well, it is still 15% below the YTD high
On the 2H chart, the retracement uptrend is accompanied by a persistent volume of about 2X
that of March and before. I am supposing that with an early or light recession underway, value
sensitive consumers are delivering DG more revenue from its retail operations and will continue
to do so. The zero-lag MACD is showing a buy signal; I will take a long position and watch
for signs of overextension or loss of directional strength as an exit in due time.

Target to find resistance at swing highs?Target - 30d expiry - We look to Sell at 180.35 (stop at 186.64)
Levels above 180 continue to attract sellers.
181.70 has been pivotal.
Early optimism is likely to lead to gains although extended attempts higher are expected to fail.
This stock has seen poor sales growth.
Preferred trade is to sell into rallies.
Posted a Treble Top formation.
Our profit targets will be 164.64 and 161.64
Resistance: 160 / 170 / 175
Support: 155 / 153 / 150
Please be advised that the information presented on TradingView is provided to Vantage (‘Vantage Global Limited’, ‘we’) by a third-party provider (‘Signal Centre’). Please be reminded that you are solely responsible for the trading decisions on your account. There is a very high degree of risk involved in trading. Any information and/or content is intended entirely for research, educational and informational purposes only and does not constitute investment or consultation advice or investment strategy. The information is not tailored to the investment needs of any specific person and therefore does not involve a consideration of any of the investment objectives, financial situation or needs of any viewer that may receive it. Kindly also note that past performance is not a reliable indicator of future results. Actual results may differ materially from those anticipated in forward-looking or past performance statements. We assume no liability as to the accuracy or completeness of any of the information and/or content provided herein and the Company cannot be held responsible for any omission, mistake nor for any loss or damage including without limitation to any loss of profit which may arise from reliance on any information supplied by Signal Centre.

Target (TGT) Has A Falling Wedge!A falling wedge pattern was identified on Target’s ( TGT ) daily timeframe . The activity from Friday shows an increase of buying pressure. Furthermore, Friday’s (24 MAR 2023) candle shows strong interest from buyers with the bounce off the lower trend line .
Harmony,
MrALtrades00

2 profitable positions for TGTThe 4-hour chart shows the rising lows of $TGT, although in an oscillating trend, there is a better entry position, with a stop loss at the previous low and a profit position adjusted according to the position and the trend of the broader market, respectively at 175 and 181

LOWE'S - Look For Longs. $245 Is the Target for ShortsQuick read, for once.
Lowe's is down 7% following ER. Another ER dump. This is really notable for a few reasons:
1. Big moves on the first of the month always make me think reversals
2. Lowe's isn't really bearish on monthly or weekly bars
3. The real short setup for economic disaster is in the $240 range
4. Dump swept out weekly/monthly/daily sellside pivots
5. Gap fill
6. Overall market is not as bearish as it was during last Lowe's ER dump
7. Equities market makers love to "gamma squeeze" rip the other way after a little bit.
However, the weekly bars do show a three drives-style pattern
But it's only the wicks over range equilibrium and it's never traded to a deep premium, which is what you really want to see before new lows are going to be set.
Monthly shows that this isn't a bear market, either.
March 31 $200 calls lost $8.5 on the news.
You still have to be super careful because of geopolitical risks:
1. The Chinese Communist Party has not reported a single COVID case since Jan. 10, and this is almost impossible to be real. The reality is that the CCP is likely very, very weak right now and could fall at any time.
2. Elon Musk has warned, which confirms with multiple other sources, that Russia is about to launch a very large scale offensive in Ukraine. He would know because Starlink is the only thing keeping Ukraine with even a shred of hope in the battle. Equities down, commodities up is what that will result in, just like when the war was launched last year.
3. When it's time for the CCP to go, and it's going to happen very soon, you can expect there to be a clash between the India-Russia-Saudi/BRICS type entities and the United States/NATO globalists because everyone wants China. All the "hawkish" chatter on "China" (note it's rarely ever against the CCP itself) (("China" is not "the CCP")) from America is gearing up to take over the Mainland by way of the globalist groomed Chinese nationals it has parented so as to install all the woke globalist things and completely ruin what little is left of the country's 5,000 year culture as they go for a real New World Order/One World Government
With the way everything is acting I kind of suspect Lowe's may not be finished dumping, but imo this is one of those situations where one should "be greedy only when others are fearful."
$186 would be a really sweet entry and you have to sit on your hands for 2 or 3 months or at least roll out your winners.
See my Nasdaq/SPX/Dow calls for thoughts on the markets at large and potential timing.
July is the target for when things really get scary.

$TGT entered the squeeze going up?$TGT rises in technical breakout with no new catalyst except couple of analyst rating.
Target is expect to report their earning this week on 02/28/23 before market opens.
sometimes this happens when the stock is about to announce its earnings or pull back.
as fed rates continues to rise the interest I believe consumer will shop more wisely
on current market inflation.
but with these cyclical market I think retailers and other consumer goods are still
a good defensive stock.
I'm not really confident on their up coming earnings based on their last earnings.
TGT misses the eps last time despite the holiday boost.
here's my price level for TGT
TGT average price move per day is $4-$5 per day depending on market volatility and catalyst.
Below is the price level I'm looking for entries and exit for TGT:
Buy call above 168.68 and sell at 170.90+ or above
Buy puts below 165.79 and sell at 163.77 or below
make sure that you set up alerts on those key level so you wont miss the move.
and always to take your profits as you see one.
