TGT BUY OR LONG , TARGET UP TO $180+Keeping the correction, Flag tightened I guess it will soon give me the expected results don't forget that I always stop loss no more than 6-8%.
TGT buy : $150
TGT target : 180+
Stop loss : 5% .
Wish you have a good deal !
TGT

Target - Pullback tradeThe markets have been selling off over the past few days, leaving most of the sectors in the S&P 500 in the red. A stock that caught my eye today was Target. The discount store's stock prices have been trading near it's 21 day exponential moving average only dipping beneath it temporarily throughout intraday trading sessions. Despite the warning signs of what could be another big sell off, I choose to remain bullish on TGT and consider this to be a pullback trade setup. Of course, we might see price dip below the 21 as it has in the past...but that doesn't seem to be more than a day or two. If it does... then consider the possibility that Target is reversing rather than pulling back.
Options speculators should consider the chance of a broad market selloff and at think about using spreads rather than directional plays. If you are trading the stock, plan your trade and trade your plan. Only you know what you can afford.

TGT Bearish IMO -Not Trading Advice-I drew this line & arrow yesterday, it's lining up perfectly. About to fizzle in my opinion.
Not trading advice.
TGT

$TGT PT $150-160Following earnings on Walmart, a good report from target should propel the stock to around $155. It broke the CH. Robnihood traders have already started picking this one up.

$TGT Bring pullback for bears$TGT Opened with ~12% gap up RSI 88 daily ~80 weekly, Cramer pushed up , Good earnings report, without any pullback or somethink else . If tv say buy so you must sell . Lets see how it becomes tomorow.
As usual bear side .


seeing a great Trianlge on TGT. Will enter long long plays seeing a great Trianlge on TGT. Will enter long long plays after Break of the Triangle


TGT Potential BreakoutTGT is testing its highs with an inverse head and shoulders and ascending triangle. WIth a break out confirmed on a close, the top of the ascending channel it is in, the measured move of the ascending triangle, and fib extensions all together give profit taking areas as well as reasonable stops. TGT does not report earnings until August 11th. Unfortunately, this trade setup gets no help from the oscillators.

$TGT Bull FlagAnother Nice Bull Flag - looking for breakout here to retest all time highs at $130 as possible earnings run-up.

Double Bottom and Bullish Divergence on TGTAs you can see, the price action is contained within a descending broadening wedge at the moment, which has appeared to have found a double bottom, with Class A Bullish Divergence on the MACD and Class B Bullish Divergence on the RSI. From my entry point at $92.84, if the trade reaches the 382 fib retracement, that would be a 9.23% gain. If it reaches Dow's 50% retracement, then it will be 12.83%, and if it goes so high as to reach the top of the descending broadening wedge where it will run into the 618 Golden Zone as well as the 200 and 50 day moving averages as resistance, I will see a profit of 16.44%.
It's worth noting that bullish divergence is not as reliable in a bear trend.
None of this is financial advice, and I am not employed or affiliated with Apollo Trading in any way. I am, however, interested in hearing critiques and criticisms of this idea.


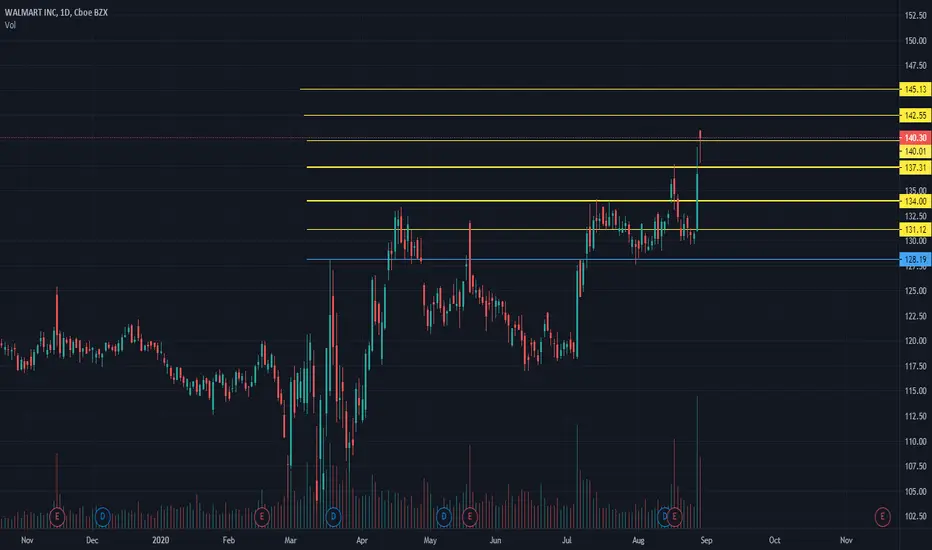
TGT BUY OR LONG , TARGET UP TO $150 TGT will confirm the triangle pattern at $125, the triangle pattern for the target to $135 but the resistance is at $130
and if it breaks past the old peak of $130, TGT will have a chance to touch $150.
- Price is above support 1d (MA200)
- MACD supports the new rising trend
- Volume is awaiting confirmation
=> Offer to buy in two zones ($125 + $131) at a rate of 50% + 50% <=> ($125 +$131) = price average $128
=> Stop loss : 10%
=> Target $150
Wish you good deals!


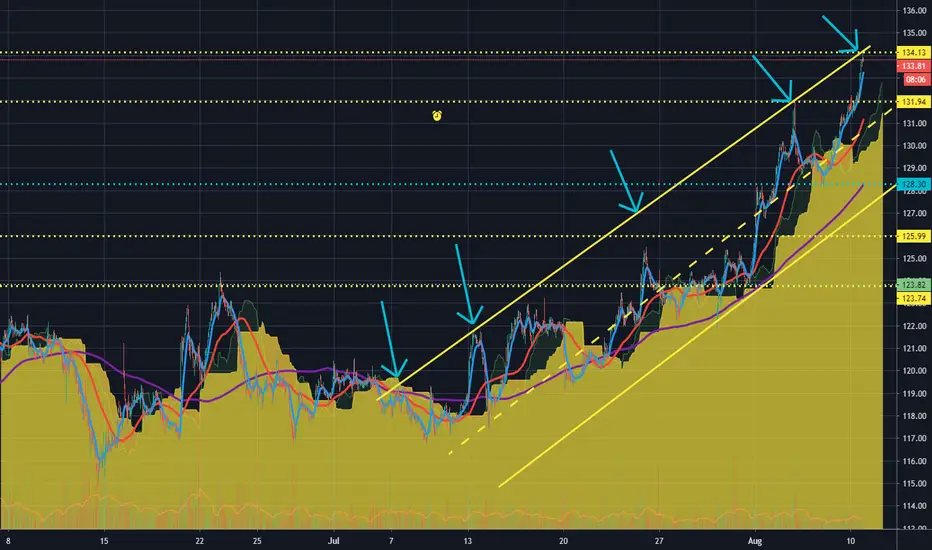
TGTTGT has been forming a nice consolidation lately with a strong resistance area from around 122.80 to 123.60. Looking for a continuation of the strong bullish day yesterday after today's panic sell brought it down. Note the 20SMA looking ready to cross up the 50MA, which can help push it past the resistance area and possibly make a run to 126.


