Why GRT price growing and what do GRT and ChatGPT have in commonToday we will talk about the GRTUSDT trading pair.
The downward trend in the GRT price began in February 2021, almost a year earlier than most altcoins. Because in 2021, interest in DEFi projects began to wane. The Graph is an indexing protocol for querying data for networks like Ethereum and IPFS, powering many applications in both DeFi and the broader Web3 ecosystem.
Now, interest in the DEFI sector is returning a little bit, and the volume of locked assets (TLM) is increasing, but it is hard to believe that these events provoked such a rapid growth in the GRTUSD price. Moreover, price growth on falling volumes is not okay.
No matter how ridiculous it may sound, we assume that many crypto users buy GRT because of the similarity in sound and spelling to the hype ChatGPT
And if our assumption is correct, we can congratulate all of us - the alt-season is near . In our memory, the last time it happened was in 2017, when users did not really delve into the essence of the project but bought it because it would be more expensive tomorrow.
And if we are wrong, please correct us in the comments below the idea.
As for the possible movement of the GRTUSDT price, we are more inclined to the white scenario, where the price will not be able to gain a consolidated above $0.18-0.20 and will begin a correction to the $0.11 area.
On the other hand, if the hype around GRT continues, which we don't understand, and the price is able to gain a foothold above $0.20 . We don't see any strong obstacles to continuing the rapid growth to $0.39-0.40 on the chart.
_____________________
Did you like our analysis? Leave a comment, like, and follow to get more
Thegraph

GRT in Motion: A 1-Hour Trading Chart Analysis of the Fast-PacedIntended Audience: New traders just learning to Trade Crypto
Fundamentals:
GRT is a cryptocurrency built on the Solana blockchain, designed to provide a fast, secure, and efficient platform for decentralized applications and digital assets. GRT aims to offer a scalable and low-cost solution for businesses and developers to build and launch decentralized applications and digital assets.
The platform provides a range of tools and services, including a high-speed decentralized exchange, a marketplace for digital assets, and a suite of developer tools to help businesses and developers create new decentralized applications and digital assets.
GRT aims to make it easy for businesses and individuals to participate in the decentralized economy and to access the benefits of blockchain technology, such as fast and low-cost transactions and increased security and transparency. By offering a fast, secure, and efficient platform, GRT aims to empower businesses and individuals to build the next generation of decentralized applications and digital assets.
Technicals:
A 1-hour chart analysis of GRT can provide valuable insights for short-term swing traders of the cryptocurrency. The recent 30% increase in the price of GRT in the last 34 hours is a significant event that can impact the short-term performance of the asset. By examining the price trends, volatility, and volume of GRT over the past hour, it is possible to make predictions about the short-term performance of the asset.
For instance, the recent price increase in GRT, accompanied by high trading volume, can indicate a sudden increase in demand for the asset, which can be a good opportunity for short-term swing traders to take advantage of the price increase and sell at a profit. However, if the chart shows a lot of volatility and price swings, it could signal a lack of market stability, which may be a concern for short-term swing traders.
Additionally, a 1-hour chart analysis can also provide insights into the impact of any major events or news on the price of GRT. For example, if there was a significant spike in price following the announcement of a new partnership or product launch, this may indicate that the market is optimistic about the potential of the project and that short-term swing traders may benefit from this positive sentiment.
Overall, a 1-hour chart analysis can provide valuable information for short-term GRT swing traders to make informed decisions about their investments. By monitoring trends and staying informed about market conditions, they can make more informed decisions about buying and selling GRT, and potentially capitalize on short-term price movements.

GRTUSDT, new opportunity to growth, THE GRAPHHello guys. As you can see on the chart, finally the breakout happened and pullback and new ascending is on If the whole market follows. So I expect growth to the first target and then next targets. The targets will be 13 - 23 - 30 - 50.
Good luck.
If you like the idea, do not forget to support with a like and follow me for next analysis :)
Write your comment and opinion below for me

GRT - Clean Wedge Pattern! 🏹Hello TradingView Family / Fellow Traders. This is Richard, as known as theSignalyst.
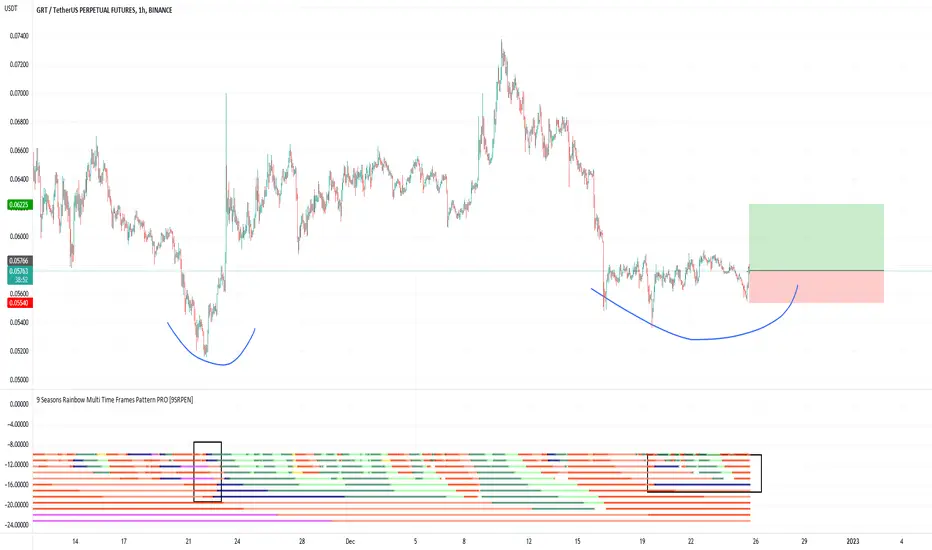
GRT has been overall bearish trading inside the red wedge pattern and it lately rejected a demand zone 0.05
🏹 For the bulls to take over, thus have a shift in momentum from bearish to bullish, we need a break above the last major high in blue.
Meanwhile, until the buy is activated, GRT would be overall bearish and can still trade lower inside the demand zone .
Always follow your trading plan regarding entry, risk management, and trade management.
Good luck!
All Strategies Are Good; If Managed Properly!
~Rich

GRT/USDT. We are waiting that price coming back to the yellow area, we need retest that area and close a 4H candle above it, after that we can open a Long till 0,64 surely.
Open 0,05870 * Take Profit 0,064 * Stop Loss 0,057

GRT The Graph LONG TRADE 20221225Demand Zone
Signal: Blue * N in different timeframes
GRT , The Graph, GRTUSD , GRTUSDT, GRTUSDTPERP , CRYPTO,CRYPTOCURRENCY
DISCLAIMER
This is only a personal opinion and does NOT serve as investing NOR trading advice.
Please make your own decisions and be responsible for your own investing and trading Activities.
The Graph Goes Bullish | 75% Potential Short-TermThe Graph vs Bitcoin (GRTBTC) is breaking out of a strong downtrend confirmed by the RSI, volume and EMA50.
EMA50 because it moves above this level today; Confirmed.
RSI very strong at 60+; Confirmed.
Volume breakout with two consecutive days green... Confirmed.
The down-trendline is also the upper boundary of a major falling wedge.
Another strong signal in favor of the bulls.
Early 2023 goes GREEN!
Thank you Crypto!
Namaste.

GRTUSD On the 4H MA50 again, bullish short termGRTUSD hit today the 4H MA50 (blue line), where last time had a rejection (Nov 23).
Pattern: Falling Wedge, 4H time frame.
Action: Buy target Fibonacci 0.5 and 0.618.
Sell if rejected on the top of Falling Wedge, target 0.05200 support and -0.382 Fibonacci.
Buy above the 1D MA200 (orange line).
Please like, follow and comment!!

TheGraph Protocol- Keep things simple.
- Big projects take time but will make the safest rewards.
-------------------------------------
Medium Term Targets
-------------------------------------
TP1 : 0.5$
TP2 : before 1.8$
-------------------------------------
SL : No need
-------------------------------------
Happy Tr4Ding !

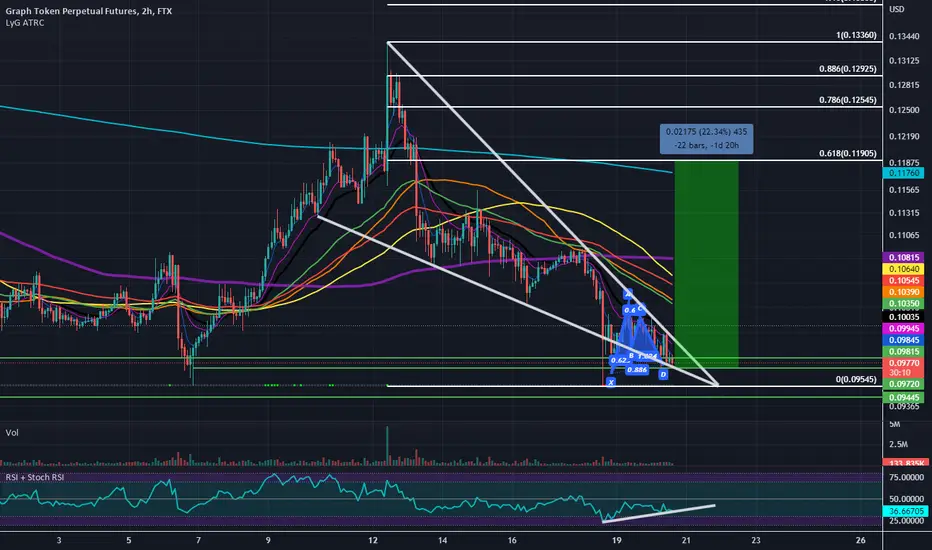
Falling Wedge With Bullish Divergence and Bullish Deep GartleyWe have a promising looking Falling Wedge Visible on the Hourlies with a small Deep Gartley at the Bottom. My target here will be the .618 retrace and the SL will be below the previous major low to our left.
GRT/USD - Juicy breakout in progress. 😍GRT - this thing can run if the market allows.
Downtrend appears finished in my eyes. Bullish indicators and chart/price action.
A good target 0.12$ if momentum picks up. Volume is not that great, but decent.
Bias is bullish, but watch BTC/ETH as they are about to decide where they go next.
Like and follow if you liked my idea!

GRT/USD - Breakout approaching key resistance! 🚀If you checked my past analysis, this pump was pretty much in the cards for a while.
What I did not anticipate was this re-test of the breakout with the price falling on the top of this wedge to confirm it as support.
Nevertheless, the price action is clear and GRT is well on its way towards 12 cents.
Some profit taking at 12 cents could take place so best to consider what is your timeframe for this play.
GRT could very well go much higher, the ATH was at $1.3 so about 10x from here. Bias remains bullish for now.
Like and follow if you liked my idea!

The Graph 80% Target MappedHere we an altcoin's btc pairing that has a chart that is identical to the major altcoins usdt pairs...
What does this mean?
Bullish...
We are going ultra low risk on this setup.
The risk is set at ~6%.
The potential target is set at ~80%.
That is all for today.
Namaste.

🌀GRT- Expanding wedge accumulationThe price reached previous accumulation zone and formed an expanded wedge (increased volatility)
If we see a breakout from the formation followed by a successful retest of current local resistance (~0.38) we can expect another bullish wave soon.

GRTUSDTGRT has bullish signal, Yesterday we saw panic sell of crypto traders because of the BTC pullback (I think the main reason is the first day of the week) Hope this week will be bullish for us.
Good Luck!

THE GRAPH (GRT) ABOUT TO EXPLODE!!@@GRT is looking very sound, crypto god don't do it to us again. Next 3 months should TERRIFIC

GRT/USD - Uptrend lost. Price will seek support. 😱See chart. The resistance at the key fib level was too much for GRT.
So long it does not break above it price will seek support.
Bias - BEARISH short term. A higher low would be nice.
Like and follow if you liked my idea!

GRT The Graph price movement predictionPrice Prediction
not financial advice
this is for entertainment purposes only
always DYOR
smash the like button

The graph from price action perspective. Folks,
The graph a project I like.. And it is looking good to be in a 2nd leg pump to do BREAKOUT test.
This BREAKOUT test is something we see similar after hitting Support and bottoming..
Look for the forecast and the symmetry between 1st leg and 2nd leg..
This is WHY I love trading and technical analysis it is freaking art, my friend.
Again no fancy MACD's or bla bla bla indicators. No pure price action!!

The Graph Goes Bullish (119%+ Mapped)The Graph (GRTUSDT) has gone bullish...
If only we knew yesterday about this one... :D
We have the highest volume since February 2021 right before a massive bullish wave.
Another one can be starting now, we can tell because prices are moving above EMA50.
Confirmation comes on candle closure TODAY.
EMA50 stands at 0.4103.
Closing above this level, we can expect a change of trend.
Getting in at the bottom is the best possible scenario...
Low risk with high potential rewards.
Thank you for reading.
Namaste.

MY VIEW ON THE CURRENT SCENARIO IN GRTBUSDTechnical analysis regarding the price of THE GRAPH in relation of dollar Binance for the next scenarios, based on daily movement.
Price has been going downhill for a long time, leaving bottoms and tops lower and lower. At some point, we have to expect a resumption in its high, correct!?
GRT is a well-established project with excellent fundamentals, it has everything for a good valuation at its price. Its governance is faithful and so far delivers what it says.
In a more technical view, the price is with the RSI above 50 (>60), with the MACD gaining momentum (buying mass coming in heavy) and, it should be noted the very considerable volume, plotted below the MACD, notice the expression of the volume.
I believe the price will seek the targets projected on the chart. And, there is also a very noticeable resistance region just above that the price could go to test.
disclaimer
*** In accordance with CVM Instruction No. 598, of May 3, 2018, Art. 21, I declare that the recommendations of this analysis reflect solely and exclusively my personal opinions and perceptions and that they were prepared independently and autonomously. Not being considered a purchase and/or sale recommendation. ***
Any questions do not hesitate to contact me. I'm happy to be able to help you in the best way I can. 🙏

Is the downtrend for GRT done?Here is what I see with GRT at the moment:
The bullish:
1) The green box I have drawn is GRT'S last key zone of support. I am getting this from the touch that GRT made shortly after launch and proceeded to rally over 1000%. Ever since then we have yet to re-test this box.
2) We have daily bullish RSI and MACD divergence. Always a good sign.
3) We have been in a downtrend for a very long time and have pretty much re-entered the price zone that the coin launched at.
4) It appears we are starting to break above the ema ribbon. The spread is also relatively small. A good sign.
The bearish:
1) We have a 60% ichimoku cloud above us. I have to suspect this will offer some sort of resistance, especially since we have yet to test it during this year long downtrend.
2) The red box marks a key area of resistance for GRT. This area lines up relatively well with the ichimoku cloud, supporting the idea that we will likely see resistance in this range.
3) I suspect the 200 daily ema will enter this range around the time GRT hits it, that is, if it does. This strengthens the previous two points even moreso.
4) Volume is pathetic
My take:
This is a bit of a risky play right now as GRT is heading into some substantial resistance. I still suspect some upwards movement in the short term, but only into those resistance levels, however I suspect something like scenario 1 will play out, especially if the overall market sentiment turns around in the next couple of months which I believe is to be expected.
If we lose the green box we will likely set new all time lows for GRT. Since it has lost so much of its value already, i'm inclined to believe that this wont happen.
If I were to go long I would wait for a retest of the green box, potentially after the resistance levels reject GRT.
Remember, this is not financial advice and always do your own analysis/research before making any decisions on the market.

The Graph GRT Price Targets and Stop LossEntry Range: $0.32 - 0.40
Price Target 1: $0.53
Price Target 2: $0.75
Price Target 3: $0.86
Stop Loss: $0.29
