BTC DOMINANCE UPDATE- So, all elements are annotated throughout the graphic, like always.
- Timeline.
- Older Top Dom (2021) (red doted line).
- New Top Dom (2025) (red line).
- Some supports ( Orange Line ).
- Some Bottoms ( Green Lines ).
- Most important in chart : Fibonnacci Retracements.
- After this chart, I’ll drop links to my older BTC dominance posts.
- Not much to say, just look at the chart :
- In 2021, BTC.D formed a double top because Bitcoin spiked twice and hit two all-time highs.
- That doesn’t mean BTC.D will behave the same way in 2025. I don't expect another double top, but who knows.
- We could see a retracement down to the 45–47% range. That would likely signal the start of a new bear market.
- For now, i don’t see the end of the bull run yet. I’m mostly waiting for a strong BTC push in price, a fast dip in BTC Dominance, and the kickoff of Altseason.
— it’s going to be wild and fast! Just my personal opinion.
Stay Safe !
Happy Tr4Ding !
Theking

TheKing Cycles- Nothing can be perfect in Life or in Trading, but you can always brighten up your day.
- Remember "Cycles are Cycles"
- Everything is in graph
- You can follow bears, predicting 10 years of recession, but we are in a big recession and for a long time already.
- You can fall in the deep and predict the darkness.
- i like to see the sunshine in the morning and i will always radiate warmth.
- Follow Hope, and always believe in your own judgement.
- Be Bold and do the opposite of what commons peoples think.
Happy Tr4Ding !

The Crypto Era- Just updated an old chart!
- If you want to know where we stand, it's clearly outlined on the chart.
Some older Analyses :
- HODL strong!
Happy Tr4Ding !

Bitcoin Early, Not LateA simple graphic with all annotations included :
- Trend.
- Fibonnacci.
- Middle Line.
- Support and Bounces.
- Resistances and dips.
- Everyone gets Bitcoin at the price they deserve.
- Not a price Prediction, keep things simple.
Happy Tr4Ding !
Dominance & Altcoins- This graph is purely based on fibonacci law.
- 61.8% is the core of the system ( check rectangles in graph to get it )
- Most of long term traders not even look at the price.
- they just wait the good time to buy using Fibo.
- in 2016 BTC was almost 100%. Altcoins were inexistant. (less than 2% of the market with ETH)
- in 2021 BTC Dominance pushed to 75% (altseason followed the push)
- in 2024 we could see BTC dominance knocks 60% ish ( Altseason will follow )
- BTC is maturing.
- Cryptos are growing.
- Don't look too much at your altcoin wallets.
- Most of the time the story repeats itself.
- Respect the cycle, be patient and eat noodles!
Happy Tr4Ding !

Market3I haven’t been posting much lately simply because there’s nothing particularly interesting to say, the market has been a bit dull.
2025 should be a strong year for altcoins, as they’ve been consistently suppressed. With BTC dominance reaching 64%, which is quite significant, all attention remains on Bitcoin.
On this chart, you can see that $1.17 trillion acted as a rejection level for the crypto market (excluding BTC and ETH). Time will tell, but I anticipate a $4 trillion altcoin bull market before the end of 2025.
Remember, Fibonacci plays a crucial role in long-term market predictions.
Invest wisely and at the right time.
Happy Tr4Ding !

Altcoins The Moon AwaitsLike always, everything is clearly outlined on the charts :
- As a trader, it's crucial to follow logic and technical analysis. If you get caught up in the news and listen to everyone on Twitter, you won't last long.
- The first major altcoin rally was in 2018, pushing the market to $300 billion. This level later acted as a key support throughout the 2022–2023 bear market.
- The last all-time high for the crypto market (excluding Bitcoin and Ethereum) reached $1.15 trillion in 2021. ( blue doted vertical line )
- This all-time high was retested in December 2024, with this ATH acting as strong resistance. ( second blue doted vertical line )
- The next move could be a breakout above this resistance. According to Fibonacci projections, the altcoin market has the potential to reach $4 trillion.
While the spotlight remains on Bitcoin and ETFs, altcoins could catch up with a sudden and powerful surge, so make sure you’re not left behind.
Hodl!
Happy Tr4Ding !

Bitcoin Lines- What you can see if you remove Bars and replace them by Lines ?
- Congratulation, you just removed the noise in the chart.
- Everything is in graph.
- Covid19 Black Swan included.
- Not a price prediction.🤷♂️.
Happy Tr4Ding !

Dominance the system core- for me it has always been very complicate to explain BTC.D to peoples, because it's complicate ! lol
- it's weird to understand the moves and many factors have to be compared together an alchemy have to happen to see something happening.
- So basically to explain it, i will tell you what "we want to see" or "what we don't want to see" in the future. if the story repeats again.
1/ BTC.D have to grow up, then Altcoins will struggle down trying to find a potential bottom.
- While BTC.D grow up, BTC price have to grow up also or at least stabilize ( this is a good sign )
2 / if BTC price down and BTC.D up, it's bad, it's just the normal way ( No Divergence )
- When BTC price + BTC.D both up together, it's a kind of " inversed divergence ", it means something good gonna happens. ( get it ?)
- Basically also if USDT/USDC Dom Grow and BTC price stabilize and not goes down anymore, it's a good sign.
- Normality the normal way is : BTC up / USDT/USDC.D Down OR BTC Down / USDT/USDC.D up.
- Before we had no reason to check those Stables coins because they had not much DOM in markets, but now have to count with them.
- So While BTC.D is growing, altcoins will just make some weak moves.
- When BTC will reach is next Dominance's ATH ( witch have to be lower than last years because more concurrence )
- BTC.D will crash and ALT SEASON will start.
- it took me many years to understand that, but it's pure logic ( Fibonacci is working perfectly on it )
- again it's not easy to get it.
- if you have any questions feel free to add a comment.
Happy Tr4Ding !

Bitcoin Bottom- i saw many traders using vrvp or vpvr like and claiming BTC will go 10k.
- They just don't know how to use this tool and didn't understand how it works.
- if u don't know how to use a tool, simply don't use it. so less people's will rekt. this is an advanced trading tool.
- The Timeline of those tools are VERY IMPORTANT, they cannot be set up from 2015 or 2013.
What happened when BTC was Bearish :
- Actually when BTC dipped from 30,000$ ish, the columns started in the vrpv darker zone ( Less Demand )
- BTC reached 20,000$ and columns started to grow ( Demand Zone but Fear "Retailers" )
- Then dipped 17,500$ and the columns diminished size ( Good Demand " Smart Money" )
- This is at this point that you can detect a BOTTOM Zone. ( Darker zones + Small Columns )
Then what happened when BTC was Bullish :
- if you watch VRVP when BTC was growing you will notice the inverse.
- The Main demand was around 30,000$.
- BTC Reached 50,000$ and VRVP started to be darker ( More Demand impulse "FOMO" ).
- Then BTC reached 70,000$ ( No Demand ). ( Darker zones + Small Columns )
- i will post an exemple under this post to show a bad use of VRVP/VPVR. please don't use it that way.
Happy Tr4Ding !

Choose your Side- i often compare TheKing with Nasdaq right now.
- Have a main reason :
- NAS100 (Nasdaq) have mostly "Top Tech Companies" acting as Thermometers in this index.
- SPX (SP500) have Tech Companies + traditional ones. Nasdaq Companies are also included in SPX, but 500 Companies start to be a lot.
- DJIA (Dow Jones Industrial Average) is a Mastodons, i don't use it much because this top 30 is too mixed ( coca cola, boeing, techs, big banks, nike.. etc).
- i mostly use very high TFs, i prefer look from far, less noise, more easy and less headaches.
- i use sometimes to trade with 1D, H12, H4 TFs but when we are bullish. In bearmarket, it's hard to find entries points in bearish mode.
- i don't short markets and accumulate more coins/tokens, so i just DCA, Dollar Cost Averaging is investing a fixed amount of money into a particular investment at regular intervals.
- so this chart is basically only about MACD :
- it's really interesting to see Nasdaq making another red columns in 3W TF, while the markets should recover slowly.
- if you take a look at BTC, columns stayed in Light Red Color and reducing size.
What could it means ?
- Keep in mind that BTC is not a STOCK.
- One of the most pivotal events on Bitcoin's blockchain is the halving, when the supply of new bitcoins is cut in half (2024).
- BTC have 21M Supplies and that's all. no more will be created.
- At any time BTC could stop to follow Nasdaq and do his way, TheKing used to do that before already.
- A small bounce in Nasdaq could be also a huge move for BTC.
- " Choose your side " and DCA the money you don't need for living.
Happy Tr4Ding !

The Perfect Bounce- Quick update
- IYKYK.
- Everything is in graph, no need a long speech.
Happy Tr4Ding !

Bitcoin Monitoring- This is not a trade setup.
--------------------------------------------
- Zones to keep close surveillance :
--------------------------------------------
- 25,200$
- 27,300$
--------------------------------------------
Happy Tr4Ding!

The Black Swan Method- Making TA as a trader is like reading a magical ball but some major unpredictable events are out of control.
- i usually accurate most of the time but i should be a fool to think i am always right, it's impossible to make TA in that markets conditions.
- So this post is not to make some kind of predictions but to warn peoples on what's going on right now.
- i will try to explain very basically the situation (with my bad english skills, so forgive me if i make some mistakes) :
1/ the first attack was based on Luna and UST, some entities started to short UST/Luna with some billions $, FTX and SBF surely did it. Luna tried to save the situation with their BTC reserve but it was effortless. they lost all. (Luna have never been hacked, important to specify this )
2/ the fail of UST was the first step to create a snowball effect.
3/ 3AC, Celsius, Voyager, and much more were all involved in Luna/UST and Anchor Protocol witch was giving 18% returns on UST. They used customers funds in UST and staked, when the situation started to turn really bad for Luna, they tried to save the situation trading customers funds and they failed. (any of those companies have been hacked, important to specify this )
4/ FTX used customers funds and started to short their own products, FTT, SOL, SRM, etc , Binance saw the move and twitted that they will drop all their FTT.
FTX locked their customers wallets. FTX used 8B$ Customers funds to short markets. they are still right now trying to short USDT on Binance. (FTX have never been hacked, important to specify this).
5/ The snow ball started to be transformed in an avalanche. The damage here is huge. An exchange implosion of this magnitude is a gift to bitcoin haters all over the world.
6/ Sam bankman-fried was a Trojan horse in the crypto space, surely backed by banks and govs, a kind of worm witch have to be eradicated.
7/ Soon bankers will tell you, " u saw what happened with your exchanges ??!!, better use CDBC and stick with Banks!! ", this is their ultimate goal.
- i pray for everyone who got caught up in this mess and lost money with those bad actors.
- i hope you take care of yourself and continue to be a part of this journey.
- i hope it doesn't turn you off of crypto witch are here to stay in the future.
- BTC is resilient. No matter the magnitude of the earthquake.
- Buy BTC
- Store in Ledger, Trezor or Paper Wallet.
- Hodl and come back later.
Have faith in what you believe and fight. Thanks for reading!
PS : Not sure this post will get me banned or censored, but at this point the freedom of speech is an human right.

BTC Diamond Ser ?- While bears see bearish pennants, I see diamonds in the rough.
- I remain bullish, not due to the price, but for the sake of humanity.
- This isn’t an analysis, just a light-hearted joke, so please don’t roast me too hard! 🙏.
- Remember, diamonds are forever.
- Hodl!
Happy Tr4Ding!

The Road to The Mooni like to make some graphs like that when peoples are in Dispair mode.
- i used a modified ADX indicator with a Monthly Timeframe ( thanks to the creator by the way )
- Look at the Mountains and tell me when in past bullruns we stopped at 100 ? - Never -
- The Highest Point is 160+
That said my advice for now is : " You don't really care if TheKing will back to 20k, what you have to care is the Highest point TheKing will reach! "
- Don't Think it's the end of this bullrun
- Don't Listen Fuders
- Use indicators for the Long Term
- Believe in Trends and cycles movements
- Believe in the future of cryptos
- Believe in TheKing because Theking cannot die.
Happy Tr4Ding !

Bitcoin are you Worried ?Everything is in chart.
- Like i said many times, more you look from far, more it's easy to predict the future.
- This Monthly Chart combinated with indicators show you how BTC moved in 2016-2017 BullRun so keep eyes open and you will find the way for 2020-2021.
- We cannot compare a Bullrun from 400$ to 20,000$ with a Bullrun From 4000$ to 3XX,XXX+$, the chart will be exponential. We are now playing with big numbers.
- imo right now we are in fake bear market stage, this stage happened also in 2016-2017 pre-bullrun ( but Numbers were smallers...), whales are just trying to create fear and remove retails investors.
- Actual stage could be a Consolidation Phase, if Whales see there's a lack of interest, they will push BTC up, or we could get a quick fast Trap to 20,000$ if Whales feel Retails not fear enough (Not sell their BTC).
- 100 000$ Target is still very preservative, past this stage it will be the FOMO Stage to go Higher!
TheKing is dead??? Long live TheKing!! :D
Happy Tr4Ding !

Bitcoin 1-Year Pattern- The art of trading lies in analyzing the past to anticipate the future.
On the yearly timeframe, BTC has consistently followed this cycle:
- 1 year of bearish decline.🟥.
- 1 year of consolidation and bottoming out.🟩.
- 1 year of steady growth.🟩.
- 1 year of explosive upward movement.🟩.
based simply on that :
- 2025 is poised to be a breakout year for BTC.
- 2026 should be the next bear market.
- Everything changes, nothing lasts forever, but as a trader, you must stay on course.
- Don't let market noise shake your confidence.
Happy Tr4Ding !

BTC-DOM- BTC dominance can't keep rising indefinitely.
-If we see a BTC dip, BTC dominance could climb to around 66% (71.8% Fibonacci), but in my opinion, that’s likely the maximum.
- If BTC surges too quickly and too high, altcoins will be suppressed, causing BTC dominance to potentially rise also to around 66%. However, once again, I believe that's would be the max.
- After any of both cases, altcoins will start to moon fly.
- 36-bar, 1096-day uptrend on the BTC dominance chart. That’s a significant duration from 2018 to 2021. The timespan from 2022 to 2025 could mirror the previous one.
- Take note also on the Bearish Divergence between the trend and the RSI. ( i will post weekly graphic also to show a more clear view ).
- An uptrend of this length indicates strong, sustained interest in BTC compared to altcoins. However, long-term trends like this are prone to exhaustion.
For now, just hold your alts and practice golden patience.
Happy Tr4Ding !

BTC CME GAP
- A new gap was created this weekend on the CME.
- BTC's price is higher there, which is typical.
- A gap isn’t always filled; while many do eventually close as prices retrace, it’s never guaranteed.
- This isn’t a price analysis, but rather an alert to monitor the gap.
- I’ll add my previous gap analysis in the comments.
Happy Tr4Ding

The Others UpdateThe market is testing your patience, trying to shake you out so they can buy back at a lower price. Stay strong and hold your ground.
Observe the chart carefully, a perfect double bottom was formed earlier, while now the RSI remains elevated, signaling potential strength in Altcoins.
As always, the crypto market will move faster than you can react.
Happy Tr4Ding !

100K The Countdown Begins- We are so close.
- To every Bitcoin holder who has weathered the highs and lows, celebrated the peaks, and endured the troughs—remember, you are not just an investor.
- You are a believer in a decentralized future, a pioneer of financial sovereignty, and a guardian of the idea that true value transcends borders, governments, and time itself.
- Holding Bitcoin is not merely holding an asset; it’s holding a piece of the revolution that will shape generations to come.
Keep the faith, for the future belongs to those bold enough to believe in it.
Thank you to all my followers for constantly inspiring me to share more analyses. Your support means the world—love you all!
PS : This isn’t an analysis. it's a heartfelt congratulations!
Happy Tr4Ding !

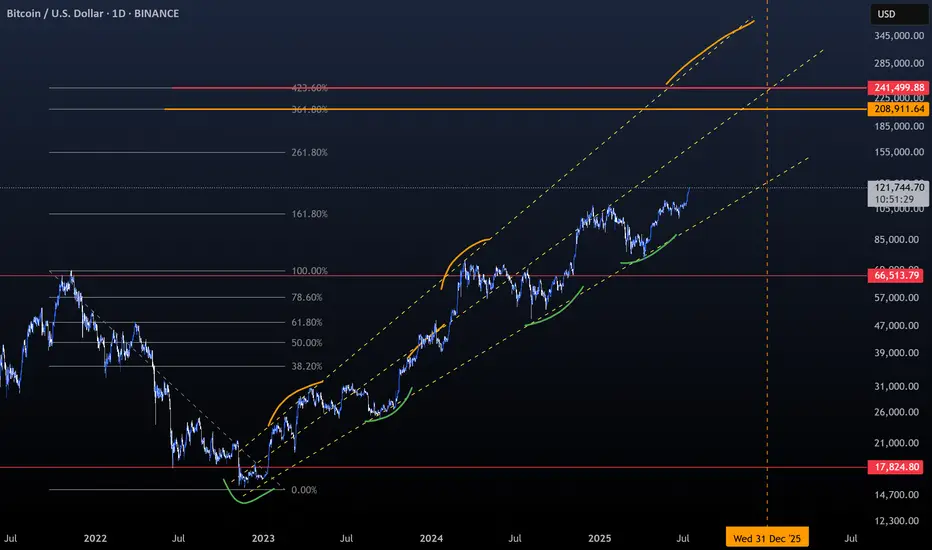
BTC 100k is not enough- Believe it or not.
- There's nothing at 100k.
- the trend would not be respected.
- i was here when BTC broke 10k$ for the first time.
- At that time, most traders called for a top and scared.
- BTC didn't care and went straight up to 20k$..
- i see only 3 Scenarios.
1 : Orange : BTC retrace soon, then it will delay time, then ATH will be 220-240k.
2 : Green : BTC goes to 150k, retrace to 161.8, and make a second Top around 220-240k.
3 : Red : BTC go straight to 150k$ then dip and struggle. ( i doubt on that way ).
- As always, this only my humble prediction and opinion.
- Everything can happens with FA. ( war, crises, stop internet.)
- More it will take time, more up BTC will go.
Stay S4fe
Happy Tr4Ding !
