Short Crude Oil for The LeapRisk free trade for $100 on MCL
Scaling out of the trade from 4 hour supply to 4 hour demand.
Using the TrendCloud Trading System and it's working great.
So far I'm in the top 7% for this competition.
Focusing on managing this crude oil trade and also the opening range on the MNQ and NQ
Huge win on day 1 for $4000 on NQ opening range using the TrendCloud Trading Strategy.
Backtesting data shows great results. Super proud of this. It took me a month to program everything properly and optimize specifically for the NQ.
Theleap

Kurzer Recap der Tradeidee vom letzten THE LEAPTrade setzte auf eine Trendwende nach dem Abwärtstrend – klassisches Trendbruch-Szenario.
The Leap - June 2025 (Pre-Month Analysis)This is my analysis for the upcoming TradingView competition pairs for the month of June. I'll do a weekly analysis each week, starting at the beginning of the month and after each week.
Good luck to all who are joining!
- R2F Trading

89542.51 or higher, the key is whether the price can be maintain
Hello, traders.
If you "Follow", you can always get new information quickly.
Please also click "Boost".
Have a good day today.
-------------------------------------
The April TradingView competition is sponsored by PEPPERSTONE.
Accordingly, we will look at the coins (tokens) and items that can be traded in the competition.
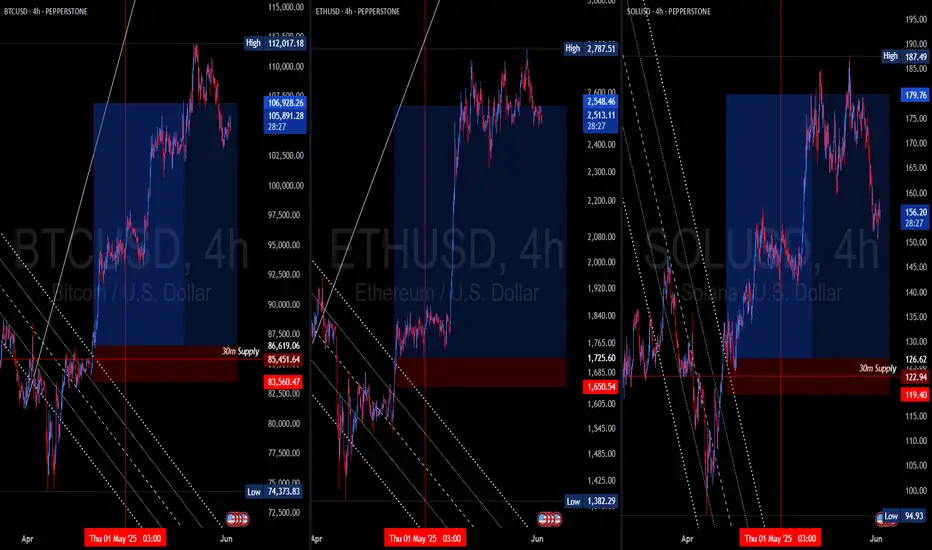
Today, we will talk about the BTCUSD chart for the first time.
-
(BTCUSD 1D chart)
If the price is maintained above the M-Signal indicator on the 1M chart, it can be interpreted that it is in an upward trend in the medium to long term.
Currently, it is showing a short-term uptrend as it rises above the M-Signal indicator on the 1D chart, but it is highly likely that it will continue to rise only if it rises above the M-Signal indicator on the 1W chart.
Therefore, the key is whether it can maintain the price by rising to around 89542.51.
-
We need to see if the OBV is maintained above the middle line and can break through the upper line.
Since the StochRSI indicator is currently in the overbought zone, if there is no increase in trading volume, it is likely to eventually show a downtrend.
If it shows a downtrend, it is expected that it will eventually meet the M-Signal indicator on the 1M chart and determine the trend again.
At this time, we need to check whether there is support near 73589.43.
-
The competition starts on April 1.
As I mentioned in the Binance BTCUSDT chart description, the next volatility period is expected to be around April 5 (April 4-6).
Therefore, we need to check whether the price is maintained above the M-Signal indicator on the 1D chart or above the M-Signal indicator on the 1W chart and decide the position.
In other words, I think it is good to decide the position depending on whether there is support near the original section marked on the 30m chart.
-
It is expected that the key point of this competition will be whether the trading volume can increase and whether the price can be maintained by rising above 89542.51.
-
Thank you for reading to the end.
I hope you have a successful trade.
--------------------------------------------------
- This is an explanation of the big picture.
I used TradingView's INDEX chart to check the entire section of BTC.
I rewrote the previous chart to update it by touching the Fibonacci ratio range of 1.902 (101875.70) ~ 2 (106275.10).
(Previous BTCUSD 12M chart)
Looking at the big picture, it seems to have been maintaining an upward trend following a pattern since 2015.
In other words, it is a pattern that maintains a 3-year upward trend and faces a 1-year downward trend.
Accordingly, the upward trend is expected to continue until 2025.
-
(Current BTCUSD 12M chart)
Based on the currently written Fibonacci ratio, it is displayed up to 3.618 (178910.15).
Fibonacci ratio 0.618 (44234.54) is not expected to fall again.
(BTCUSDT 12M chart)
Looking at the BTCUSDT chart, I think it is around 42283.58.
-
I will explain it again with the BTCUSD chart.
The Fibonacci ratio ranges marked in the light green boxes, 1.902 (101875.70) ~ 2 (106275.10) and 3 (151166.97) ~ 3.14 (157451.83), are expected to be important support and resistance ranges.
In other words, it seems likely to act as a volume profile range.
Therefore, in order to break through this section upward, I think the point to watch is whether it can rise with support near the Fibonacci ratios of 1.618 (89126.41) and 2.618 (134018.28).
Therefore, the maximum rising section in 2025 is expected to be the 3 (151166.97) ~ 3.14 (157451.83) section.
To do that, we need to look at whether it can rise with support near 2.618 (134018.28).
If it falls after the bull market in 2025, we don't know how far it will fall, but considering the previous decline, we expect it to fall by about -60% to -70%.
So, if the decline starts near the Fibonacci ratio 3.14 (157451.83), it seems likely that it will fall to around Fibonacci 0.618 (44234.54).
I will explain more details when the downtrend starts.
------------------------------------------------------

Nasdaq NQ Update . High probability Long Setup In this video I look at the NQ on the daily and pinpoint whats possibly next for longs and shorts . I highlight a key zone to look for Longs that you need to mark on your chart .

NQ Futures My Next Level too Long NQ in The Leap competition Some analysis on the NQ with a focus on Price action being up at all time highs. In the video I highlight the importance of having patience and taking the best high probability trades . FOMO in at the top is suicide and so is shorting blind . I provide a potential level with several confluences and a potential new ATH target .
IF you read this far then Please Boost my chart for more setups Ty

MBT1 BULISH (THE LEAP BITCOIN)MBT1, the Bitcoin leaps asset, is showing a slight bullish movement. The targets, danger zone, and stop loss levels are marked on the chart. The zigzag movement indicates that if MBT1 breaks through this area, it could reach upper targets up to 100K.
Please pay close attention to the danger zone and stop loss.
Note: My ideas are not intended for any type of scalping or scalpers!
You can find the full list of my ideas here: www.tradingview.com
Here are some of my ideas:

MES1 THE LEAP BULISHMES1 is another asset representing the S&P 500 during the current leap. It is currently showing a bullish movement. The targets, danger zone, and stop loss levels are marked on the chart.
Please pay close attention to the danger zone and stop loss.
Note: My ideas are not intended for any type of scalping or scalpers!
You can find the full list of my ideas here: www.tradingview.com
Here are some of my ideas:

NQ1 BULISHNQ1 is one of the assets used for the current leap, representing the NASDAQ 100. Here is a brief analysis of it. The targets, danger zone, and stop loss levels are marked on the chart. Please pay close attention to all of them.
Note: My ideas are not intended for any type of scalping or scalpers!
You can find the full list of my ideas here: www.tradingview.com
Here are some of my ideas:

The TradingView Show: Futures Trading and Risk ManagementJoin us for an insightful live session with Bob Iaccino, an experienced trader and market strategist working with Plus500, an integrated broker on TradingView.
In this session, we'll explore key trading products, market insights, and strategies to navigate today’s volatile markets. Whether you're just starting out in futures trading or you're a seasoned pro, this session will offer valuable insights on trading E-mini and Micro E-mini equity futures, Micro Gold, Crude Oil Futures, Micro Bitcoin, and Micro Euro FX.
Don’t miss out on the Leap Paper Trading Competition, hosted by CME Group on TradingView! This 1-month contest brings traders from across the globe together — and it's happening now. Sign up before registration closes! The competition is heating up, but who will claim their share of the impressive prize pool?
Here’s what's up for grabs:
1st place — $3,000
2nd place — $1,500
3rd place — $1,200
4th place — $1,000
5th place — $800
6th to 25th place — $500
26th to 50th place — $300
51st to 250th place — 6 more months of your current plan

Gold Options Activity Point to Continuing RallyNot a single macro portfolio manager was fired for adding gold to their portfolio over the last two years. Such has been gold’s stunning performance. Will Gold’s ascent continue?
Narratives and numbers signal unstoppable and solid bull run in gold for now.
BULL CASE REMAINS INTACT AND IS INTENFISYING
This paper will not delve much into fundamentals. We have covered it previously in Gold to Shine Bright on Fundamentals, Seasonality & Sentiments . In that we highlighted the three main forces at play: (a) Continued central bank purchases, (b) Rising consumer demand in China & India, and (c) Trump administration’s fiscal policies favouring gold.
In addition to the above, US Dollar weaponization, De-dollarisation fears, and Tariff tensions, serve as additional tailwinds. TradingView Wizard, Konhow , has comprehensively covered the historical impact of tariffs on Gold in his recent paper and video .
SENTIMENTS HAVE SURRENDERED IN FAVOR OF RISING GOLD
This research note will not dive into the weeds of technical analysis either. TradingView’s Technical Analysis dashboard summarises it all elegantly.
TradingView
Momentum is in favour. Oscillators are neutral indicating little risk of price reversal. Overall, sentiment remains bullish gold.
Gold prices as represented by CME Micro Gold Futures front month contract formed a golden cross on 10th January 2025. Since then, prices are up 8.5% as of 13th February 2025. Current prices are well above its 50-day, 100-day, and 200-day DMAs.
RSI is in overbought zone. Expect some pull back in gold prices from time to time on profit taking. But the upward trend is undeniable. The MACD shows that Gold momentum continues to be on the rise but with waning bullishness.
Readers can access the entire library of technical ideas focussing on Gold on TradingView’s Gold Ideas Page ideas page .
OPTIONS MARKETS ARE SIGNALLING A SOLID BULL RUN AHEAD
This paper aims to unpack recent activity in CME gold options market and its impact on prices. No contrary signals there either. Options market also signal bullish gold.
QuikStrike is a free-to-use tool for registered participants on the CME Group website. The tool provides a vast range of analytics to guide portfolio managers & traders to better comprehend the underlying market. Each report comes with a helpful user-guide to describe the data covered within the report.
Some key takeaways below:
Open Interest Profile page shows that as of close of markets on 11th February 2025, total call open interest (“OI” for short) stood at 634,815 lots across all expiries and strikes. Aggregate put IO totalled up to 357,305 lots resulting in a put-call ratio (p/c ratio) of 0.56.
Calls are options contract that represent a bullish view. While puts are contracts representing bearish outlook. At 0.56 p/c ratio, there are twice as many bullish positions for each bearish one.
Source: CME QuikStrike
Most Active Strikes allow portfolio managers and traders to analyse top strikes with shifts in open interest. Table below shows top 10 strikes registering the largest change in open interest between 4th February and 11th February.
Starting first with the Calls (left section of the table below), participants have been building up open interest in strikes 4000, 3200, 3250, 4500, 4032, and 3,975.
Call options have also booked reduction in open interest at strikes 3000, 3075, 3100 and 3025. On a net-basis, open interest is up 10,312 lots across these top ten strikes over various expiries this year.
Source: CME QuikStrike
Puts (right section of the table above) shows rising build up in open interest for strikes ranging from 2740 to 2880.
Collectively, this indicates that market participants are rooting for gold prices to rise through USD 3,000/oz and to even rally past USD 4,500/oz. Will that happen? Only time will tell.
Given that risk managers are establishing puts at such high levels point to strong support for gold prices at current levels.
In a nutshell, current prices are not only formidably comfortable but the potential to rise is also highly probable.
Shifting the attention to volatility, the CME Group also offers CVol which is another free-to-use tool. Portfolio managers and traders can visualise implied volatility behaviour on this tool.
Source: CME CVol
The GCVL which is the Gold CVol index shows implied volatility at 17.65 and with a positive skew of 1.08. Implied volatility easing even at an elevated prices indicates that market participants are comfortable at current price levels and do not foresee immediate large price moves.
Skew on the CVol tool is defined as Up Var minus Down Var. Up Var is the likelihood of the price rising while Down Var measures the likelihood of prices falling. A positive skew shows that the market is pricing a higher likelihood of rising prices relative to a down move.
FUND FLOWS INTO GOLD ETF IS UP 47% YOY
Among its rich set of features, TradingView also shows daily ETF fund flows . GLD is the prominent ETF commanding assets under management (AUM) of USD 80.65 billion.
This time last year, GLD ETF showed AUM of USD 54.77 billion. Fund inflows have spiked 47.25% over the past 12 months.
HYPOTHETICAL TRADE SETUP
With fundamentals, sentiment, options market, and fund flows all pointing to a price that is set to rise, this paper posits a long position using CME Micro Gold Futures expiring on 28th April 2025 (MGCJ2025) based on the following entry, exit levels and the reward-to-risk ratio:
• Entry: USD 2,900/oz
• Target: USD 3,100/oz
• Stop: USD 2,800/oz
• P&L at Target (USD per lot): +2,000 ((3,100 – 2,900) x 10)
• P&L at Stop (USD per lot): -1,000 ((2,800 – 2,900) x 10)
• Reward-to-Risk Ratio: 2x
Please note that Each Micro Gold Futures contract provides an exposure to 10 troy ounces.
Both standard-sized gold futures (GC) and the newly launched 1-ounce gold futures offer avenues to express bullish sentiment on the yellow metal. This comprehensive suite of gold futures is tailored to enhance flexibility and precision, empowering investors to capitalize on market opportunities effectively.
CME Group lists a raft of products covering a range of asset classes more accessible while also enabling granular hedging for portfolio managers.
Portfolio managers can learn more on how to access these micro products by visiting CME Micro Products page on CME portal to discover micro-sized contracts to gain macro exposures.
In collaboration with the CME Group, TradingView has launched The Leap trading competition. New and upcoming traders can hone and refine their trading skills, test their trading strategies, and feel the thrill of futures trading with a vibrant global community through this paper trading competition sponsored by CME Group using virtual money and real time prices.
The competition lasts another 15-days. Please join the 48,000+ others who are actively honing their trading skills using virtual money. Click here to learn more.
MARKET DATA
CME Real-time Market Data helps identify trading set-ups and express market views better. If you have futures in your trading portfolio, you can check out on CME Group data plans available that suit your trading needs tradingview.com/cme .
DISCLAIMER
This case study is for educational purposes only and does not constitute investment recommendations or advice. Nor are they used to promote any specific products, or services.
Trading or investment ideas cited here are for illustration only, as an integral part of a case study to demonstrate the fundamental concepts in risk management or trading under the market scenarios being discussed. Please read the FULL DISCLAIMER the link to which is provided in our profile description.

NQ! Buy Idea on LEAP CHALLEGE accountNot trading my prop account due to FOMC, this video will show you why haha, as I was about to shift my SL it rammed it. Extremely sudden and unexpected.
Content that we took a partial at the highs (which btw the market was failing to execute) i had to click the button several times for it to fill my order.
over $1,000+ made on this trade.
Give me a like and a follow if you enjoy this content!
Forex, Crypto and Futures Trading Risk Disclosure:
The National Futures Association (NFA) and Commodity Futures Trading Commission (CFTC), the regulatory agencies for the forex and futures markets in the United States, require that customers be informed about potential risks in trading these markets. If you do not fully understand the risks, please seek advice from an independent financial advisor before engaging in trading.
Trading forex and futures on margin carries a high level of risk and may not be suitable for all investors. The high degree of leverage can work against you as well as for you. Before deciding to trade, you should carefully consider your investment objectives, level of experience, and risk appetite.
There is a possibility of losing some or all of your initial investment, and therefore, you should not invest money that you cannot afford to lose. Be aware of the risks associated with leveraged trading and seek professional advice if necessary.
BDRipTrades Market Opinions (also applies to BDelCiel and Aligned & Wealthy LLC):
Any opinions, news, research, analysis, prices, or other information contained in my content (including live streams, videos, and posts) are provided as general market commentary only and do not constitute investment advice. BDRipTrades, BDelCiel, and Aligned & Wealthy LLC will not accept liability for any loss or damage, including but not limited to, any loss of profit, which may arise directly or indirectly from the use of or reliance on such information.
Accuracy of Information: The content I provide is subject to change at any time without notice and is intended solely for educational and informational purposes. While I strive for accuracy, I do not guarantee the completeness or reliability of any information. I am not responsible for any losses incurred due to reliance on any information shared through my platforms.
Government-Required Risk Disclaimer and Disclosure Statement:
CFTC RULE 4.41 - HYPOTHETICAL OR SIMULATED PERFORMANCE RESULTS HAVE CERTAIN LIMITATIONS. UNLIKE AN ACTUAL PERFORMANCE RECORD, SIMULATED RESULTS DO NOT REPRESENT ACTUAL TRADING. ALSO, SINCE THE TRADES HAVE NOT BEEN EXECUTED, THE RESULTS MAY HAVE UNDER-OR-OVER COMPENSATED FOR THE IMPACT, IF ANY, OF CERTAIN MARKET FACTORS, SUCH AS LACK OF LIQUIDITY. SIMULATED TRADING PROGRAMS IN GENERAL ARE ALSO SUBJECT TO THE FACT THAT THEY ARE DESIGNED WITH THE BENEFIT OF HINDSIGHT. NO REPRESENTATION IS BEING MADE THAT ANY ACCOUNT WILL OR IS LIKELY TO ACHIEVE PROFIT OR LOSSES SIMILAR TO THOSE SHOWN.
Performance results discussed in my content are hypothetical and subject to limitations. There are frequently sharp differences between hypothetical performance results and the actual results subsequently achieved by any particular trading strategy. One of the limitations of hypothetical trading results is that they do not account for real-world financial risk.
Furthermore, past performance of any trading system or strategy does not guarantee future results.
General Trading Disclaimer:
Trading in futures, forex, and other leveraged products involves substantial risk and is not appropriate for all investors.
Do not trade with money you cannot afford to lose.
I do not provide buy/sell signals, financial advice, or investment recommendations.
Any decisions you make based on my content are solely your responsibility.
By engaging with my content, including live streams, videos, educational materials, and any communication through my platforms, you acknowledge and accept that all trading decisions you make are at your own risk. BDRipTrades, BDelCiel, and Aligned & Wealthy LLC cannot and will not be held responsible for any trading losses you may incur.

ES Trade Idea: Key Levels and Strategies Amid Macro UncertaintyCME_MINI:ES1!
ES futures opened with a gap down on Sunday.
With numerous macro headlines, President Donald Trump’s comments on the Fed’s decision last week, and ongoing trade war tariffs, traders may struggle to distinguish what truly matters for the markets from the noise.
In our opinion, do not let macro headlines cloud your judgement. Have a trade plan and be ready to adjust with market conditions and volatility. One way to mitigate risk is by utilizing micro CME contracts , allowing for more precise risk management during volatile market conditions. Additionally, you can participate in the CME and TradingView paper trading competition, giving you the opportunity to test your skills in The Leap without risking real money.
Remember, it's NFP week, and several other key economic data releases are also on the calendar.
In our view, it is important to zoom out and reduce key levels on your charts to ones that are significant.
Key Levels:
Key levels represent areas of interest and zones of active market participation. The more significant a key level, the closer we monitor it for potential reactions and trade setups in alignment with our trading plan.
(mcVAH) micro composite value area high: 6,134.25
Key LIS/Yearly Open: 5,949.25
(mcVAL) micro composite value area low: 5,914.25
(CVAH) Composite Value Area High: 5,924
Scenario 1: Long above Key LIS
Our key LIS is still Yearly open as it was discussed in last week’s idea. We are looking for long trade setups at this level.
Scenario 2: Short below Key LIS
If the price moves lower and holds below a key level, we will look for short trade setups targeting our green support zones on the chart from mcVAL and CVAH confluence.

CL Trade Idea: Key Levels & Strategies Amid VolatilityNYMEX:CL1!
With Trade War 2.0 unfolding, managing risk in futures trading is more crucial than ever. One way to mitigate risk is by utilizing micro CME contracts , allowing for more precise risk management during volatile market conditions. Additionally, you can participate in the CME and TradingView paper trading competition, giving you the opportunity to test your skills in The Leap without risking real money.
Crude Oil Futures:
It’s the start of a new month. We saw our last week’s idea “scenario 1” partially play out before prices pulled back higher towards our neutral LIS.
As mentioned above, it is our opinion that current situations and macro news may result in heightened volatility, so it is important to trade what you see and not what you think.
Do not get fixated on your view on the market. Be ready to shift and adapt as the markets evolve on the hard right edge.
Instead of recapping and presenting a macro update today, we will shift our focus on the charts. Looking purely at price, time, volume, and key levels to create a plan for the week.
Key Levels to Watch
Key levels represent areas of interest and zones of active market participation. The more significant a key level, the closer we monitor it for potential reactions and trade setups in alignment with our trading plan.
Micro Composite Value Area High (mCVAH) January 2025 : 76.00
January 2025 mid- range: 74.96
February Monthly Open: 74.14
Micro Composite Value Area Low (mCVAL) January 2025 : 71.82
Yearly Open: 70.52
2024 Mid- Range: 70.40
Scenario 1: Rejection confirmation at January 2025 Mid
Price has attempted to push above January 2025 mid and was rejected. This was a key level of interest to validate longs in our last week’s trade plan. Rejection of this level and price now below monthly open. There is room for prices to shift lower towards mcVAL Jan 2025 and test of key bull support at yearly open and 2024 mid range.
Scenario 2: mcVAL 2025 to act as intermediate support
If we see this level hold, in our opinion, Crude oil may be establishing a new range capped within mcVAH and mcVAL Jan 2025 until we see a break of either side. That said, intra day volatility may increase with headline news impacting prices.
As always it is paramount to manage your risk as losses are an inherent part of trading.
What are you focusing on amid all the headline news? We'd love to hear your thoughts!

Leap Ahead with a Regression Breakout on Crude OilThe Leap Trading Competition: Your Chance to Shine
TradingView’s “The Leap” Trading Competition presents a unique opportunity for traders to put their futures trading skills to the test. This competition allows participants to trade select CME Group futures contracts, including Crude Oil (CL) and Micro Crude Oil (MCL), giving traders access to one of the most actively traded commodities in the world.
Register and compete in "The Leap" here: TradingView Competition Registration .
This article breaks down a structured trade idea using linear regression breakouts, Fibonacci retracements, and UnFilled Orders (UFOs) to identify a long setup in Crude Oil Futures. Hopefully, this structured approach aligns with the competition’s requirements and gives traders a strong trade plan to consider. Best of luck to all participants.
Spotting the Opportunity: A Regression Breakout in CL Futures
Trend reversals often present strong trading opportunities. One way to detect these shifts is by analyzing linear regression channels—a statistical tool that identifies the general price trend over a set period.
In this case, a 4-hour CL chart shows that price has violated the upper boundary of a downward-sloping regression channel, suggesting the potential start of an uptrend. When such a breakout aligns with key Fibonacci retracement levels and existing UnFilled Orders (UFOs), traders may gain a potential extra edge in executing a structured trade plan.
The Trade Setup: Combining Fibonacci and a Regression Channel
This trade plan incorporates multiple factors to define an entry, stop loss, and target:
o Entry Zone:
An entry or pullback to the 50%-61.8% Fibonacci retracement area, between 74.60 and 73.14, provides a reasonable long entry.
o Stop Loss:
Placed below 73.14 to ensure a minimum 3:1 reward-to-risk ratio.
o Profit-Taking Strategy:
First target at 76.05 (38.2% Fibonacci level)
Second target at 77.86 (23.6% Fibonacci level)
Final target at 78.71, aligning with a key UFO resistance level
This approach locks in profits along the way while allowing traders to capitalize on an extended move toward the final resistance zone.
Contract Specifications and Margin Considerations
Understanding contract specifications and margin requirements is essential when trading futures. Below are the key details for CL and MCL:
o Crude Oil Futures (CL) Contract Details
Full contract specs: CL Contract Specifications – CME Group
Tick size: 0.01 per barrel ($10 per tick)
Margin requirements vary based on market conditions and broker requirements. Currently set around $5,800.
o Micro WTI Crude Oil Futures (MCL) Contract Details
Full contract specs: MCL Contract Specifications – CME Group
Tick size: 0.01 per barrel ($1 per tick)
Lower margin requirements for more flexible risk control. Currently set around $580.
Choosing between CL and MCL depends on risk tolerance and account size. MCL provides more flexibility for smaller accounts, while CL offers higher liquidity and contract value.
Execution and Market Conditions
To maximize trade efficiency, conservative traders could wait for a proper price action into the entry zone and confirm the setup using momentum indicators and/or volume trends.
Key Considerations Before Entering
Ensure price reaches the 50%-61.8% Fibonacci retracement zone before executing the trade
Look for confirmation signals such as increased volume, candlestick formations, or additional support zones
Be patient—forcing a trade without confirmation increases risk exposure
Final Thoughts
This Crude Oil Futures trade setup integrates multiple confluences—a regression breakout, Fibonacci retracements, and UFO resistance—to create a structured trade plan with defined risk management.
For traders participating in The Leap Trading Competition, this approach emphasizes disciplined execution, dynamic risk management, and a structured scaling-out strategy, all essential components for long-term success.
When charting futures, the data provided could be delayed. Traders working with the ticker symbols discussed in this idea may prefer to use CME Group real-time data plan on TradingView: www.tradingview.com - This consideration is particularly important for shorter-term traders, whereas it may be less critical for those focused on longer-term trading strategies.
General Disclaimer:
The trade ideas presented herein are solely for illustrative purposes forming a part of a case study intended to demonstrate key principles in risk management within the context of the specific market scenarios discussed. These ideas are not to be interpreted as investment recommendations or financial advice. They do not endorse or promote any specific trading strategies, financial products, or services. The information provided is based on data believed to be reliable; however, its accuracy or completeness cannot be guaranteed. Trading in financial markets involves risks, including the potential loss of principal. Each individual should conduct their own research and consult with professional financial advisors before making any investment decisions. The author or publisher of this content bears no responsibility for any actions taken based on the information provided or for any resultant financial or other losses.

BTCUSDOne of my sell positions for BTCUSD during the tradingview competition (up $8,200). Sell on the theory markets range 70% of the time. LTF breakdown suggest HTF continuation.

The Golden Leap! Have you caught a bid already!? The Leap has started! Yeah!
We have got 30 days to win $10 000, risk free.
This is a special paper trading competition and the top 5 people with the highest profits after a month will win cash prizes of $10,000, $5,000, $3,000, $2,000 and $1,000.
Plus, anyone with their account in profit gets a month of TradingView. Epic.
61 858 Traders are registered for this competition!
Well.. sounds good, and yes, I have started already! Well done!
This is my 1st The Leap entry, The Epic 30 oz. Bullish Call on Gold OANDA:XAUUSD .
Why isn't? 😄
Gold is on its positive path, since October 2023, firmly above its 26- and 52-weeks SMA.
Technical graph indicates robust wedge' breakthrough is right there!
Happy trading to everyone! See y'all a few days later!
Full T&C can be found here .
