💡Don't miss the great buy opportunity in THETAUSDTrading suggestion:
". There is a possibility of temporary retracement to the suggested support line (6.425).
. if so, traders can set orders based on Price Action and expect to reach short-term targets."
Technical analysis:
. THETAUSD is in an uptrend, and the continuation of the uptrend is expected.
. The price is above the 21-Day WEMA, which acts as a dynamic support.
. The RSI is at 51.
Take Profits:
TP1= @ 7.528
TP2= @ 8.538
TP3= @ 10.099
TP4= @ 11.338
TP5= @ 13.195
SL= Break below S2
❤️ If you find this helpful and want more FREE forecasts in TradingView
. . . . . Please show your support back,
. . . . . . . . Hit the 👍 LIKE button,
. . . . . . . . . . Drop some feedback below in the comment!
❤️ Your support is very much 🙏 appreciated!❤️
💎 Want us to help you become a better Forex / Crypto trader?
Now, It's your turn!
Be sure to leave a comment; let us know how you see this opportunity and forecast.
Trade well, ❤️
ForecastCity English Support Team ❤️
THETAUSD

💡Don't miss the great buy opportunity in THETAUSDTrading suggestion:
". There is a possibility of temporary retracement to the suggested support line (6.425).
. if so, traders can set orders based on Price Action and expect to reach short-term targets."
Technical analysis:
. THETAUSD is in an uptrend, and the continuation of the uptrend is expected.
. The price is above the 21-Day WEMA, which acts as a dynamic support.
. The RSI is at 51.
Take Profits:
TP1= @ 7.528
TP2= @ 8.538
TP3= @ 10.099
TP4= @ 11.338
TP5= @ 13.195
SL= Break below S2
❤️ If you find this helpful and want more FREE forecasts in TradingView
. . . . . Please show your support back,
. . . . . . . . Hit the 👍 LIKE button,
. . . . . . . . . . Drop some feedback below in the comment!
❤️ Your support is very much 🙏 appreciated! ❤️
💎 Want us to help you become a better Forex / Crypto trader ?
Now, It's your turn !
Be sure to leave a comment; let us know how you see this opportunity and forecast.
Trade well, ❤️
ForecastCity English Support Team ❤️

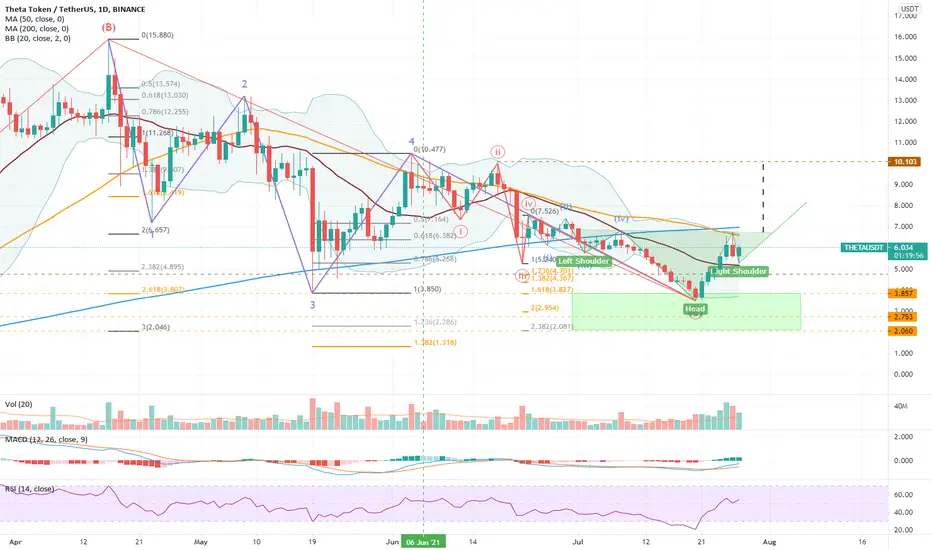
THETA - Leading the recovery?I've mentioned elsewhere the prospects for Theta and how it seems to be leading the recovery in the major alts, at least the ones I'm watching, so I thought I should share here.
As seen in the daily chart above, Theta has formed a very nice right shoulder to a potential Inverse Head & Shoulders pattern. The neckline is at $6.75, which is within spitting distance from here, and a break to the upside of this line of resistance projects a rally to $10, back into the double digit valuation.
The corrective structure can be seen to be completed in Wave Counts, and there is a nice bullish engulfing bar at the bottom signaling a trend reversal.
With head height in the RSI and lots of space for the MACD to extend, things are looking decidedly bullish for THETA.
Will we see $10 and higher soon?
$THETA - Long idea (Bullish Pennant)$THETA looking for higher targets in the coming days following an accurate bullish pennant pattern.
Not financial advice!

THETA/USDT BUY SIGNALA short term buying opportunity for the Theta Token, looking for around 6% growth during the next 48h or less.

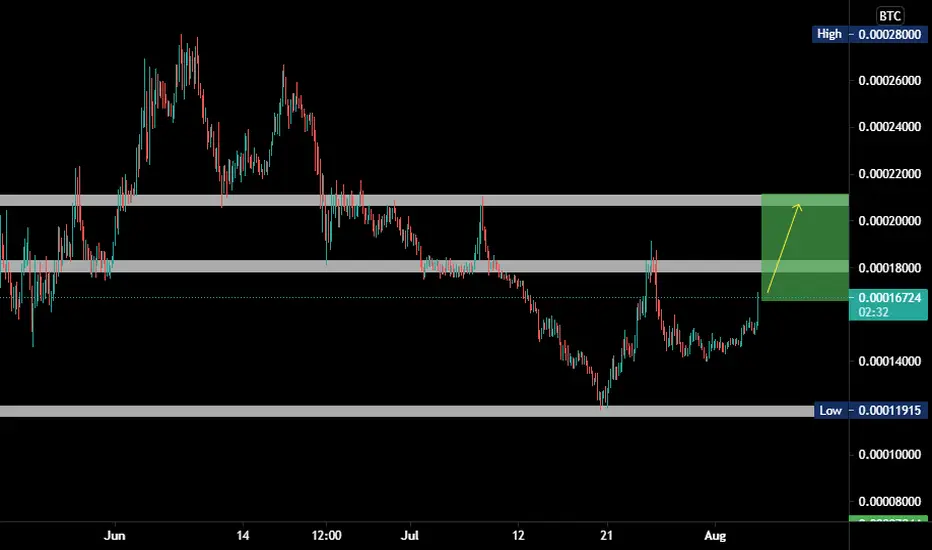
THETA/USDT BULLISH MOVE UPWARDS EXPECTEDTHETA is currently in my trigger zone here, A retest is still pending. If we see a daily close above my trigger zone that will add more confluence to the whole setup here. It would be best to buy at retest the next day if that happens. Whenever I mention a trigger, it means that a momentum candle (no wick) close above it (gray area) and then a retest and we're off towards our targets.
Enjoy the trade. Cheers!
-Mr. Khan

MUST BREAK LEVEL FOR THETA!!Theta has been stuck inside a downtrend channel since around the end of march and has been unable to fully breakthrough out of this channel, the most we have seen is a few wicks above the channel, if we want to see theta go on a big run here we will need to see a break of a few key levels, first the top of the descending channel, the 0.2 FIB level which is lying directly above the top of our channel and then finally the first point of resistance coming from the pivot points. we have actually crossed the bullish pivot point but not by too much, our candles recently have been sitting almost right on this point and i feel we gotta make a move upwards soon before we risk falling back below this level. Looking at the bollinger bands a very key thing that could happen would be price action grabbing onto that top band and going for a rollercoaster ride upwards, which i think would completely blow us right through these few key points i was talking about, in order for that to happen though we need to atleast breakthrough the top of the descending channel, once that is done the top bollinger band will be right in our reach! Looking at the MACD we are seeing good separation within the MA's but i notice the blue ma is starting to come down a bit towards the orange, now this is very important because if we don't see a bounce on the MACD due to a runnup in price we are playing with a possible bearish cross which could definitely set us back even more, we could start to see a little bear cycle on the MACD if our histogram continues to shrink the bars its printing! Not financial advice just my opinion!

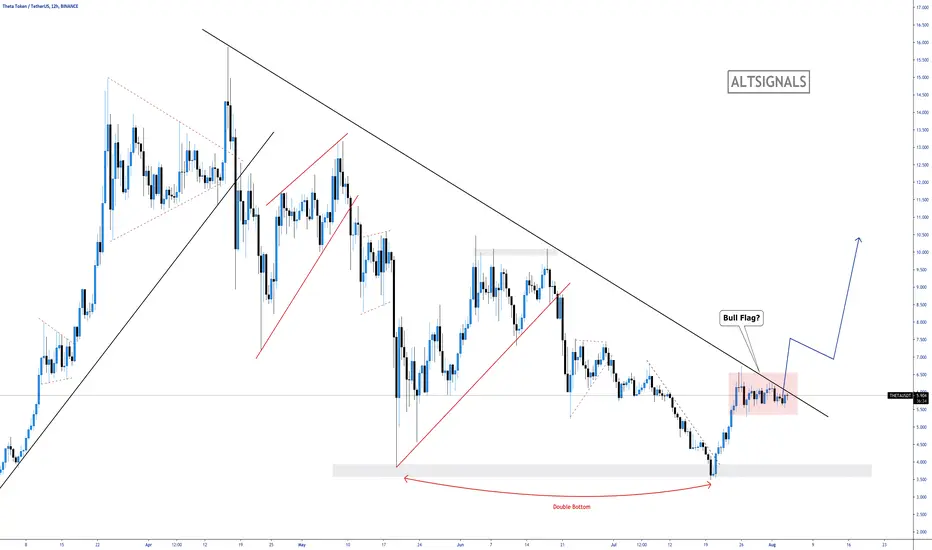
THETA - Breakout Pending...As with most other cryptocurrencies, we saw a double bottom reversal chart pattern indicating that we are at the end of the bear trend. We are now hovering just below the trendline that will determine whether or not we are in for a bullsih reversal.
We can see that price made a move up and now hovering - basically a bull flag. For confirmation, it would be wise to wait for a bullish candles breaking both the consolidation period we're in and the descending trendline.
We could be at the start of the next big break!
Theta Network (THETA) - August 2Hello?
Welcome, traders.
By "following", you can always get new information quickly.
Please also click "Like".
Have a nice day.
-------------------------------------
(THETAUSD 1W Chart)
If the price holds above the 2.94376146 point, it is expected that the uptrend will continue.
In particular, if the price is maintained above the 7.16779511 point, it is expected to create a new wave.
(1D chart)
If the price is maintained in the 4.32667899-6.46370407 range, it is expected to turn into an uptrend.
In particular, it remains to be seen if the 6.46370407 point is above the point and can make a move to break through the 8.60072915-9.66924163 section upwards.
If it goes down, you should check to see if it finds support at the 3.25816651-4.32667899 zone.
-------------------------------------
(THETABTC 1W chart)
If the price holds above the 7534 Satoshi point, it is expected that the uptrend will continue.
In particular, if the price is maintained above the 12434 Satoshi point, it is expected to create a new wave.
(1D chart)
If the price is maintained in the 12371 Satoshi-16144 Satoshi section, it is expected to turn into an uptrend.
In order to continue the uptrend, it must rise above the 18031 Satoshi point.
If it falls from the 12371 Satoshi point, the support section is weak, so you can touch the 6710 Satoshi-8797 Satoshi section.
Accordingly, careful trading is required.
------------------------------------------
We recommend that you trade with your average unit price.
This is because, if the price is below your average unit price, whether it is in an uptrend or in a downtrend, there is a high possibility that you will not be able to get a big profit due to the psychological burden.
The center of all trading starts with the average unit price at which you start trading.
If you ignore this, you may be trading in the wrong direction.
Therefore, it is important to find a way to lower the average unit price and adjust the proportion of the investment, ultimately allowing the funds corresponding to the profits to regenerate themselves.
------------------------------------------------------------ -----------------------------------------------------
** All indicators are lagging indicators.
Therefore, it is important to be aware that the indicator moves accordingly with the movement of price and volume.
However, for the sake of convenience, we are talking in reverse for the interpretation of the indicator.
** The wRSI_SR indicator is an indicator created by adding settings and options to the existing Stochastic RSI indicator.
Therefore, the interpretation is the same as the traditional Stochastic RSI indicator. (K, D line -> R, S line)
** The OBV indicator was re-created by applying a formula to the DepthHouse Trading indicator, an indicator disclosed by oh92. (Thanks for this.)
** See support, resistance, and abbreviation points.
** Support or resistance is based on the closing price of the 1D chart.
** All descriptions are for reference only and do not guarantee a profit or loss in investment.
Explanation of abbreviations displayed in the chart
R: A point or section of resistance that requires a response to preserve profits.
S-L: Stop Loss point or section
S: A point or section where you can buy to make a profit as a support point or section.
(Short-term Stop Loss can be said to be a point where profit and loss can be preserved or additional entry can be made through split trading. It is a short-term investment perspective.)
GAP refers to the difference in prices that occurred when the stock market, CME, and BAKKT exchanges were closed because they are not traded 24 hours a day.
G1 : Closing price when closed
G2: Opening price
(Example) Gap (G1-G2)

Theta Eyes Breakout Of Multi Month Descending Channel-Theta revived nearly 70% the last week
-Price is getting halted at major trend line resistance
-400MA has held prices down for nearly 80 days
Theta Token experienced a massive bull run over the last year as prices rose 1000s of percent. Despite these gains, Theta fell victim of market movements and fell nearly -80% from its ATH of $15.90. As Bitcoin starts its revival off lows, Theta has been attempting to begin a bull trend for the first time in many months.
While looking at the chart, we can see THETA has attempted two breakouts of its multi month channel resistance (green). Price has been respecting this channel for some time as bulls and bears have equally defended it. Along with this trend line lies a major resistance zone from $6.47-$6.85. If bulls succeed in breaking & holding this zone, Theta will be in position for a strong push to the given targets.
Along with these two resistance marks lies the 400MA. This MA has held prices down for nearly 80 days as it has been a strong mark for bears to defend. Breaking above this & holding it will likely allow the push to targets as mentioned above. If the bulls fail to break this mark, THETA will be in for a short term downtrend. Price will find support at $5.25 & $4.40.
While looking at the relative strength index, we can conclude strength just visited the overbought mark and has since been heading down to bearish territory. RSI must hold above the 50 value to save it from a fall to its next supports. The MACD has been consolidating within bullish territory above the 0 value. This is a good sign that buyers have not yet left the market and as soon as the histogram can tick green, THETA will try another push to its targets.
THETA Intraday Analysis
Spot rate: $5.71
Trend: Bullish
Volatility: Medium
Support: $5.25
Resistance: $5.88

THETAUSD D1: THE BEST Level to BUY/HOLD 500% gains(SL/TP/UPDATE)Why get subbed to me on Tradingview?
-TOP author on TradingView
-2000+ ideas published
-15+ years experience in markets
-Professional chart break downs
-Supply/Demand Zones
-TD9 counts / combo review
-Key S/R levels
-No junk on my charts
-Frequent updates
-Covering FX/crypto/US stocks
-before/after analysis
-24/7 uptime so constant updates
🎁Please hit the like button and
🎁Leave a comment to support our team!
THETAUSD D1: THE BEST Level to BUY/HOLD 500%+ gains(SL/TP)(UPDATE)
IMPORTANT NOTE: speculative setup. do your own
due dill. use STOP LOSS. don't overleverage.
🔸 Summary and potential trade setup
::: THETAUSDT D1 chart review
::: updated/revised outlook
::: final swipe lower possible/likely
::: but then expect MASSIVE GAINS
::: chart looks good /strong
::: still valid today / great setup BULLS
::: BULL FLAG setup with massive upside
::: still expecting pullback off the highs
::: get ready to BUY LOW later
::: accumulation in range previously
::: then we had 150% gains PUMP
::: we had 2 pump already before this
::: 265% pump - pullback
::: then 150% pump and now pullback mode
::: expecting short-term pullback
::: BULLS get ready to BUY after pullback
::: TP bulls is +500% gains later
::: expecting decent gains soon
::: 20-30% pullback short-term
::: recommended strategy: BUY/HOLD after pullback
::: TP BULLS +500% gains
::: SWING TRADE: BUY/HOLD IT
::: bull run not over yet
::: good luck traders!
::: BUY/HOLD and get paid. period.
🔸 Supply/Demand Zones
::: N/A
::: N/A
🔸 Other noteworthy technicals/fundies
::: TD9 /Combo update: N/A
::: Sentiment mid-term: BULLS
::: Sentiment short-term: BEARS/PULLBACK
RISK DISCLAIMER:
Trading Crypto, Futures , Forex, CFDs and Stocks involves a risk of loss.
Please consider carefully if such trading is appropriate for you.
Past performance is not indicative of future results.
Always limit your leverage and use tight stop loss.

be ready 50% down is coming ... lets shortAfter our successful Signal for LTC which hit all targets with about 60% profits 👌 (the original post below this article)
we were waiting for another low risk trade to share freely with you here..
Theta coin is a good based project but for short term I think there will be another last correction which will happen within July n August, and then we may have the chance to complete the bull run again.
s o the bearish signals we can see on the chart for now is the following:-
1- Death cross, EMA 50 has just crossed below EMA 150 which is a bearish divergence.
2- We are making lower highs n higher lows.
3- Downtrend is still continuing had not ended yet.
4- Strong diagonal resistance (the black line) that we failed to break for about 100 days !!
5- We are about to face the EMA 50 which Theta failed to stand above since the hard dump on 17 may.
6- We are about to face the last support that Theta broke while falling down which is expected to be flipped into resistance.
so we r expecting bearish movement..
short:✅ 5.90 - 6.10 ✅
🎯TARGETS:
1- 4.68
2- 3.94
3- 3.50
4- 2.94
💵 Trade Size: 3% -5% of Portfolio
🚫Invalidation(SL): 7.73
Please click LIKE button and Appreciate my hard work.
Must follow me for latest crypto real time updates.
Thank you.

THETAUSD D1: SHORT THE BOUNCE BEARS TP 2.50(SL/TP)(NEW)Why get subbed to me on Tradingview?
-TOP author on TradingView
-2000+ ideas published
-15+ years experience in markets
-Professional chart break downs
-Supply/Demand Zones
-TD9 counts / combo review
-Key S/R levels
-No junk on my charts
-Frequent updates
-Covering FX/crypto/US stocks
-before/after analysis
-24/7 uptime so constant updates
🎁Please hit the like button and
🎁Leave a comment to support our team!
THETAUSD D1: SHORT THE BOUNCE BEARS TP 2.50(SL/TP)(NEW)
IMPORTANT NOTE: speculative setup. do your own
due dill. use STOP LOSS. don't overleverage.
Tagged as SHORT because I expect more short-term
and mid-term losses. SHORT IT!
🔸 Summary and potential trade setup
::: THETAUSD D1/candle chart review/outlook
::: tagged SHORT because it's BEARISH short-term
::: mid-term also BEAR MODE
::: sequence of 5 waves BEAR MODE
::: right now bouncing in wave 4
::: (not an elliott wave setup)
::: spells more trouble mid-term
::: BEARS will target 2.50 USD
::: measured move CORRECTION
::: all BEAR waves = 63%
::: shorting rips / shorting after wave4
::: makes sense right now
::: we are setting up for another correction
::: final TP bears is near 2.50USD
::: recommended strategy: SHORT IT 5-6USD
::: TP BEARS is 40%+ correction
::: SWING trade setup / no fast gains here
::: SHORT/HOLD / do not expect miracle gains
::: SL is 5% max
::: good luck traders!
🔸 Supply/Demand Zones
::: N/A
::: N/A
🔸 Other noteworthy technicals/fundies
::: TD9 /Combo update: N/A
::: Sentiment mid-term: BEARS/CORRECTION
::: Sentiment outlook short-term: RANGE/MIXED
RISK DISCLAIMER:
Trading Futures , Forex, CFDs and Stocks involves a risk of loss.
Please consider carefully if such trading is appropriate for you.
Past performance is not indicative of future results.
Always limit your leverage and use tight stop loss.

THETATHETA, finally showing signs of strength. Great push on the daily so far, we are also in a daily parabola really close to a breakout and currently under SUPPORT Daily Pivot. The first major level I would expect would be 5.845 if we are to breakout
CALL OF CRYPTO

THETAUSDT LONGSalam dustan
THETAUSDT Futures
in tahlil baraye futures hast
thetausdt tuneste bad az kaheshe gheymat yek channel tashkil bede k bad az khoruj az channel yek continuation dar time frame 5m tashkil dade
dar tahlil price action in olgu be samte bala rafte ta high price yani top ghabli
nazare shoma chie???
agar ba man movafeghid LIKE konid
Por sood bashid

THETAUSDT DESCENDING CHANNELTo my surprise, theta has been consolidating in a falling channel for four months without a breakout or breakdown. Definitely, the rise will be as strong as the consolidation was. We can see a double bottom pending at the key support level, you'd take a long position at the pending second bottom's position or wait for breakout and a successful retest. Your likes and comments would be much appreciated, you can follow up for more helpful contents.

Theta - More Downside?Applying fib channel in this daily log chart we notice that the worst may still to come to THETA, lying right now at the support line of this channel that begun in late march.
Breaking this present support we have two others until $1.90.
It's also important to notice that for the first time since late april/20 THETA is below MA 200.
Unless it bounces hard on this level i'm bearish.
Thank you for reading.

Theta Network (THETA) - July 14Hello?
Welcome, traders.
By "following", you can always get new information quickly.
Please also click "Like".
Have a good day.
-------------------------------------
(THETAUSD 1W Chart)
If the price is maintained above the 2.94376146-4.33578821 section, we expect the uptrend to continue.
In particular, it is important to see an uptrend along an uptrend line.
(1D chart)
If the price is maintained in the range of 4.41735896-6.59972404, it is expected to turn into an uptrend.
In particular, we should watch to see if we can move up along the uptrend line.
If it falls in the range of 3.32617649-4.41735896, it is possible to enter the mid- to long-term investment area, so careful trading is required.
I expect the uptrend to be limited before breaking out of the two downtrend lines.
-------------------------------------
(THETABTC 1W chart)
If the price is maintained above the 12434 Satoshi point, it is expected to create a new wave. (Mid to long-term perspective)
(1D chart)
It turned into a downtrend as it fell in the 17437 Satoshi-19486 Satoshi section. (Short-term and medium-term perspectives)
If the price is maintained in the 12434 Satoshi-13341 Satoshi section, it is expected to turn into an uptrend.
In particular, it is important to see an uptrend along an uptrend line.
------------------------------------------
We recommend that you trade with your average unit price.
This is because, if the price is below your average unit price, whether it is in an uptrend or in a downtrend, there is a high possibility that you will not be able to get a big profit due to psychological burden.
The center of all trading starts with the average unit price at which you start trading.
If you ignore this, you may be trading in the wrong direction.
Therefore, it is important to find a way to lower the average unit price and adjust the proportion of the investment, ultimately allowing the funds corresponding to the profits to regenerate themselves.
------------------------------------------------------------ -----------------------------------------------------
** All indicators are lagging indicators.
Therefore, it is important to be aware that the indicator moves accordingly with the movement of price and volume.
However, for the sake of convenience, we are talking in reverse for the interpretation of the indicator.
** The wRSI_SR indicator is an indicator created by adding settings and options to the existing Stochastic RSI indicator.
Therefore, the interpretation is the same as the traditional Stochastic RSI indicator. (K, D line -> R, S line)
** The OBV indicator was re-created by applying a formula to the DepthHouse Trading indicator, an indicator disclosed by oh92. (Thanks for this.)
** See support, resistance, and abbreviation points.
** Support or resistance is based on the closing price of the 1D chart.
** All descriptions are for reference only and do not guarantee a profit or loss in investment.
Explanation of abbreviations displayed in the chart
R: A point or section of resistance that requires a response to preserve profits.
S-L: Stop Loss point or section
S: A point or section where you can buy to make a profit as a support point or section.
(Short-term Stop Loss can be said to be a point where profit and loss can be preserved or additional entry can be made through split trading. It is a short-term investment perspective.)
GAP refers to the difference in prices that occurred when the stock market, CME, and BAKKT exchanges were closed because they are not traded 24 hours a day.
G1 : Closing price when closed
G2: Opening price
(Example) Gap (G1-G2)

THETAUSDT Interday SHORT/ BEARISHTHETAUSDT Interday SHORT/ BEARISH - We failed to break through resistance so I now expect to come down to the next support, I personally entered a short here with the TP at the next support and we'll see what's happened, these are the interday/day trading S/R ( Support & Resistance ) levels

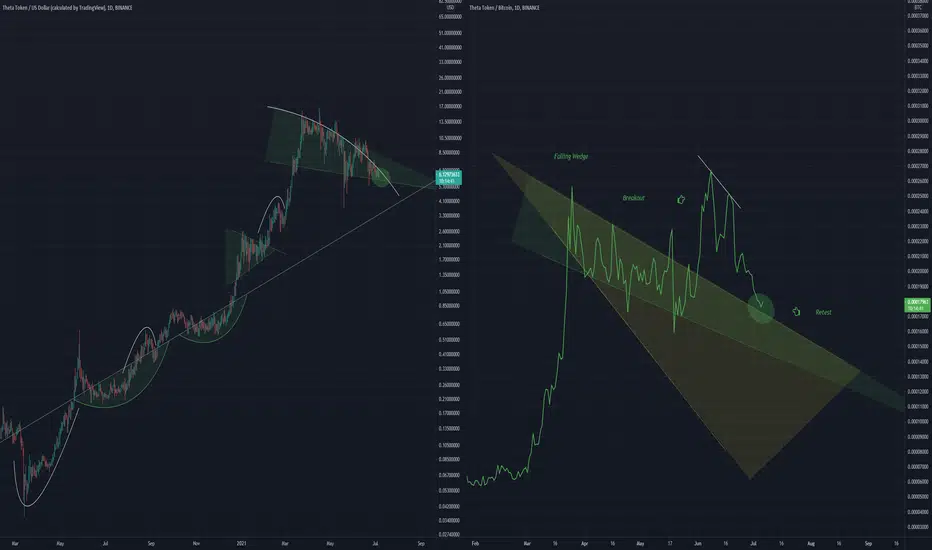
THETA AnalysisTHETAUSD is approaching a crucial point, it will likely break to the upside from this dominant position above the mean trendline of the current run
This breakout theory is exacerbated by the BTC pair which is retesting the top of a falling wedge, which is quite bullish for price and will likely result in a large bounce
I have not looked much into THETA technicals, this is my first analysis of the coin..
THETAUSD aiming at $35THETA has been trading within a Channel Up on the 1D time-frame (logarithimic scale) since the COVID bottom, with distinct Higher Highs and Higher Lows. At the moment it is trading almost on the Higher Lows trend-line and is on critical crossroads as the 1D MA50 (blue trend-line) is about to cross below the 1D MA200 (orange trend-line) and form the technically bearish formation of the Death Cross.
However, last time the 1D Death Cross was formed was back in the first week of April 2020, right after the COVID March Bottom and that turned out to be a strong Buy Signal instead. The CCI has also rebounded on the -290.00 CCI level which was the March 2020 COVID low.
Practically that means that if the Death Cross turns into a Buy Signal again, THETAUSD should go after a new Higher High within the Channel Up, and a $35.00 Target based on a 1.5 Fibonacci extension estimate would seem modest.
** Please support this idea with your likes and comments, it is the best way to keep it relevant and support me. **
--------------------------------------------------------------------------------------------------------
!! Donations via TradingView coins also help me a great deal at posting more free trading content and signals here !!
🎉 👍 Shout-out to TradingShot's 💰 top TradingView Coin donor 💰 this week ==> Pablito1986z
--------------------------------------------------------------------------------------------------------

THETAUSDT D1: 500%+ gains THE BEST Level to BUY/HOLD (UPDATE)Why get subbed to me on Tradingview?
-TOP author on TradingView
-15+ years experience in markets
-Professional chart break downs
-Supply/Demand Zones
-TD9 counts / combo review
-Key S/R levels
-No junk on my charts
-Frequent updates
-Covering FX/crypto/US stocks
-24/7 uptime so constant updates
THETAUSDT D1: THE BEST Level to BUY/HOLD 500%+ gains(SL/TP)(UPDATE)
IMPORTANT NOTE: speculative setup. do your own
due dill. use STOP LOSS. don't overleverage.
🔸 Summary and potential trade setup
::: THETAUSDT D1 chart review
::: chart looks good /strong
::: still valid today / great setup BULLS
::: BULL FLAG setup with massive upside
::: still expecting pullback off the highs
::: get ready to BUY LOW later
::: accumulation in range previously
::: then we had 150% gains PUMP
::: we had 2 pump already before this
::: 265% pump - pullback
::: then 150% pump and now pullback mode
::: expecting short-term pullback
::: BULLS get ready to BUY after pullback
::: TP bulls is +500% gains later
::: expecting decent gains soon
::: 20-30% pullback short-term
::: recommended strategy: BUY/HOLD after pullback
::: TP BULLS +500% gains
::: SWING TRADE: BUY/HOLD IT
::: bull run not over yet
::: good luck traders!
::: BUY/HOLD and get paid. period.
🔸 Supply/Demand Zones
::: N/A
::: N/A
🔸 Other noteworthy technicals/fundies
::: TD9 /Combo update: N/A
::: Sentiment mid-term: BULLS
::: Sentiment short-term: BEARS/PULLBACK
RISK DISCLAIMER:
Trading Crypto, Futures , Forex, CFDs and Stocks involves a risk of loss.
Please consider carefully if such trading is appropriate for you.
Past performance is not indicative of future results.
Always limit your leverage and use tight stop loss.
