Theta Network (THETA) - May 3Hello?
Dear traders, nice to meet you.
By "following" you can always get new information quickly.
Please also click "Like".
Have a good day.
-------------------------------------
(THETAUSD 1D chart)
We must see if we can move above the 11.22403904 point and break off the downtrend line.
If there is a movement above the downtrend line, it is expected to continue the uptrend.
If you fall from the 8.78208911 point, you can touch the 6.75133141 point or less, so you need a Stop Loss to preserve your profit and loss.
However, it may rise along the uptrend line, so careful trading is necessary.
On the CCI-RC indicator, the CCI line fell below 100 points.
It remains to be seen if the CCI line can rise above 100 points.
If the CCI line does not rise above 100 points, there is a possibility that it will turn into a downtrend, so careful trading is necessary.
--------------------------------------
(THETABTC 1D Chart)
We need to see if we can get support at the 19486 Satoshi spot and get off the downtrend line.
In particular, it remains to be seen if it can rise along the uptrend line.
If it falls, we need to make sure we get support in the 17437 Satoshi-19486 Satoshi section.
If it falls at the 13341 Satoshi branch, Stop Loss is needed to preserve profit and loss.
--------------------------------------
It is advisable to trade at your average unit price.
This is because if the price flows below your average unit price, which was on an uptrend or downtrend, there is a high possibility that you will not be able to earn a large profit due to the psychological burden.
The center of every trade starts with the average unit price you start trading.
If you ignore this, you may be trading in the wrong direction.
Therefore, it is important to find a way to lower the average unit price and adjust the proportion of the investment, so that the money that ultimately corresponds to the profit can regenerate the profit.
-------------------------------------------------- -------------------------------------------
** All indicators are lagging indicators.
So, it's important to be aware that the indicator moves accordingly with the movement of price and volume.
Just for the sake of convenience, we are talking upside down for interpretation of the indicators.
** The wRSI_SR indicator is an indicator created by adding settings and options from the existing Stochastic RSI indicator.
Therefore, the interpretation is the same as the conventional stochastic RSI indicator. (K, D line -> R, S line)
** The OBV indicator was re-created by applying a formula to the DepthHouse Trading indicator, an indicator that oh92 disclosed. (Thank you for this.)
** Check support, resistance, and abbreviation points.
** Support or resistance is based on the closing price of the 1D chart.
** All explanations are for reference only and do not guarantee profit or loss on investment.
Explanation of abbreviations displayed on the chart
R: A point or section of resistance that requires a response to preserve profits
S-L: Stop Loss point or section
S: A point or segment that can be bought for profit generation as a support point or segment
(Short-term Stop Loss can be said to be a point where profits and losses can be preserved or additionally entered through installment transactions. It is a short-term investment perspective.
GAP refers to the difference in prices that occurred when the stock market, CME, and BAKKT exchanges were closed because they do not trade 24 hours a day.
G1: Closing price when closed
G2: Cigar at the time of opening
(Example) Gap (G1-G2)
THETAUSD

Theta: A Trade Set-UpTheta in my opinion seems ready to break some key levels and start running to new all-time highs. Not Financial Advice... CHEERS!

THETAUSDT Good BUY!THETAUSDT (2H Chart) Technical Analysis Update
Resistance line breakout
THETA/USDT currently trading at $11.35
Buy-level: Above $11.50 (only buy if 1h candle close above 11.50$)
Stop loss: $10.30
Target 1: $11.90
Target 2: $12.50
Target 3: $13.00
Target 4: $13.90
Max Leverage: 2X
ALWAYS KEEP STOP LOSS...
Follow Our Tradingview Account for More Technical Analysis Updates, | Like, Share and Comment Your thoughts.

THETAUSD Strong long-term buy signalPattern: Channel Up on 1D.
Signal: Buy as the price rebounded within the 1D MA50 (blue trend-line) MA100 (green trend-line) zone, which has been the strongest buy signal since June 2020. Confirmation when the LMACD forms a Bullish Cross.
Target: 115.000 (just below the 3.5 Fib extension and the 1.5 Fib level of the Channel).
** Please support this idea with your likes and comments, it is the best way to keep it relevant and support me. **
--------------------------------------------------------------------------------------------------------
!! Donations via TradingView coins also help me a great deal at posting more free trading content and signals here !!
🎉 👍 Shout-out to TradingShot's 💰 top TradingView Coin donor 💰 this week ==> EBITDAtiger
--------------------------------------------------------------------------------------------------------


THETAUSDT breakout!THETAUSDT (1H CHART) Technical Analysis Update
THETA/USDT currently trading at $9.37
Buy-level: $9.20- $9.40
Stop loss: Below $8.45
Target 1: $9.98
Target 2: $10.60
Target 3: $11.33
Target 4: $12.35
Max Leverage: 2X
ALWAYS KEEP STOP LOSS...
Follow Our Tradingview Account for More Technical Analysis Updates, | Like, Share and Comment Your thoughts.

THETA - GET READY 🚀Theta has been moving correctively down in steps and we are approaching the 200EMA which lines up with a major ascending trendline. The ideal area to buy would be the $6 mark.
Alternatively, if we break the $10 mark impulsively, we could see it break up to make new highs!

THETA - GET READY 🚀Theta has been moving correctively down in steps and we are approaching the 200EMA which lines up with a major ascending trendline. The ideal area to buy would be the $6 mark.
Alternatively, if we break the $10 mark impulsively, we could see it break up to make new highs!

Theta Network (THETA) - April 24Hello?
Dear traders, nice to meet you.
By "following" you can always get new information quickly.
Please also click "Like".
Have a good day.
----------------------------------
We need to see if we can get support on the 8.78208911-9.87327158 section and get off the downtrend line.
If it falls at the point of 6.59972404, a Stop Loss is required to preserve profit and loss.
In order to turn to an uptrend, it must rise above the 11.22403904 point to gain support.
--------------------------------------
(THETABTC 1D Chart)
We have to see if we can gain support and ascend in the 17437 Satoshi-19486 Satoshi section.
If it falls at the Satoshi branch, 13341 Stop Loss is needed to preserve profit and loss.
--------------------------------------
It is advisable to trade at your average unit price.
This is because if the price flows below your average unit price, which was on an uptrend or downtrend, there is a high possibility that you will not be able to earn a large profit due to the psychological burden.
The center of every trade starts with the average unit price you start trading.
If you ignore this, you may be trading in the wrong direction.
Therefore, it is important to find a way to lower the average unit price and adjust the proportion of the investment, so that the money that ultimately represents the profit can regenerate the profit.
-------------------------------------------------- -------------------------------------------
** All indicators are lagging indicators.
So, it's important to be aware that the indicator moves accordingly with the movement of price and volume.
Just for the sake of convenience, we are talking upside down for interpretation of the indicators.
** The wRSI_SR indicator is an indicator created by adding settings and options from the existing Stochastic RSI indicator.
Therefore, the interpretation is the same as the conventional stochastic RSI indicator. (K, D line -> R, S line)
** The OBV indicator was re-created by applying a formula to the DepthHouse Trading indicator, an indicator that oh92 disclosed. (Thank you for this.)
** Check support, resistance and abbreviation points.
** Support or resistance is based on the closing price of the 1D chart.
** All explanations are for reference only and do not guarantee profit or loss on investment.
Explanation of abbreviations displayed on the chart
R: A point or section of resistance that requires a response to preserve profits
S-L: Stop Loss point or section
S: A point or segment that can be bought for profit generation as a support point or segment
(Short-term Stop Loss can be said to be a point where profits and losses can be preserved or additionally entered through installment transactions. It is a short-term investment perspective.)
GAP refers to the difference in prices that occurred when the stock market, CME, and BAKKT exchanges were closed because they do not trade 24 hours a day.
G1: Closing price when closed
G2: Cigar at the time of opening
(Example) Gap (G1-G2)

Theta possible new ATH???So THETA has made a new high and then dropped due to BTC dump.
Right now THETA has been making a higher low and forming a nice triangle which could lead us all the way up to 15 or all the way down to 7...
In my opinion, we wouldn't go down to 7... I think we would stop at 10.
Just watch the chart and also watch BTC!
If it dumps again... we all get screwed!
Set your stop-loss!!!

THETA IDEA UPDATE! Hello, I am updating my first ever idea on THETA. This is my idea based on the technical analysis and what I know about it's fundamentals. Since I have been following THETA, it has had a massive growth and I actually I rate it as one of the best fundamental projects I have been into recently, I recommend you to check it. Many people booked some profit (also some of the events were delayed) and as we can see it has been following quite a small downtrend. But If you look at the indicators, and also the formed, it seems as THETA looks quite bullish right now and it actually is bullish for short and for long if you hold a big bag of it.
In my analysis I have mentioned the trend in the short term. If the trend jumps from the red line, it will be bullish for short, so there is the area for SL if you have bought or if you are willing to buy, just be careful, it has to jump from the red line.
The 2 TP (13.8 - 14.8) are mentioned in the area there quite as the SL(12.3). Personally I see a good profit from 10%-30% in THETA in the short term and if the trend continues sideways in between the TP, we could see new support being formed there and another uptrend soon.
Do your own research too. And be as profitable as possible. :) If you have any comment or any other idea, it would be really helpful. :)


THETAUSDT Good BUY!THETAUSDT (4H Chart) Technical Analysis Update
Resistance breakout
THETA/USDT currently trading at $13.17
Buy-level: Above 13.50 (only buy if 4h candle closes above 13.50)
Stop loss: 11.74
Target 1: $14.00
Target 2: $14.95
Target 3: $16.00
Target 4: $17.50
Max Leverage: 3X
ALWAYS KEEP STOP LOSS...
Follow Our Tradingview Account for More Technical Analysis Updates, | Like, Share and Comment Your thoughts.

THETA – Long signalTHETA is looking ready to re-test the previous highs and make another leg up
-The price has been forming a pennant over the past ~23 days and the range has been compressing
-The 100 EMA has been acting as support
-Price is currently retesting the bottom of the pennant and the 100 EMA. The confluence with these two levels of support suggest the price will bounce up from here
Get long.
Your risk, your reward.
Happy trading.


THETA is gonna explode soon!THETA has been accumulating over the past few days!
Right now I am expecting a breakout and the following test.
If everything goes right we might see a new ATH!
Prepare your trades!!
Red area - support level
Orange area - buying zone

THETA/USDT is going to increase even more!Hi every one
THETA TOKEN / TETHERUS
As you can see THETA/USDT is in a bullish pennant but the break out has not happened yet but there are Hidden bullish divergences on both MACD and RSI indicators that shows us the expected bullish movement is more likely to happen but as you can see the MACD line is under the signal Line of MACD indicator so we can expect a little bit of correction before the bullish movement happens. the expected bullish movement is as much as the flag pole!
Traders, if you liked this idea or have your opinion on it, write in the comments, We will be glad.
Things can change...
The markets are always changing and even with all these signals, the market changes tend to be strong and fast!!
Thank you for seeing idea .
Have a nice day and Good luck

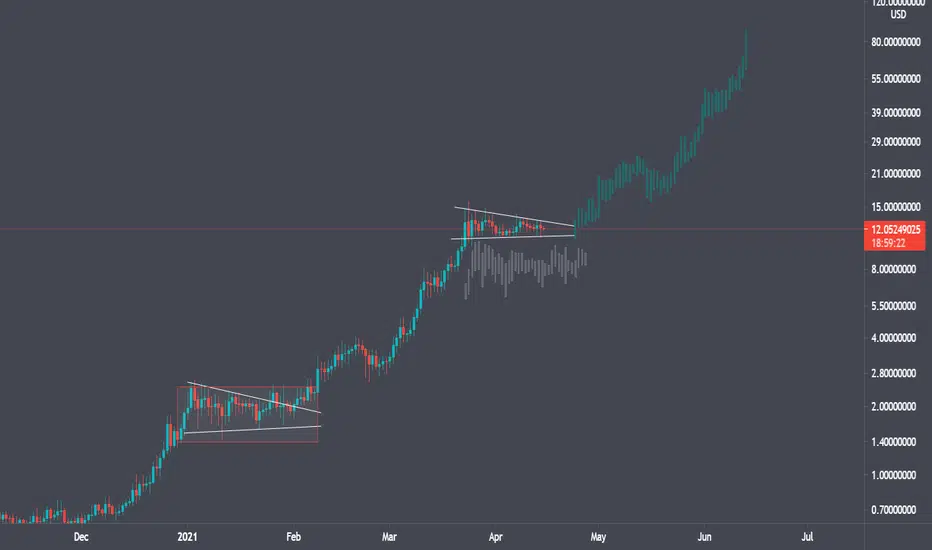
$THETA Current ViewTheta has had a massive run, and I do not see it stopping here.
We have seen the same pattern play our here for a few months now.
Price has a massive bullish uptrend -> consolidation in symmetrical wedge -> massive breakout.
From the current view we have right now, It looks like a breakout is immanent very soon!
We must also monitor the volatility of BTC as the ALT market will trend with BTC if we see downward action.

$25 thetaTheta is too overbought but it has great potential, it is very risky to get in at this level so let it come down to our buying zone to open a position in it

Theta Network (THETA) - April 13Hello?
Dear traders, nice to meet you.
By "following" you can always get new information quickly.
Please also click "Like".
Have a good day.
----------------------------------
We have to see if we can ascend above the 12.28173081 point.
If it falls, we need to make sure it is supported at 11.22403904.
If you decline at 11.22403904, you need a short stop loss.
However, you need to trade carefully as you can touch the 8.78208911-9.87327158 section and go up.
Therefore, it is necessary to think about what kind of response will be made in the section 9.87327158-11.22403904.
The next volatility period is around April 20th.
You have to watch for any movement out of the box section.
--------------------------------------
(THETABTC 1D Chart)
We need to see if we can get support at the 19486 Satoshi spot and get off the downtrend line.
If it falls in the 17437 Satoshi-19486 Satoshi section, a short stop loss is required.
-------------------------------------------------- -------------------------------------------
** All indicators are lagging indicators.
So, it's important to be aware that the indicator moves accordingly with the movement of price and volume.
Just for the sake of convenience, we are talking upside down for interpretation of the indicators.
** The wRSI_SR indicator is an indicator created by adding settings and options from the existing Stochastic RSI indicator.
Therefore, the interpretation is the same as the conventional stochastic RSI indicator. (K, D line -> R, S line)
** The OBV indicator was re-created by applying a formula to the DepthHouse Trading indicator, an indicator that oh92 disclosed. (Thank you for this.)
** Check support, resistance, and abbreviation points.
** Support or resistance is based on the closing price of the 1D chart.
** All explanations are for reference only and do not guarantee profit or loss on investment.
Explanation of abbreviations displayed on the chart
R: A point or section of resistance that requires a response to preserve profits
S-L: Stop Loss point or section
S: A point or segment that can be bought for profit generation as a support point or segment
(Short-term Stop Loss can be said to be a point where profits and losses can be preserved or additionally entered through installment transactions. It is a short-term investment perspective.
GAP refers to the difference in prices that occurred when the stock market, CME, and BAKKT exchanges were closed because they do not trade 24 hours a day.
G1: Closing price when closed
G2: Cigar at the time of opening
(Example) Gap (G1-G2)
