THETAUSD

THETA/USD Breakout Targets Targets at 8,80 and 10,00 following the breakout of the symmetrical wedge.
Only a close below the Kijun Sen (white equilibrium line) will put upward
momentum on hold.

THETAUSDT - NFT token What Is Theta (THETA)?
Theta (THETA) is a blockchain powered network purpose-built for video streaming. Launched in March 2019, the Theta mainnet operates as a decentralized network in which users share bandwidth and computing resources on a peer-to-peer (P2P) basis.The project is advised by Steve Chen, co-founder of YouTube and Justin Kan, co-founder of Twitch.
Theta features its own native cryptocurrency token, THETA, which performs various governance tasks within the network, and counts Google, Binance, Blockchain ventures, Gumi, Sony Europe and Samsung as Enterprise validators, along with a Guardian network of thousands of community-run guardian nodes.
Developers say that the project aims to shake up the video streaming industry in its current form — centralization, poor infrastructure and high costs mean that end users often end up with a poor experience. Content creators likewise earn less revenue due to the barriers between them and end users.
What Makes Theta Unique?
Theta’s main business concept is to decentralize video streaming, data delivery and edge computing, making it more efficient, cost-effective and fair for industry participants.
The network runs on a native blockchain, with two native tokens, known as Theta (THETA), Theta Fuel (TFUEL), powering the internal economy.
Theta’s appeal is threefold: viewers get rewarded with better quality streaming service, content creators improve their earnings and middlemen — video platforms — save money on building infrastructure and increase advertising and subscription revenues.
Users have an incentive to both watch network content and share network resources, as rewards come in the form of TFUEL tokens.
The platform is open source, and token holders receive governance powers as with many proof-of-stake (PoS)-based blockchain ecosystems.
In addition to video, data and computing, Theta caters to developers looking to launch decentralized applications (DApps) on its fully featured EVM-compatible Smart contract platform.

Theta Network (THETA) - March 18Hello?
Dear traders, nice to meet you.
By "following" you can always get new information quickly.
Please also click "Like".
Have a good day.
-------------------------------------------------- -----
You should watch for any movement that deviates from the 7.2259-8.1223 section.
If you move down from the 6.0308 point, you need a short stop loss.
The next volatility period is around March 27th.
-------------------------------
(THETABTC)
You'll have to climb above the 0.00013503 point and see if you can get support.
If it falls, you need to make sure you get support in the 0.00011410-0.00011933 range.
In particular, it remains to be seen if it can rise along the uptrend line.
If you fall from the 0.00011162 point, you need a short stop loss.
-------------------------------------------------- -------------------------------------------
** All indicators are lagging indicators.
So, it's important to know that the indicator moves accordingly with the movement of price and volume.
Just for the sake of convenience, we are talking upside down for interpretation of the indicators.
** The wRSI_SR indicator is an indicator created by adding settings and options from the existing Stochastic RSI indicator.
Therefore, the interpretation is the same as the conventional stochastic RSI indicator. (K, D line -> R, S line)
** The OBV indicator was re-created by applying a formula to the DepthHouse Trading indicator, an indicator that oh92 disclosed. (Thank you for this.)
** Check support, resistance, and abbreviation points.
** Support or resistance is based on the closing price of the 1D chart.
** All explanations are for reference only and do not guarantee profit or loss on investment.
Explanation of abbreviations displayed on the chart
R: A point or section of resistance that requires a response to preserve profits
S-L: Stop Loss point or section
S: A point or segment that can be bought for profit generation as a support point or segment
(Short-term Stop Loss can be said to be a point where profits and losses can be preserved or additionally entered through installment transactions. It is a short-term investment perspective.)
GAP refers to the difference in prices that occurred when the stock market, CME, and BAKKT exchanges were closed because they do not trade 24 hours a day.
G1: Closing price when closed
G2: Cigar at the time of opening
(Example) Gap (G1-G2)

THETAUSDT Pennant patternTHETAUSDT (1H CHART) Technical Analysis Update
Pennant Pattern
THETA/USDT currently trading at $7.34
Long Entry-level: Above $7.58 (only buy if 4h candle closes above 7.58$)
Stop loss: below $6.34
Target 1: $9.00
Target 2: $10.00
Target 3: $12.50
Target 3: $15.00
Max Leverage: 2x
ALWAYS KEEP STOP LOSS...
Follow Our Tradingview Account for More Technical Analysis Updates, | Like, Share and Comment Your thoughts.

THETA & the Stairway to Crypto HeavenWe went long THETA on 26 June 2019 at $0.13. The cryptocurrency had an amazing run throughout 2020 and broke the $2 level on New Years day 2021. The price has continued to explode throughout the first quarter of 2021, reaching a high of $8 before pulling back to $7.29.
THETA looks to solve the problem of diminishing Broadband Capacity. THETA has solved that huge problem with a "self-funding" decentralized broadband expansion technology.
Theta's platform allows users to earn money by sharing bandwidth and computing resources on a peer-to-peer (P2P) basis. It's fast, secure and extremely cheap to use.
Turing-complete smart contract support was enabled on the Theta Blockchain Mainnet last month. Smart contract funcionality opens up a whole new set of user experiences and new attribution models for DApps built on the THETA network
Also, the team announced the next generation THETA blockchain: THETA Mainnet 3.0 projected to launch in the Spring 2021 will introduce TFUEL staking and burning.
Recently Lionsgate became the latest Hollywood studio to bring content to Theta Network. Expect more partnerships with Broadband Streaming to follow with the likes of Netflix , Amazon Prime, YouTube, Hulu, Comcast, Xfinity.
medium.com
In other good news for Theta, ThetaSwap v1 recently launched as the first decentralized exchange (DEX) for Theta blockchain: medium.com
Furthermore Theta Network launched in Japan with LINE Blockchain THETA.tv app: medium.com
We are +5592% on this trade and remain bullish on THETA. It is yet to be listed on Coinbase and the project is still very much under the radar. If the Coinbase listing goes ahead, 330 million U.S. citizens will be able to join the Theta stairway to crypto heaven.
The following is an excerpt from u/Kronix82 'My Detailed Thoughts On Theta And It's Massive Potential' which was posted over on reddit:
'In my strong option Theta is the #1 sleeping giant in the crypto space by far, and what it will do over the next few years will shock even those that are paying attention to it now. Bandwidth sharing, CPU sharing, GPU sharing, storage sharing, DEX, NFT (which will include exclusives with major movie/entertainment and gaming studios/platforms), smart contracts, low fees, incentive for participants, major partnerships with some of the biggest tech, gaming and entertainment companies on the planet (more coming soon) that will be able to expand the nodes from a few 1000's (organic) to over 1 billion by adding edge nodes to cell phones, computers, smart TVs, and even video game consoles via a simple software/ISO update when the timing is right (aka strategically).
Nevermind that right now as we speak Theta.tv is being used as a beta test for YouTube and Twitch (more will follow) so once ready it can be leveraged by those platforms as a 2nd layer solution which will be overlapped ontop of their current CDN's on their platforms, and will be rolled out officially in the future shortly after the nodes are expanded from 1000's to hundreds of millions via the planned software/IOS updates across all these tech companies devices (Samsung/Apple/Sony... and more which are already validators but have not yet made that public and are currently having Theta Labs stake on their behalf for the time being).'
www.reddit.com


$THETA - New Samsung Partnership to Send Theta$THETA is in full send it mode... no lie.
Theta MainNet 3.0
Need to Download THETA Edge Node within H/M/S 39:15:21
MUST SEE TO BELIEVE:
www.youtube.com


THETA - LONG - $8.83THETA is trading above the support zone at $3.81. As long as it is above this support zone, we could start seeing a move towards $4.35, $4.73, $5.20, $6.59 and $8.83. Failure to hold the support at $3.81 could lead to a drop towards $3.49 and $2.98.

Theta (THETA) - March 6Hello?
Dear traders, nice to meet you.
"Like" is a huge force for me.
By "following" you can always get new information quickly.
Thank you for always supporting me.
-------------------------------------------------- -----
You should watch for any movement that deviates from the 3.5255-4.3745 segment.
If you fall in the 3.3840-3.5255 interval, you can touch the uptrend line (3), so you need a short Stop Loss.
In the CCI-RC indicator, it remains to be seen whether the CCI line can rise above the EMA line and turn into an uptrend.
-------------------------------------------------- -------------------------------------------
** All indicators are lagging indicators.
So, it's important to be aware that the indicator moves accordingly with the movement of price and volume.
Just for the sake of convenience, we are talking upside down for interpretation of the indicators.
** The wRSI_SR indicator is an indicator created by adding settings and options from the existing Stochastic RSI indicator.
Hence, the interpretation is the same as the traditional Stochastic RSI indicator. (K, D line -> R, S line)
** The OBV indicator was re-created by applying a formula to the DepthHouse Trading indicator, an indicator that oh92 disclosed. (Thank you for this.)
** Check support, resistance, and abbreviation points.
** Support or resistance is based on the closing price of the 1D chart.
** All explanations are for reference only and do not guarantee profit or loss on investment.
Explanation of abbreviations displayed on the chart
R: A point or section of resistance that requires a response to preserve profits
S-L: Stop Loss point or section
S: A point or segment that can be bought for profit generation as a support point or segment
(Short-term Stop Loss can be said to be a point where profits and losses can be preserved or additionally entered through installment transactions. It is a short-term investment perspective.)
GAP refers to the difference in prices that occurred when the stock market, CME, and BAKKT exchanges were closed because they do not trade 24 hours a day.
G1: Closing price when closed
G2: Cigar at the time of opening
(Example) Gap (G1-G2)

10$ Theta is comingNFTs are in hype and today's video and idea is about these top 5 NFT tokens, their buy zone and their targets.

Theta (THETA) - Februray 25Hello?
Dear traders, nice to meet you.
"Like" is a huge force for me.
By "following" you can always get new information quickly.
Thank you for always supporting me.
-------------------------------------------------- -----
We have to see if we can climb above the 3.3840-3.5255 range.
If it falls, we need to make sure we get support at 3.1011.
If you go down at 3.1011, you can touch 2.8181, so you need a short stop loss.
However, you need to trade carefully as you can touch the uptrend line and go up.
If you get support in the 3.3840-3.5255 range and climb above the 3.5255 point, you're expected to rise above the 3.95 point.
-------------------------------------------------- -------------------------------------------
** All indicators are lagging indicators.
So, it's important to know that the indicator moves accordingly with the movement of price and volume.
Just for convenience, we are talking upside down for interpretation of the indicators.
** The wRSI_SR indicator is an indicator created by adding settings and options from the existing Stochastic RSI indicator.
Hence, the interpretation is the same as the conventional Stochastic RSI indicator. (K, D line -> R, S line)
** The OBV indicator was re-created by applying a formula from the DepthHouse Trading indicator, an indicator that oh92 disclosed. (Thank you for this.)
** Check support, resistance and abbreviation points.
** Support or resistance is based on the closing price of the 1D chart.
** All explanations are for reference only and do not guarantee profit or loss on investment.
Explanation of abbreviations displayed on the chart
R: A point or section of resistance that requires a response to preserve profits
S-L: Stop Loss point or section
S: A point or segment that can be bought for profit generation as a support point or segment
(Short-term Stop Loss can be said to be a point where profits or losses can be preserved or additionally entered through installment transactions. It is a short-term investment perspective.)
GAP refers to the difference in prices that occurred when the stock market, CME, and BAKKT exchanges were closed because they do not trade 24 hours a day.
G1: Closed price
G2: Market price at the time of opening
(Example) Gap (G1-G2)

THETA 240 TF CHARTTHETA is breaking a bullish accumulation zone. The price is compressing leaving more compact highs and lows, which is a clear sign of price continuation. We are looking for a price target at least in the same range as the previous impulse.

Theta Network (THETA) - Februray 18Hello?
Dear traders, nice to meet you.
"Like" is a huge force for me.
By "following" you can always get new information quickly.
Thank you for always supporting me.
-------------------------------------------------- -----
We have to see if we can get support and climb at 3.5255.
In particular, it remains to be seen if it can rise along the uptrend line (4).
If it falls, you need to make sure you get support at 3.3840.
If you fall from the 3.3840 point, you can touch the 3.1011 point, so you need to trade carefully.
If you decline at 3.1011, you need a short stop loss.
If it deviates from the uptrend line (4), there is a possibility of a price adjustment to touch the uptrend line (3).
Accordingly, the expected support range is between 2.6766-2.8181.
-------------------------------------------------- -------------------------------------------
** All indicators are lagging indicators.
So, it's important to be aware that the indicator moves accordingly with the movement of price and volume.
Just for convenience, we are talking upside down for interpretation of the indicators.
** The wRSI_SR indicator is an indicator created by adding settings and options from the existing Stochastic RSI indicator.
Hence, the interpretation is the same as the conventional Stochastic RSI indicator. (K, D line -> R, S line)
** The OBV indicator was re-created by applying a formula from the DepthHouse Trading indicator, an indicator that oh92 disclosed. (Thank you for this.)
** Check support, resistance, and abbreviation points.
** Support or resistance is based on the closing price of the 1D chart.
** All explanations are for reference only and do not guarantee profit or loss on investment.
Explanation of abbreviations displayed on the chart
R: A point or section of resistance that requires a response to preserve profits
S-L: Stop Loss point or section
S: A point or segment that can be bought for profit generation as a support point or segment
(Short-term Stop Loss can be said to be a point where profits or losses can be preserved or additionally entered through installment transactions. It is a short-term investment perspective.)
GAP refers to the difference in prices that occurred when the stock market, CME, and BAKKT exchanges were closed because they do not trade 24 hours a day.
G1: Closed price
G2: Market price at the time of opening
(Example) Gap (G1-G2)

THETA & the Stairway to Crypto HeavenWe went long THETA on 26 June 2019 at $0.13. The cryptocurrency had an amazing run throughout 2020 and broke the $2 level on New Years day 2021. The price has continued to climb and is currently perched at an astounding $3.56.
THETA looks to solve the problem of diminishing Broadband Capacity. THETA has solved that huge problem with a "self-funding" decentralized broadband expansion technology.
Theta's platform allows users to earn money by sharing bandwidth and computing resources on a peer-to-peer (P2P) basis. It's fast, secure and extremely cheap to use.
Turing-complete smart contract support was enabled on the Theta Blockchain Mainnet last month. Smart contract funcionality opens up a whole new set of user experiences and new attribution models for DApps built on the THETA network
Also, the team announced the next generation THETA blockchain: THETA Mainnet 3.0 projected to launch in the Spring 2021 will introduce TFUEL staking and burning.
Last week Lionsgate became the latest Hollywood studio to bring content to Theta Network. Expect more partnerships with Broadband Streaming to follow with the likes of Netflix, Amazon Prime, YouTube, Hulu, Comcast, Xfinity.
medium.com
In other good news for Theta, ThetaSwap v1 recently launched as the first decentralized exchange (DEX) for Theta blockchain: medium.com
We are +2715% on this trade and remain bullish on THETA. It is yet to be listed on Coinbase and the project is still very much under the radar. If the Coinbase listing goes ahead, 330 million U.S. citizens will be able to join the Theta stairway to crypto heaven.

THETA Buy and Sell Signal forecast on 3 timeframesIf you haven`t bought it here:
Now even though THETA is bullish on higher timeframes, it gets sell signals on lower ones.
Sell on 1 hour chart
Sell on 4h chart
Buy on 1 day chart
If you are interested to test some amazing BUY and SELL INDICATORS, which give the signal at the beginning of the candle, not at the end of it, just leave me a message.

$THETAUSD - Tw major resistances are being testedHello everyone!
THETAUSD is testing important resistances at this moment.
Most likely that the pair will breakout from the resistance, though before doing so it will correct a bit.
Nevertheless, going long above 2.60 up to 3.00 and 3.30 is a good idea, if the pair corrects, then see the best nearest support and go long up to 2.80 for the start and to 3.30 if above 2.80.

THETA BULISH MOVE TO $6Hello Traders,,
The chart is telling me THETA is bullish. I have a price target of $6-$6.50
Will update as this unfolds.


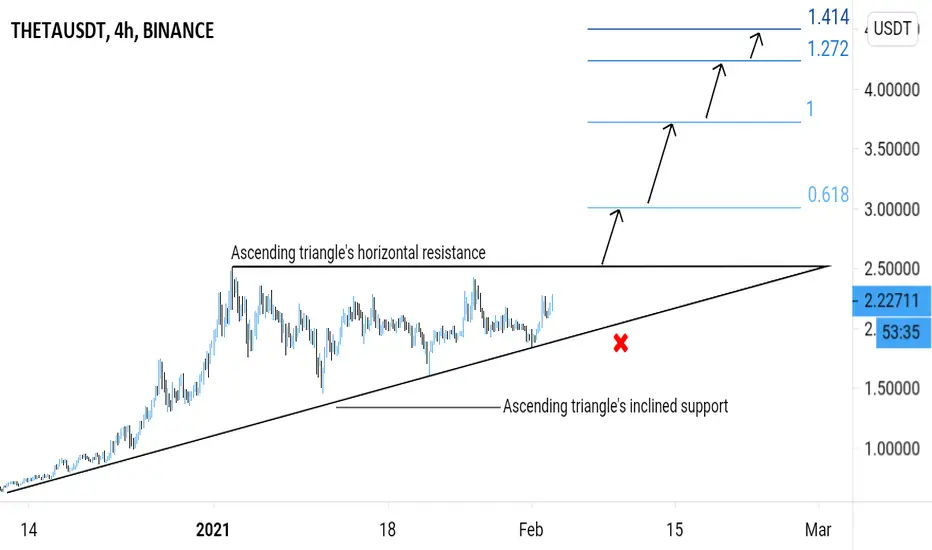
THETAUSDT (THETA TOKEN) - IMMINENT BREAKOUT ANALYSIS 🔎
- THETAUSDT is building up in an ascending triangle pattern.
- This is a bullish build up pattern.
- There's an upward breakout potential.
BUY ENTRY ⬆️
- Breakout above the ascending triangle's horizontal resistance.
TARGETS 🎯
- Fibonacci extension levels.
SETUP INVALIDATION ❌
- Breakdown below the ascending triangle's inclined support.
THETAUSDT (THETA TOKEN) - UPTREND CONTINUATION ANALYSIS 🔎
- THETAUSDT is testing the ascending channel support.
- Price action is printing a symmetrical triangle pattern.
- This is a bullish pennant continuation pattern.
- There's a breakout potential.
BUY ENTRY ⬆️
- Breakout above the symmetrical triangle's inclined resistance.
TARGETS🎯
- Previous swing high horizontal resistance (R1).
- Fibonacci extension levels
- Ascending channel resistance.
SETUP INVALIDATION ❌
- Breakdown below the ascending channel support and symmetrical triangle's inclined support.

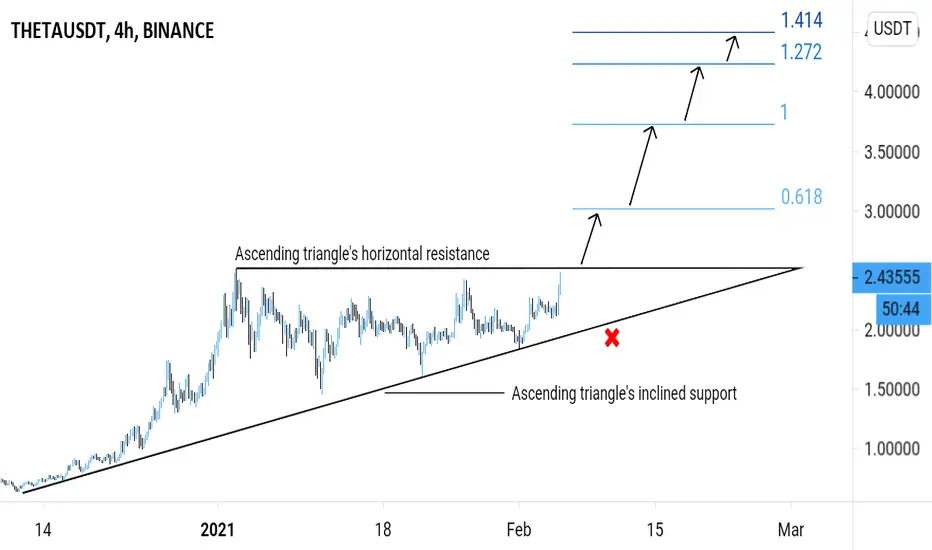
THETAUSDT (THETA TOKEN) - POTENTIAL BREAKOUT ANALYSIS 🔎
- THETAUSDT is building up in an ascending triangle pattern.
- This is a bullish build up pattern.
- There's an upward breakout potential.
BUY ENTRY ⬆️
- Breakout above the ascending triangle's horizontal resistance.
TARGETS 🎯
- Fibonacci extension levels.
SETUP INVALIDATION ❌
- Breakdown below the ascending triangle's inclined support.