$THETA HODL till DecemberWe have an Inverted Head & Shoulders pattern formation on THETAUSDT chart.
#THETA has also good fundamental and it's pumps are parabolic.
NFA
Good luck!
THETAUSD

THETA retested Fib 0.618 and ready to breakout !In THETAUSDT 4h
It retested the Fib level 0.618(5.673) and rebound quickly and it is also the neckline of double bottom
It means the support confirmation .
If it can breakout the downtrend with short upper shadow
Let 's setup
TP1:6.738
TP2:6.918
TP3:7.302
TP4:7.925
SL:5.710

₿ THETAUSDT 1D ₿ : 01.Oct.2021 (Update)Updating previous analysis of THETAUSDT : Everything is clear on the chart and ask any questions you have.
⚠️ This Analysis will be updated ... BINANCE:THETAUSDT
👤 Arman Shaban : @Ar_M_An_4
📅 01.Oct.2021
⚠️(DYOR)

THETA - potential trade 🤑🤑On the higher timeframes, the market forms lower highs and lows, which means that for now, we are in a downtrend. If the market creates a series of higher highs and lows soon, the trend will change and the market will be much better.
Locally, altcoins are forming bullish structures. THETA has broken the trend line and is now squeezing near the resistance level, this is a signal for a breakout and rise. If the price breaks through the resistance and tests it as support, it will be a good buying opportunity.
Write in the comments all your questions and instruments analysis of which you want to see.
Friends, push the like button, write a comment, and share with your mates - that would be the best THANK YOU.
P.S. I personally will open entry if the price will show it according to my strategy.
Always make your analysis before a trade.

Theta forming triangle on the daily timeframe Theta has been forming this triangle since months and i believe we are getting close to the end of it!
I still remain bullish on the overall market, the broader tren is still bullish and triangle are usually pattern continuation.
I think we will see Theta next big move when a breakout of this triangle occur.
Good luck to everyone!

Theta Network (THETA) - September 26Hello?
Welcome, traders.
By "following", you can always get new information quickly.
Please also click "Like".
Have a nice day.
-------------------------------------
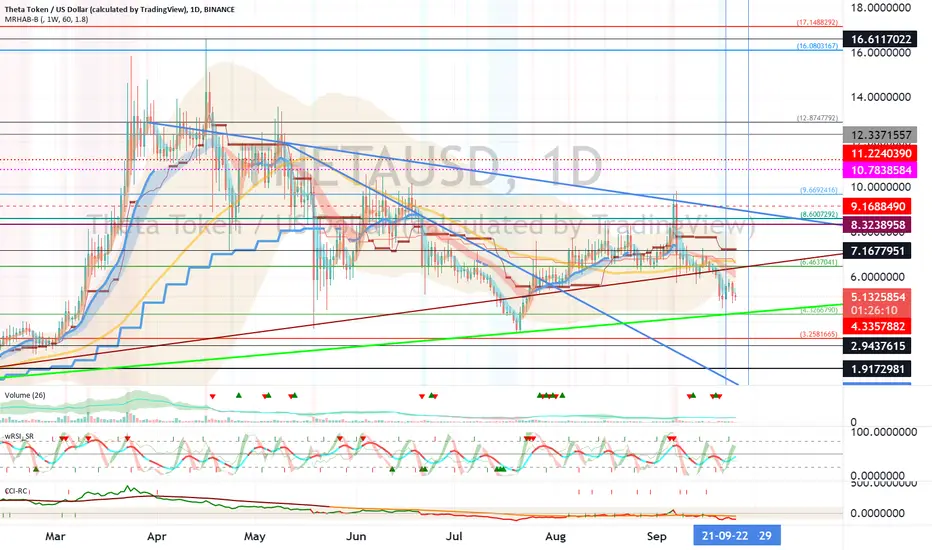
(THETAUSD 1W Chart) - Mid-Long-Term Perspective
Above the 1.9172981-2.9437615 interval: the uptrend continues.
(1D chart)
Support section: 3.2581665-4.3266790
If the decline is from the support area, it could be near the 1.9172981 point, so trade with caution.
Resistance section: 6.4637041-7.1677951
--------------------------------------
(THETABTC 1W Chart) - Mid-Long-Term Perspective
Above the 0.000523-0.0000753 interval: the uptrend is sustainable.
(1D chart)
Decrease in the 0.0001116-0.0001243 section: Stop Loss required to preserve profit and loss.
Resistance section: 0.0001614-0.0001803
------------------------------------------
We recommend that you trade with your average unit price.
This is because, if the price is below your average unit price, whether it is in an uptrend or in a downtrend, there is a high possibility that you will not be able to get a big profit due to the psychological burden.
The center of all trading starts with the average unit price at which you start trading.
If you ignore this, you may be trading in the wrong direction.
Therefore, it is important to find a way to lower the average unit price and adjust the proportion of the investment, ultimately allowing the funds corresponding to the profits to regenerate themselves.
------------------------------------------------------------ -----------------------------------------------------
** All indicators are lagging indicators.
Therefore, it is important to be aware that the indicator moves accordingly as price and volume move.
However, for the sake of convenience, we are talking in reverse for the interpretation of the indicator.
** The MRHAB-O and MRHAB-B indicators used in the chart are indicators of our channel that have not been released yet.
(Because it is not public, you can use this chart without any restrictions by sharing this chart and copying and pasting the indicators.)
** The wRSI_SR indicator is an indicator created by adding settings and options to the existing Stochastic RSI indicator.
Therefore, the interpretation is the same as the traditional Stochastic RSI indicator. (K, D line -> R, S line)
** The OBV indicator was re-created by applying a formula to the DepthHouse Trading indicator, an indicator disclosed by oh92. (Thanks for this.)
** Support or resistance is based on the closing price of the 1D chart.
** All descriptions are for reference only and do not guarantee a profit or loss in investment.
(Short-term Stop Loss can be said to be a point where profit and loss can be preserved or additional entry through split trading. It is a short-term investment perspective.)
THETA SELLING OR SHORT ZONESIf you hold THETA SELL at current price because it is facing a local resistance at $5.63 . If THETA manage to break this resistance then the next two target for sell or open a short position might be 5.87 & 6.10 Doller. You should use the SL above 6.29 for a short positiion.

THETA Forms Descending Channel As Bulls Attempt a Bullish Break-THETA has fallen nearly -12% over the last week
-Prices have formed a descending channel
-THETA is being rejected by the 100MA
Theta Token had an amazing start to the year as prices exploded nearly 1000% at its all time high of $15. Since the market downfall that occurred from May to July, THETA has had much trouble regaining the levels it previously traded at. THETA has a unique use case as its blockchain was built specifically regarding video streaming. This project aims to shake up the video streaming industry as in its current form is highly centralized & costly. THETA aims to speed up with this industry with decentralization & surely is the leading project aiming to tackle this industry.
Throughout the last month, THETA has been stuck in an overall downtrend while many other coins have sprouted to new all time highs. This price movement has formed a descending channel that price has respected very well besides its false breakout which occurred from September 5th - September 7th. Bulls & bears have equally defended each trend as price continues to stay within this channel. For THETA to experience a bullish breakout, bulls must break & hold the current resistance zone found from $6.86-$7.25.
Along with this major resistance zone lies the 100 MA which has acted as resistance for over a week now. If bulls manage to break & hold both of these marks, price will then be free for a push to $7.97 at minimum. In the case bears assert more dominance & reject this potential breakout, expect price to stabilize at the major support of $6.35. If this level fails to hold, price will then fall to the next major support of $5.69. This support also lines up with the bottom trend of the channel & is the last place THETA can fall to before breaking its structure.
While looking at the Stochastic RSI, we can see strength just got rejected within its overbought territory. Strength is now heading down to the oversold zone but may turn back around if it manages to hold the 50 value. Anything below the 50 value will land price back to its next major support. The MACD is now curling over & seems to be getting ready for a bearish cross on the MA’s. If the histogram begins ticking red, expect THETA to have a further downfall.
THETA Intraday Analysis
Spot rate: $6.61
Trend: Bearish
Volatility: Medium
Support: $6.31
Resistance: $6.86


Theta Network (THETA) - September 6Hello?
Welcome, traders.
By "following", you can always get new information quickly.
Please also click "Like".
Have a nice day.
-------------------------------------
(THETAUSD 1W Chart)
The support section is not properly formed.
However, if the price is maintained above the 1.9172981-2.9437615 range, it is expected to continue the upward trend.
(1D chart)
If the price is maintained in the range of 6.4637041-8.6007292, the uptrend is expected to continue.
The 8.6007292-9.6692416 section is resistance and we need to see if we can break through it upwards.
To accelerate the uptrend, it needs to rise above the 9.6692416 point.
If it falls from the 2.9437615 point, you need a Stop Loss to preserve your profit.
-------------------------------------
(THETABTC 1W chart)
The support section is not properly formed.
However, if the price is maintained above the 7530 Satoshi point, it is expected that the upward trend will continue.
(1D chart)
You need to check if you can get support by ascending to the 16140 Satoshi-18030 Satoshi section.
If the price is maintained in the 12370 satoshi-16140 satoshi range, it is expected to turn into an upward trend.
However, in order to continue the upward trend, it must rise above the 18030 Satoshi point.
If it falls from the 12370 Satoshi point, Stop Loss is required to preserve profit and loss.
------------------------------------------
We recommend that you trade with your average unit price.
This is because, if the price is below your average unit price, whether it is in an uptrend or in a downtrend, there is a high possibility that you will not be able to get a big profit due to the psychological burden.
The center of all trading starts with the average unit price at which you start trading.
If you ignore this, you may be trading in the wrong direction.
Therefore, it is important to find a way to lower the average unit price and adjust the proportion of the investment, ultimately allowing the funds corresponding to the profits to regenerate themselves.
------------------------------------------------------------ -----------------------------------------------------
** All indicators are lagging indicators.
Therefore, it is important to be aware that the indicator moves accordingly with the movement of price and volume.
However, for the sake of convenience, we are talking in reverse for the interpretation of the indicator.
** The wRSI_SR indicator is an indicator created by adding settings and options to the existing Stochastic RSI indicator.
Therefore, the interpretation is the same as the traditional Stochastic RSI indicator. (K, D line -> R, S line)
** The OBV indicator was re-created by applying the formula to the DepthHouse Trading indicator, an indicator disclosed by oh92. (Thanks for this.)
** See support, resistance, and abbreviation points.
** Support or resistance is based on the closing price of the 1D chart.
** All descriptions are for reference only and do not guarantee a profit or loss in investment.
Explanation of abbreviations displayed in the chart
R: A point or section of resistance that requires a response to preserve profits.
S-L: Stop Loss point or section
S: A point or section where you can buy to make a profit as a support point or section.
(Short-term Stop Loss can be said to be a point where profit and loss can be preserved or additional entry can be made through split trading. It is a short-term investment perspective.)
GAP refers to the difference in prices that occurred when the stock market, CME, and BAKKT exchanges were closed because they are not traded 24 hours a day.
G1 : Closing price when closed
G2: Opening price
(Example) Gap (G1-G2)

THETAUSDT Trend Line breaks!THETAUSDT (DAY CHART) Technical Analysis Update
Trend line Breakout
THETA/USDT currently trading at $7.98
Buy-level: Above 7.90
Stop loss: $5.90
Target 1: $9.00
Target 2: $10.5
Target 3: $13.00
target 4: $15.30
Max Leverage: 2X or buy it on spot
ALWAYS KEEP STOP LOSS...

💥THETA - TO RISE BY 20% - 28% TO $8 & $8.5Please support this idea with a LIKE👍 if you find it useful🥳
Buy level - $6.55 - $6.70
Stop loss - $6.15
Take profit 1 - $7.80
Take profit 2 - $8.00
Take profit 3 - $8.50
Price is currently in an uptrend at $6.60. if the trend continues, I expect a rise to $8.0 and $8.50.
What do you think?
Share your opinion in the comment section✍️
Follow me to receive more updates on THETA TOKEN (THETAUSDT) 🤗
Happy Trading💰🥳🤗

TFUELUSD 4H might break-out the falling wedge.In TFUELUSD 4H
If the price can break-out the downtrend with short upper shadow.
We can setup the plan like
TP 1: Fib 1 (8.333)
TP 2: Fib 1.272~1.382(9.094~9.401)
TP 3: Fib 2(11.129)
SL: 6.899

THETA - potential trade 🤑🤑Many altcoins are now showing patterns to buy. The Theta chart shows one such pattern. A falling wedge will in most cases break upwards. If the price breaks through and tests the upper limit of the wedge as support, it could be a good buying opportunity.
Write in the comments all your questions and instruments analysis of which you want to see.
Friends, push the like button, write a comment, and share with your mates - that would be the best THANK YOU.
P.S. I personally will open entry if the price will show it according to my strategy.
Always make your analysis before a trade

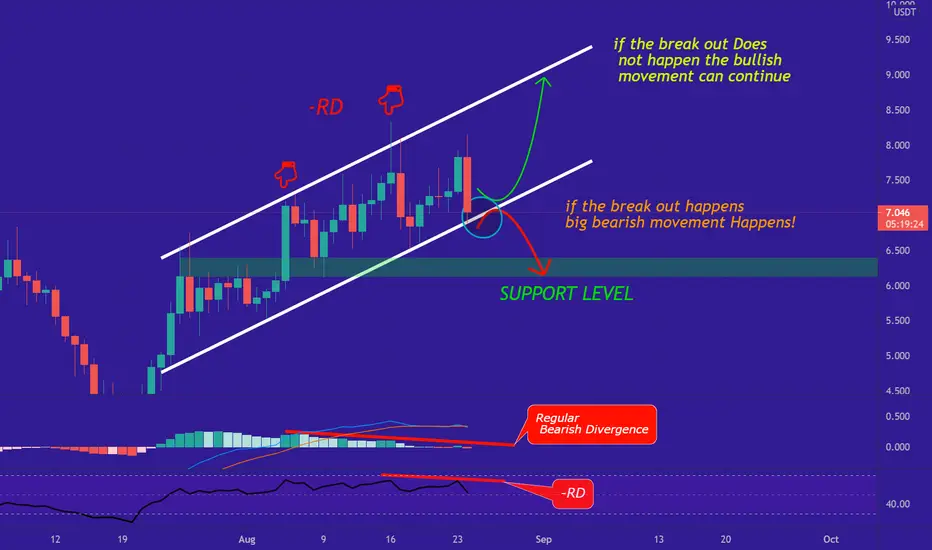
THETA/USDT Can Go Both ways but bears are stronger!Hi every one
THETA TOKEN / TETHERUS
THETA/USDT is in an ascending channel. the Price has a chance to Remain in the Channel but there is also a Regular Bearish Divergence (-RD) on RSI which suggests a Great Bearish Movement!
But we can not be sure until we see a Break out happens! The Price must break the Channel downwardly for confirmation of a Big bearish Movement!
summery:
-THETA is in an ascending channel
-while THETA has a chance to stay in the channel, The (-RD) on RSI Suggests a Big Bearish Movement.
-We must wait for break out to be sure.
💎Traders, if you liked this idea or have your opinion on it, write in the comments, We will be glad.
Thank you for seeing idea .
Have a nice day and Good luck
THETA IS REVVING UPAn important trend line was recently broken, only to confirm that the plunge is over. As you can see there are two important levels that are designated in red. If THETA manages to flip the first resistance zone into support, the commencement of an uptrend in my opinion is confirmed. Volume is strong, and MACD is showing a divergent sign. RSI has room to grow to confirm a catapult above the resistance zone. I am on the lookout to open a trade on the retest of the resistance zone turned support to open a trade with a good R/R. This trade could procure a profit to the tune of 80%. With proper risk management, this trade could turn out to be life-changing, IMO.


TFUEL/USDT Possible breackout !Based on the market trend and the new and potential of TFUEL and THETA it might be a breakout on triangle pattern.
P.S: Educational purpose only. Always do your own research.

THETA-USDTDescending channel has been broken several days ago and this movement is the beginning of great next move
targets: 8.6 - 10 -12.5 - 14.5 - 16.8 - 25 - 37.8 etc

THETAUSDT possible breakoutBINANCE:THETAUSDT chart made a bullish wedge on daily timeframe also MACD momentum is getting weaker.
if breakout happen we may see BINANCE:THETAUSDT price between 6.0$ - 5.5$.
#NFA
Like and share if this helped.


THETAUSDT : Reverse Head & Shoulders PatternAs we can see, after breaking its downward trend, the price is gathering strength to start a strong climb.
In order to buy, the SL (stop loss) and capital management must be observed.
All resistances and TPs (take profits) are marked on the chart.
(DYOR)

Theta token analysis* Theta token in daily time frame forms a Descending triangle pattern, with the above trend-line working as the resistance for the price and it's major support near $3.500.
* Currently the price is in a tight consolidation between, a Horizontal line as a support near $5.500 and the above trend-line.
* If the price breaks the above trend line we can expect a bullish move till TP1 = $7.200, TP2 = $8.600
* And if it breaks the $5.500 level it will back to it's major support.
