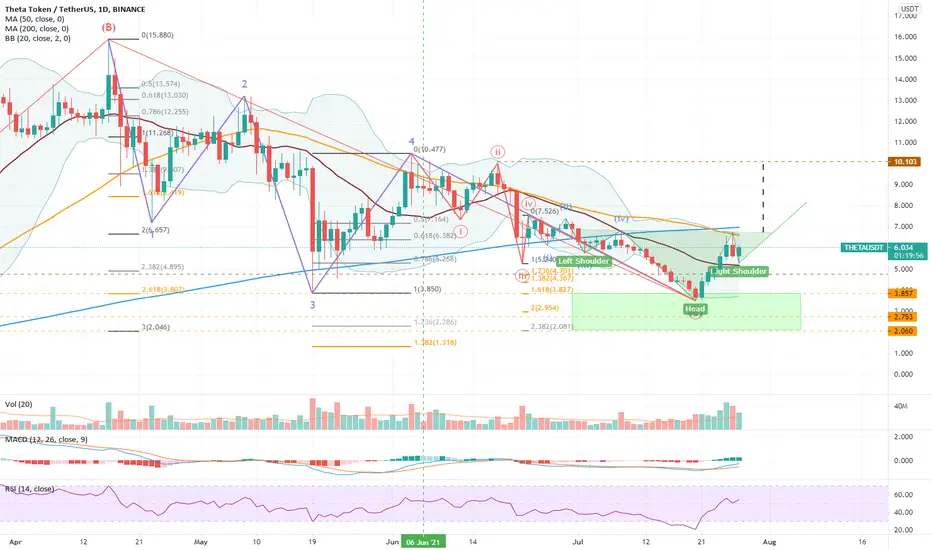
THETAUSDT : Reverse Head & Shoulders PatternAs we can see, after breaking its downward trend, the price is gathering strength to start a strong climb.
In order to buy, the SL (stop loss) and capital management must be observed.
All resistances and TPs (take profits) are marked on the chart.
(DYOR)
Thetausdt

THETAUSDT 4H: Possible LONGTHETAUSDT 4H: Possible LONG
Possible breakdown of the resistance at 7.30 and growth to the next level of 8.50

Theta/BTC 💥🔥Theta has broken a 50-day downtrend and is ready to move higher. Its resistances and goals are plotted in the diagram. If the price stabilizes above the downtrend line, it is suitable for entry.
Currently, due to the increase in the bitcoin range and its movements, all altcoins will be affected by it. The analysis is just a series of probabilities.
I hope you find this analysis useful🌹
Follow for more...

Theta token analysis* Theta token in daily time frame forms a Descending triangle pattern, with the above trend-line working as the resistance for the price and it's major support near $3.500.
* Currently the price is in a tight consolidation between, a Horizontal line as a support near $5.500 and the above trend-line.
* If the price breaks the above trend line we can expect a bullish move till TP1 = $7.200, TP2 = $8.600
* And if it breaks the $5.500 level it will back to it's major support.

THETA Retests 2 Month Trend, Will Bulls Take It Past $8.00?-Theta has risen 25% the last week
-Price just confirmed a 2 month long downtrend
-100MA is now holding as support
Theta had an astonishing run the last year as prices rose 1000s of percent. The use case for THETA around decentralized media is one of great utility & investors has shown their interest in it. Once a few more resistances clear, THETA will likely show immense bullish strength back to previous levels. The majority of crypto assets have broken their downtrends fully & have been reviving strongly to previous levels of May. Soon enough, this should be the case for THETA.
While looking at the last week of trading, we can see how price has fully broken a downtrend line that was holding price down ever since ATH was set. Just over the past day, price has came down to retest this as support. This is a very bullish scenario & may very likely have set the stage for THETA to reach $8.00+. Bulls have been having trouble at the major resistance zone of $6.84-$7.29 over the last few days. THETA must break & hold this resistance for the targets to be reached.
The 100MA was a barrier for over a month as bears continuously rejected price from holding it. THETA has now been holding above this MA , which shows the trend is now up. Earlier today, THETA held the major support of $6.31 very well. Along with this major support lies a trend line that price has been holding ever since the low was recorded in July. As long as bulls continue holding above this trend, price should push to the targets that are shown. In the event these two marks break, THETA will find support at $5.70.
While looking at the Stochastic RSI, we can see how it just managed to break back above the 50 value. This is a great sign but it must continue its way to the overbought region above 80 to really experience a large bullish push. The MACD has been hanging out above the 0 value for nearly 2 weeks. This is a bullish sign along with the fact that the histogram is about to tick green for the first time in 2 days.
THETA Intraday Analysis
Spot rate: $6.82
Trend: Bullish
Volatility: High
Support: $6.31
Resistance: $6.84

#THETA Theta Blockchain, main net launch, PITAGORA my a*sSee chart. I have no idea what I just did, but the arrow points to a bullish target !!!!

Theta prediction As you can see in chart Theta is completely forming inverse Head & Shoulder patter which will lead it to its ATH, If bull run continues than its for sure. But as well i expect a little bigger right shoulder as seen in left shoulder. What do you think of this Please let me know. Follow for more

THETAUSDT - BULLISH SIGNAL UPDATE!As you all know, Theta is not performing well from last 2 months and according to the Chart patterns, Ascending Channel is formed and also indicators giving bullish signal.
Short term Trade, DYOR Before taking trade, as i'm not responsible for your loss.
RISK FACTORS:
Market/BTC CRASH
Happy Trading :)
Good Luck!
If you like my idea, please support:
Binance Smart Chain ( BSC ): 0x69Ea86D0f6B762fC36A322b0C833D2bd04534b3d

💡Don't miss the great buy opportunity in THETAUSDTrading suggestion:
". There is a possibility of temporary retracement to the suggested support line (6.425).
. if so, traders can set orders based on Price Action and expect to reach short-term targets."
Technical analysis:
. THETAUSD is in an uptrend, and the continuation of the uptrend is expected.
. The price is above the 21-Day WEMA, which acts as a dynamic support.
. The RSI is at 51.
Take Profits:
TP1= @ 7.528
TP2= @ 8.538
TP3= @ 10.099
TP4= @ 11.338
TP5= @ 13.195
SL= Break below S2
❤️ If you find this helpful and want more FREE forecasts in TradingView
. . . . . Please show your support back,
. . . . . . . . Hit the 👍 LIKE button,
. . . . . . . . . . Drop some feedback below in the comment!
❤️ Your support is very much 🙏 appreciated!❤️
💎 Want us to help you become a better Forex / Crypto trader?
Now, It's your turn!
Be sure to leave a comment; let us know how you see this opportunity and forecast.
Trade well, ❤️
ForecastCity English Support Team ❤️

💡Don't miss the great buy opportunity in THETAUSDTrading suggestion:
". There is a possibility of temporary retracement to the suggested support line (6.425).
. if so, traders can set orders based on Price Action and expect to reach short-term targets."
Technical analysis:
. THETAUSD is in an uptrend, and the continuation of the uptrend is expected.
. The price is above the 21-Day WEMA, which acts as a dynamic support.
. The RSI is at 51.
Take Profits:
TP1= @ 7.528
TP2= @ 8.538
TP3= @ 10.099
TP4= @ 11.338
TP5= @ 13.195
SL= Break below S2
❤️ If you find this helpful and want more FREE forecasts in TradingView
. . . . . Please show your support back,
. . . . . . . . Hit the 👍 LIKE button,
. . . . . . . . . . Drop some feedback below in the comment!
❤️ Your support is very much 🙏 appreciated! ❤️
💎 Want us to help you become a better Forex / Crypto trader ?
Now, It's your turn !
Be sure to leave a comment; let us know how you see this opportunity and forecast.
Trade well, ❤️
ForecastCity English Support Team ❤️


ThetaToday, Theta was able to break its downtrend line. If it can stabilize above the line tomorrow, it will move towards the first target 🎯

THETA - Leading the recovery?I've mentioned elsewhere the prospects for Theta and how it seems to be leading the recovery in the major alts, at least the ones I'm watching, so I thought I should share here.
As seen in the daily chart above, Theta has formed a very nice right shoulder to a potential Inverse Head & Shoulders pattern. The neckline is at $6.75, which is within spitting distance from here, and a break to the upside of this line of resistance projects a rally to $10, back into the double digit valuation.
The corrective structure can be seen to be completed in Wave Counts, and there is a nice bullish engulfing bar at the bottom signaling a trend reversal.
With head height in the RSI and lots of space for the MACD to extend, things are looking decidedly bullish for THETA.
Will we see $10 and higher soon?
THETAUSDTHello to you all. Mars Signals team wishes you high profits at all times.
We are in a 4-hour time frame. The price was able to climb well. As you can see, at the moment, the price has been able to break its resistance and start moving upwards. As long as it is above its support line, we call the trend bullish. But in case of breaking the support line and stabilizing the fall, we consider the next support.
Warning: This is just a suggestion to you and we do not guarantee profits.
Wish you luck!

$THETA - Long idea (Bullish Pennant)$THETA looking for higher targets in the coming days following an accurate bullish pennant pattern.
Not financial advice!

Theta Token ready for higher prices.. Folks,
Morning..
Theta is ready to make even higher prices than we did last days..
Read the chart for more info.


THETA/USDT BUY SIGNALA short term buying opportunity for the Theta Token, looking for around 6% growth during the next 48h or less.

THETAUSDT Symmetrical Triangle Breakout & RetestTHETAUSDT Symmetrical Triangle Breakout & Retest
Buying: 6.031
TP1: 6.750
TP2: 7.526
SL: 5.525
Note: Do your own analysis. Do proper risk and money management. Spot trading only.

THETA/USDT BULLISH MOVE UPWARDS EXPECTEDTHETA is currently in my trigger zone here, A retest is still pending. If we see a daily close above my trigger zone that will add more confluence to the whole setup here. It would be best to buy at retest the next day if that happens. Whenever I mention a trigger, it means that a momentum candle (no wick) close above it (gray area) and then a retest and we're off towards our targets.
Enjoy the trade. Cheers!
-Mr. Khan

THETAUSDT Moving Along the Bullish Channel
Welcome back Traders, Investors, and Community!
THETAUSDT on H4 after breakout and retest on its way going up
⬆️Buy now or Buy at 5.890
⭕️SL @ 5.17
✅TP1 @ 7.90
✅TP2 @ 10.0
✅TP3 @ 13.12
Check the Links in Description and If you LIKE this analysis, Please support our page and Ideas by hitting the LIKE 👍 button. ❤️ Your Support is really appreciated! ❤️
Traders, if you have your own opinion about it, please write your own in the comment box. We will be glad for this.
Feel free to request any pair/instrument analysis or ask any questions in the comment section below.
We will have more FREE forecasts in TradingView soon
Have a Profitable Day

