THETAUSDTheta is bearish currently as long as downtrend line is respected.
Steps to take:
1) Buy at support $7.20 support line OR Engineering Robo gives multiple buy indicators OR candle open/close above resistance
2) Sell if candle open/close below $7.20 support line
Thetausdt

ThetaSuper theta coins for long-term purposes, buy at current prices for high-risk people, buy in the green box range for low-risk people

TFUEL- On The Rise AgainSuper aggressive today, over 20% higher, despite the trouble we had last week (it dropped after it rose massively).
We keep monitoring the developments on Theta and Theta Fuel and have high expectations.
the FXPROFESSOR

THETA - Consolidated (As you asked)THETA has consolidated enough on this price range
Meaning that if we get a little more support we can pass this resistance shown on chart. Also if the price doesn't get any support, it might fall to the lower price range which I've shown on chart.
I'm more positive about the pump because indicators are showing strength and also trading platforms are showing high Buy volume which supports this pump as it should.
Current Market Price: $8.832
Good Luck
Tell me your ideas. Like and Share


THETA and Theta Fuel (TFUEL) soar ahead of June 30 mainnetOne of the new projects we tend to like more and more by the day, THETA is matching strong fundamentals and good technical characteristics at the same time.
Promising New developments , Promising looking chart analysis and a nice branding:
The Theta blockchain is a decentralized infrastructure that seeks to improve video streaming and delivery . A specific purpose, kinda reminds me the success we had earlier with Enjin.
Go THETA!
the FXPROFESSOR

$THETA - Hard push to the top$THETA has performed very well since BTC collapse recently - we came in @ 10 and @ 3 so DCA has been driven down and have made gainz on the way up.
looking to close at 15.9

THETA-BTC-DESCENDING WEDGE (daily view)Hello traders and investors!! So great to be here today, let's take a little journey and examine THETA📉👇👋
Price touched rims of wedge 4 times, and on the 5th bounce we broke the pattern and exited the wedge.😎
Now I see it possible that we can go to our targets.
QUICK REMINDER 😄🤨📌
Make sure to always use a stop loss 🤚🛑💲 when making trades.👏🆗👌
Consider we may get rejected here, rooting for the bulls.. here is why ⏬⏬⏬⏬⏬⏬ :
Call me crazy, but I have seen Theta pump when BTC is bearish🐻👍, im not missing out on this possibility.
(This chart is different than THETA USDT or USD, we are seeing bullish candles because this chart depicts THETA in relation to BTC price.. BTC dropping, THETA is stronger than the correlational effect that BTC has on it's price.)
This analysis is technical approach. I always recommend considering multiple factors when making any trade!
THETA mainnet launch was recently pushed to JUNE 30th (this month.) This is huge news for THETA and T-fuel .
Let's see and always remember ⏬⏬😉🛑This is not financial advice🛑 Above are approximate targets based on fibs and major trend-lines etc. I always recommend looking at multiple charts when making a big investment, thank you!
Always have a stop loss ✋🛑💲 set
Any thoughts 💭💡, questions 🙋♀️🙋♂️❓, good 👍, bad👎, happy 😄 or sad 😥, in the comments always welcome.
Thank you for reading and trade safely!!!!
Jazerbay ☯

THETA HAS A HUGE POTENTIAL!!!On this analysis, I would like to share my opinion on Theta Coin.
I'm not a fundamental guy, mostly my analysis is coming from the chart, and what I found on the chart is quiet surprising.
First of all, a Descending Broadening Wedge Pattern is forming in the Daily Timeframe, this pattern shows a bullish indication after the Breakout on the Resistance.
But, I also saw a Rising Wedge Pattern forming that give us a sign for a further correction before we can see the Bullish continuation comes back on.
Disclaimer: This content is not a Financial Advise.

THETAUSDT NEXT SCENARIOThetausdt is following a descending channel and definitely there are just two chances , a breakout or a breakdown. You can enter long after breakout with a confirmed retest and if it goes sideways, long at the tagged price point if support holds.All details have been listed on chart and as usual, drop you opinions and give it a like too. Follow me for more helpful contents.

THETA/BTC last resistance THETA / BTC
Despite the drop in USDT pair
In BTC pair we see THETA almost touched ATH again !
it already brokeout a bull flag or decending channel
The last resistance for it is previous ATH ...After Breaking this resistance it can fly easily
It can also retest 0.00021 level which is very important level to hold for continuation of bullrun in this coin
Invalidation : daily close below 0.00021
Dont forget to like my ideas for more good calls and analysis 🙏

Tfuel 26 days to Main Net 3.0 = Sleeping Godzilla?!Hi, thank you for reading this idea!
we are looking at the Daily timeframe.
as you can check on the official Theta Lab Website (www.thetatoken.org), We have only 26 days left To the lunch of Mainnet 3.
as you may not know: this update is focusing on the Tfuel Staking through their Edge Node and etc.
Based on the Ichimoku cloud, there are two points that I have marked in the chart that we have to watch carefully.
if the Ichimoku completes its move to the upside, a Massive Price break out is very possible.
This is only an Idea, Always stick to your own analyses, keep studying charts and
Wish you all the bests.

THETAUSDT Ascending Triangle BreakoutTHETAUSDT Ascending Triangle Breakout
Currently in Retest
Wait for the retest to be completed
NOTE: OPEN BUY IF & ONLY IF THE SETUP IS VALIDATED.
Buying Above: 9.054
TP1: 10.539
TP2: 12.803
TP3: 15.850
SL: 7.421
NOTE: DO YOUR OWN ANALYSIS. DO PROPER RISK AND MONEY MANAGEMENT. SPOT TRADING ONLY.

It will pull down to 0.618 and again pull backas you see in the chart it going down in 1 day to 0.618 and you can buy there and again pullback then you can sell there
good to buy in spot

💡THETA: BUY Trade "Theta Mainnet 3.0 on 30 Jun 2021"Theta Mainnet 3.0 is going to be released at June 30 instead of 21 April 2021.
Before June 30 Consider for Profit Booking...
📈#THETAUSDT
➡️Entry: 7.5$
🎯Target 1: 10.1$
🎯Target 2: 12.6$
🎯Target 3: 14.5$

MATIC/USDTFresh Trade Setup :
MATIC/USDT (BINANCE)
Recommended Buy Zone : $1.70 - $1.85
Targets :
1.95
2.10
2.25
2.45
2.60
Stop Loss : 1.50

THETA - Make Or BreakTheta is at a critical level at the moment. It's facing the 100EMA dynamic resistance and previous structure at $8.50 level. If we manage to break that level, we can consider buying Theta. Until then, it looks very corrective and bearish and we could see a move lower.
Keeping a close eye on the $8.50 level to see how price reacts.

THETAUSDTHello to you all. Mars Signals team wishes you high profits at all times.
The price has lost its support and is starting to move down. We wait for the price to break its resistance and then we enter the trade. We have identified the next resistance for you that we can make a profit in that area. And we have specified the support for you that can be supported in case the price falls.
Warning: This is just a suggestion to you and we do not guarantee profits.
Wish you luck!

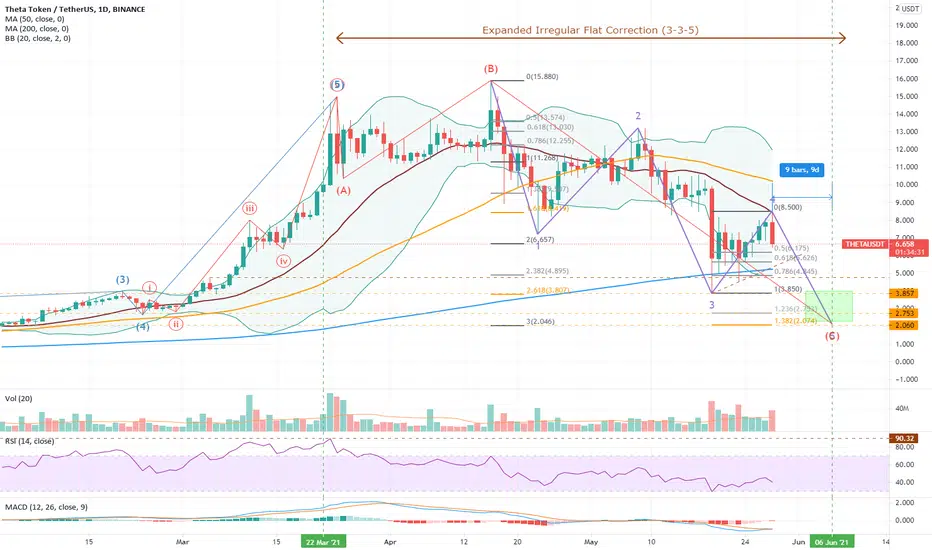
THETA - An irregular flat predictionJust an Elliot Wave projection using a Ichimoku number to forecast the pivot low. However, there are many Ichimoku numbers.
What do you think, will THETA drop to $2.10?
THETA 1D Where to sell and where to buyLet's take another look at THETAUSDT on the global chart today
Since the 75% drain of the coin cooled the dust of small investors a little.
First, let's look at our previous idea THETAUSD , which was published 2 months ago.
Then we wrote that if the price is kept above $11, then there will be a chance for growth to $18. We did not see $18, but the market fixed the maximum +45% at $15.88.
And then the price was drastically lost in two passes. We should recall the words from the last sentence of the previous idea: "a cool head suggests that big money went to THETA in the region of $2"
The minimum price of THETA during the drain was $3.85 and then a corrective rebound began, which continues to this day.
An important area on top is $9.15-11.30 , where current growth can be expected. It is hard to believe that the THETAUSDT price will break this zone up from the first time.
And then we again return to the liquidity zones from the bottom, where the coin was bought with a lot of money.
The first zone is $1.50-2.40
The second zone is $0.55-0.75
(of course, sellers will first need to push the price below $4)
For the future, place buckets for purchases in these zones if the negative background continues to push cryptocurrency prices down.
P.S:
Let's not say that we want these prices, but theoretically, they are real on the crypto market because the price of THETAUSD has grown from $0.04 to $15.88 in a year.
_____________________
Since 2016, we have been analyzing and trading the cryptocurrency market.
We transform our knowledge, trading moods and experience into ideas. Each "like under the idea" boosts the level of our happiness by 0.05% . If we help you to be calmer and richer - help us to be happier :)

THETA/USDT: Finally a pullback for a new entry.THETA was amongst the best performing coins considering the last 12 months.
Finally we see some pullback for new entry opportunities.
The upwards moving trendline did act very well as support so far.
As gaming and streaming will become bigger and bigger also THETA is likely to increase in value.
Basic rules:
- Never buy the top/ATH
- Take profit as long as you can (also partial profit is profit)
- Use Stop/loss for leveraged positions
- If you are not experienced, don't leverage in the first place
Enjoy the ride and don't be too greedy.
If you like the content, please like, comment and give this channel a follow.
We would love it if you could share your thoughts in the comments.
Discussions are very welcome here.
Always do your own research and keep in mind that my charts and comments cannot be considered financial advice.
Cheers
ps.
Chart explanation:
Main lines:
- Green lines are tested support lines.
- Orange lines are resistance lines or, if we are above, possible support lines which were not tested yet.
- Cyan line is for volume trendline.
- White lines are Fibonacci retracement levels
Helplines:
- Purple lines are trendlines we take a look at.
- Yellow lines are for visual help only.
Boxes:
- Either entry zone or support zone. Check the description.

THETA - BUYEntry: after breaking the wedge's upper border at point (5), either with an entry after the breakout, or after a possible retest of the upper border's breakout rate.
Take profit: identified by measuring the vertical distance between the first resistance (1) and the first support (2), that measurement is then applied from the breakout rate (5)
Stop loss: can either be the breakout rate (5), or the last touch to the wedge's lower border (4) before the breakout
FALLING WEDGE PRICE ACTION
This chart pattern can be formed after either an uptrend or a downtrend. Bears make the first move by creating a resistance and pushing the exchange rate downwards. As bulls try to fight back, it looks like the bears have the upper hand as lower highs and lower lows are being formed. However, bulls suddenly start an uptrend by breaking the wedge's upper border resistance that was created by the bears.
Let's break down the pattern formation!
Price action finds the first resistance (1), which will be the highest high in the pattern.
Price action reverses direction from the first resistance (1) and goes downwards till it finds the first support (2), which will be the highest low in the pattern.
Price action reverses direction from the first support (2) and goes upwards, till it finds the second resistance (3), which must be lower than the first resistance (1)
Price action reverses direction from the second resistance (3) and goes downwards, till it finds the second support (4), which must be lower than the first support (2)
The pattern is completed when price action reverses direction from the second support (4) and goes upwards till it breaks the wedge's upper border at point (5)
