Thetausdt


THETAUSDT - NFT token What Is Theta (THETA)?
Theta (THETA) is a blockchain powered network purpose-built for video streaming. Launched in March 2019, the Theta mainnet operates as a decentralized network in which users share bandwidth and computing resources on a peer-to-peer (P2P) basis.The project is advised by Steve Chen, co-founder of YouTube and Justin Kan, co-founder of Twitch.
Theta features its own native cryptocurrency token, THETA, which performs various governance tasks within the network, and counts Google, Binance, Blockchain ventures, Gumi, Sony Europe and Samsung as Enterprise validators, along with a Guardian network of thousands of community-run guardian nodes.
Developers say that the project aims to shake up the video streaming industry in its current form — centralization, poor infrastructure and high costs mean that end users often end up with a poor experience. Content creators likewise earn less revenue due to the barriers between them and end users.
What Makes Theta Unique?
Theta’s main business concept is to decentralize video streaming, data delivery and edge computing, making it more efficient, cost-effective and fair for industry participants.
The network runs on a native blockchain, with two native tokens, known as Theta (THETA), Theta Fuel (TFUEL), powering the internal economy.
Theta’s appeal is threefold: viewers get rewarded with better quality streaming service, content creators improve their earnings and middlemen — video platforms — save money on building infrastructure and increase advertising and subscription revenues.
Users have an incentive to both watch network content and share network resources, as rewards come in the form of TFUEL tokens.
The platform is open source, and token holders receive governance powers as with many proof-of-stake (PoS)-based blockchain ecosystems.
In addition to video, data and computing, Theta caters to developers looking to launch decentralized applications (DApps) on its fully featured EVM-compatible Smart contract platform.


Trade on retest📉Good day, wolves🔥
There is an interesting formation for you.
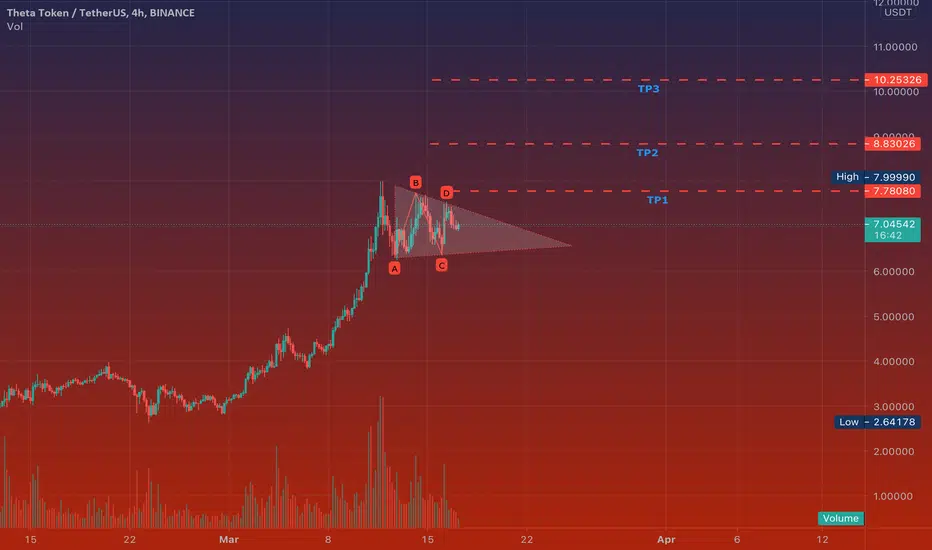
Symmetrical triangle with bullish breakout on THETAUSDT.
There was a strong bullish sentiment before, then the price broke resistance level.
According to Elliott Waves theory all the waves were done.
Now the price entered into the correction and started to retest new support level.
The price should fall to the zone between 7.46 and 7.32
So follow the chart and look for the best price to enter carefully.
_____________________________________________________
If you enjoy my FREE Technical Analysis , support the idea with a big LIKE👍 and don't forget to SUBSCRIBE my channel, you won't miss anything!
Feel free to leave comments✉️
And always remember: "we don't predict, we react".

THETAUSDT (4H CHART) Technical Analysis UpdateLong Entry-level: Above $7.58 (only buy if 4h candle closes above 7.58$)
Stop loss: below $6.34
Target 1: $9.00
Target 2: $10.00
Target 3: $12.50
Target 3: $15.00
Max Leverage: 2x
ALWAYS KEEP STOP LOSS...
Follow Our Tradingview Account for More Technical Analysis Updates, | Like, Share and Comment Your thoughts. BINANCE:THETAUSDT

Theta Network (THETA) - March 18Hello?
Dear traders, nice to meet you.
By "following" you can always get new information quickly.
Please also click "Like".
Have a good day.
-------------------------------------------------- -----
You should watch for any movement that deviates from the 7.2259-8.1223 section.
If you move down from the 6.0308 point, you need a short stop loss.
The next volatility period is around March 27th.
-------------------------------
(THETABTC)
You'll have to climb above the 0.00013503 point and see if you can get support.
If it falls, you need to make sure you get support in the 0.00011410-0.00011933 range.
In particular, it remains to be seen if it can rise along the uptrend line.
If you fall from the 0.00011162 point, you need a short stop loss.
-------------------------------------------------- -------------------------------------------
** All indicators are lagging indicators.
So, it's important to know that the indicator moves accordingly with the movement of price and volume.
Just for the sake of convenience, we are talking upside down for interpretation of the indicators.
** The wRSI_SR indicator is an indicator created by adding settings and options from the existing Stochastic RSI indicator.
Therefore, the interpretation is the same as the conventional stochastic RSI indicator. (K, D line -> R, S line)
** The OBV indicator was re-created by applying a formula to the DepthHouse Trading indicator, an indicator that oh92 disclosed. (Thank you for this.)
** Check support, resistance, and abbreviation points.
** Support or resistance is based on the closing price of the 1D chart.
** All explanations are for reference only and do not guarantee profit or loss on investment.
Explanation of abbreviations displayed on the chart
R: A point or section of resistance that requires a response to preserve profits
S-L: Stop Loss point or section
S: A point or segment that can be bought for profit generation as a support point or segment
(Short-term Stop Loss can be said to be a point where profits and losses can be preserved or additionally entered through installment transactions. It is a short-term investment perspective.)
GAP refers to the difference in prices that occurred when the stock market, CME, and BAKKT exchanges were closed because they do not trade 24 hours a day.
G1: Closing price when closed
G2: Cigar at the time of opening
(Example) Gap (G1-G2)

THETA USDT LONG SIGNAL-Wait for the candle to close above the blueline with good volume.
-you can follow the analysis on 1H or 2H timeframe, but the important is the volume.
-Go step by step.
*NB:BLUELINE: entry level
GREENLINE : take profit
REDLINE: stop loss

THETAUSDT Pennant patternTHETAUSDT (1H CHART) Technical Analysis Update
Pennant Pattern
THETA/USDT currently trading at $7.34
Long Entry-level: Above $7.58 (only buy if 4h candle closes above 7.58$)
Stop loss: below $6.34
Target 1: $9.00
Target 2: $10.00
Target 3: $12.50
Target 3: $15.00
Max Leverage: 2x
ALWAYS KEEP STOP LOSS...
Follow Our Tradingview Account for More Technical Analysis Updates, | Like, Share and Comment Your thoughts.

Target 8.5Following 4h chart
Waiting to break the resistance.
Then target will be 8.5
SL 6.61
Please wait for candle close for SL and breakout.
I'll update, please leave a comment if you join the trade.

THETAUSDTHello to you all. Mars Signals team wishes you high profits at all times.
The price is in a bullish triangle. Any side of it the price breaks out, the new direction will be that.
Warning: This is just a suggestion to you and we do not guarantee profits.
Wish you luck!
Luxury Trade💰Are you ready to trade, wolves🔥
There is a great wedge formation on THETAUSDT crypto pair.
There was a strong bullish sentiment before.
According to Elliott Waves theory all the waves are done and now the price is heading to the breakout.
Follow the chart and look for the breakout carefully.
_____________________________________________________
If you enjoy my FREE Technical Analysis , support the idea with a big LIKE👍 and don't forget to SUBSCRIBE my channel, you won't miss anything!
Feel free to leave comments✉️
And always remember: "we don't predict, we react".

Theta getting ready to release all that built up potentialIt looks like theta is gearing up to release another huge spike, looking back at the graph theta has built up quite a lot of unreleased energy and will release it in short bursts cooling of now and then

THETA.USDT (Y21.P1.E2).Stalking BULL FLAGHi Traders,
Keeping it short, below a many macro charts and theta is one of those you don't won't to miss out.
Right now, I see it going parabolic and hence risky and rewarding.
I will be looking to use the 4 hrly chart \ trend as potential entrance. Its one of those difficult ones as you have to keep an eye out for it, for a bullish candle entrance.
All the best,
S.SAri

THETA’s technical breakout eyes upswing to 10 USDTThe price is trading within the confines of an ascending parallel channel.
THETA has just broken above an ascending channel’s middle boundary resistance, restarting the uptrend.
The MACD had flipped bearish but is currently giving out a bullish impulse.
The uptrend is supported by improving technical levels based on the MACD.
Resistance at $8 may either stop or delay the upswing and perhaps lead to an increase in selling orders.

THETA UNSTOPPABLE. BIG INVESTORS. BIG OPPORTUNITY. $12.THETA.TV. Samsung invested. Sony invested. Gfuel invested.Huge capital funds have noticed. The future of paid streaming and rewards for both streamers, viewers, AND NFT marketplaces. Big players have dropped billons into this within a month. Mainnet launches in 38 Days. There are 4 events planned before then. Samsung VR and the NFT space isn't going anywhere. And with the co-founder of YouTube being the head Media Advisor for THETA.tv, you'd be hard pressed to find a more positive indicator.
*Disclaimer: Not financial advice. Just my projections.


THETA, LONGWaiting for candle close above correction trend line.
Looking for possible long trade at least till 8$-8.20$ (18%-20%)
BINANCE:THETAUSDT

THETA.USDT - Swing Wave 3 CompletedIt appears that Grand Wave 3, the most impulsive wave, has come to a screeching halt -- right on schedule when comparing sub waves within the primary waves, to measure the top of Grandwave above them. Let me know your thoughts and perpectives.

$THETA - New Samsung Partnership to Send Theta$THETA is in full send it mode... no lie.
Theta MainNet 3.0
Need to Download THETA Edge Node within H/M/S 39:15:21
MUST SEE TO BELIEVE:
www.youtube.com


Best price you will ever get $THETA - Samsung Partnership - BUY$THETA has been climbing recently and for very good reason (Samsung Deal).
This is probably the best project we have ever seen come from the crypto space.
It has a little bit of a pullback they we likely never to see again at this price.
The TA clearly shows us it's trying to breakout again here with the MACD and RSI looking very good.
It will most likely bounce off the trend line here pictured and we'll never see the $6 range ever again.
WATCH VIDEO: Here is the Samsung - THETA video: www.youtube.com
THETA: www.thetatoken.org

