Last Chance: $RUNE Poised for Parabolic Move Beyond ATHsThis could be the last chance to enter before CRYPTOCAP:RUNE begins its parabolic move, or at least starts expanding, leaving everyone behind.
The new weekly trend is about to confirm, and it’s at a pivotal area. If it breaks above $7, this will trigger an even bigger upside. I believe CRYPTOCAP:RUNE is on track to break beyond its all-time highs and could potentially reach the second target near $75. It may seem ambitious, but the chart is signaling a strong move ahead. BINANCE:RUNEUSDT
Buying as close as possible to $6.60 for this setup.
Previous entries are posted here
Thorchain

Thorchain ( Rune )THOR Chain
RUNE usdt Daily analysis
Time frame daily
Risk rewards ratio >3.5
Target 6.8 $

RUNE/BTC ThorChain Bullish Exit. Chance to triple your Bitcoin!BINANCE:RUNEBTC is forming a perfect trade setup with a clear defined stop loss and a few targets at +50%, +75% and 3x the current price.
I've been watching RUNE for a long time, and I have made two calls in the past year that were both correct in direction but never reached their targets.
The first call:
On the week of 12 April 2024 when this triangle was broken, I called a target of 3116 Sats. The target was never reached. We ultimately reached a low of 5100 Sats, but we did so in a gradual fashion respecting a descending trendline, which supported the price and acted as a lower line of a falling wedge structure that looks like this:
This was my second call with a target of 10,200 Sats. That target wasn't hit either.
The same lower line of that orange falling wedge now, in light blue, defines the bottom of a new falling wedge structure which is the main subject of this trade.
Price has broken above the falling wedge, then attempted a reversal off the top of it. Four times, the upper line supported price only to be broken the fifth time. A week later, price broke again above the line. I believe this is a perfect setup for a trade with a tight yet reasonable stop loss, and potentially a 3x bullish target.
Bear in mind, I'm calling 3x versus Bitcoin. I'm not talking about BINANCE:RUNEUSDT , which may well reach higher gains.
The stop loss is represented by the descending support line (dotted light blue) beneath the Falling Wedge's upper side.
The Targets are:
50% up to 8400 Sats.
75% up to 10,280 Sats.
200% (3x) up to 18,000 Sats.
Whether RUNE's price will reach these targets depends on the strength of the move. In the case where price gets rejected before or at reaching the first target at 8400 Sats, we can judge the momentum to be too weak, and expect a drop back to the falling wedge, this time, reaching the bearish target of my first call at 3116 Sats.
If the move is strong enough to reach the second target of 10,280 Sats, I expect a pull back and re-accumulation phase into what I labelled the Launching Platform on the chart. (Should've simply called it a Launchpad XD). This could be a bull pennant or an ascending triangle. That's what will push price to the third and log-scale target of 18k Sats.
Follow this chart here .

Rune , the uncontrollable Evening chat. Here we have the logarithmic chart for the rune , one of my favourite babies, trend line broken and retested and atm we heading towards the sky . in my opinion we definitely gonna hit the ath but the optimistic case and obviously not so optimistic ( cause i think the chances are high ) , we have the secure juice tp cause of course we dont wanna sell cheap and then as we head for the price discovery daddy will update the chart .
Stay safe

Thorchain "RUNE" long - will start moving soonRUNEs chart looks super strong both in short and long time frames. A daily close above 5.4 can be the starting point of a fairly quick 35% move to the next target which is 7.3.
Strong fundamentals will sooner or later be reflected in the price. I think an explosion in price is a possible scenario. We are currently in a market where it may soon be too late to take a position, if you're a rune bull, it's definitely time to be ready to take a position or add.
If BTC starts to move rapidly upwards I see RUNE accelerating in price - non financial advice.

RUNEUSD The 1D Golden Cross is the last buy opportunity to $38.THORChain (RUNEUSD) is about to form a Golden Cross on the 1D time-frame. It will be the first since September 06 2023, which at the time was incredibly bullish for the crypto.
As you can see basically, the pattern since the March 13 2024 High is quite similar to the price action from February 08 2023 to the time of the first 1D Golden Cross. Both sequences started declining under Lower Highs trend-lines and once broken, the 1D RSI turned overbought while the price entered a consolidation phase inside a Triangle pattern.
On the September 06 2023 Golden Cross, that Triangle broke to the upside just a week later and 6 months later it completed a +1368.50% rise from the bottom, reaching almost $11.500.
As a result, we expect a similar bullish break-out to take place and the upcoming 1D Golden Cross could perhaps be the last opportunity to buy. If the price follows another +1368.50% rise pattern, then we may very will see RUNE at $38.000 at the end of it.
-------------------------------------------------------------------------------
** Please LIKE 👍, FOLLOW ✅, SHARE 🙌 and COMMENT ✍ if you enjoy this idea! Also share your ideas and charts in the comments section below! This is best way to keep it relevant, support us, keep the content here free and allow the idea to reach as many people as possible. **
-------------------------------------------------------------------------------
💸💸💸💸💸💸
👇 👇 👇 👇 👇 👇

Rune Rally to $14in weekly timeframe after changing market structure we have two entry zone to buy this gem.
targets are: $6.5 - $8.5 - $10 - $11

#RUNEUSDT Ready for a Major Breakout From the Falling WedgeYello Paradisers! Are you prepared for what could be a game-changing move of the #RUNE? Let's look at the latest analysis of #THORChain:
💎#RUNE is currently showing strong potential for a bullish continuation from a critical support zone at $3.50. We've been closely monitoring #THORChain as it follows a falling wedge pattern, and it now seems poised to break above the descending resistance line. The internal resistance at $5.43 is the next key target for #RUNE.
💎If #RUNEUSDT holds firm at this level, we might be on the brink of a significant bullish rally, reminiscent of previous market moves. A breakout above the crucial resistance at $5.43 could set the stage for a push towards the next resistance zones, potentially taking us even higher.
💎However, it's crucial to exercise caution. If momentum weakens at this critical support, we could see a pullback to the lower support area around $2.53-$2.78.
💎Stay vigilant and keep a close watch on CRYPTOCAP:RUNE 's price action. A daily close below this demand area could invalidate the bullish scenario and open the door to further declines.
Stay focused, patient, and disciplined Paradisers.
MyCryptoParadise
iFeel the success🌴

Rune (Thorchain) - DCA, the bottom is nearRune - the fundamentals looks super super strong.
Streaming swaps, new chains and exchanges make Rune grow in a rapid pace.
If you still think we are in a bull market and believe in Rune... this could be a great time to DCA into Rune.
I see Rune 3.00-3.65 dollar as a gift and probably the last time we see Rune so cheap
We have 0.5 fib level at 3.56 to watch out for.

Thorchain (RUNE) "ICO -- funding"Early funding for Thorchain was an ICO. As many people know the SEC in America does not take ICO funding for cryptocurrency lightly. They don't like it and many companies that were first funded as by ICO funding have found their way onto the SEC lawsuits list.

$RUNE: simple head and shoulder pattern: buy zone for longCRYPTOCAP:RUNE is an established DeFi protocol that works and is solid, based on its own blockchain, Thorchain. No token unlocks, all tokens are vested, making it relatively safe from rug pulls. However, like many other altcoins, it has been overheated and is undergoing a drastic cooldown.
This pattern is a classic one, easy to identify, and therefore the target is below the neckline at $2 or less. It looks very low, but if you look at the Weekly MACD, you can see that it is not oversold and needs more downside to reset before a reversal.
Even if it bounces because CRYPTOCAP:BTC has another pump, the chart pattern suggests not buying above this zone as it would go against the chart theory.
Do what you want, but I have put my buy order in the green zone, which guarantees me a significant profit if it gets filled. If not, I will buy another coin.
Always do your own research (DYOR). This is not financial advice; I am just articulating what the chart indicates. It is up to you to make any informed decision based on that.

RUNEUSD Bull Flag completed. Expect x10 rise at least!THORChain (RUNEUSD) is on its 1W MA50 (blue trend-line) for the 3rd straight week, after holding and rebounding on the 1W MA100 (green trend-line). In our view, this has completed the long-term Bull Flag (Channel Down) pattern that emerged after a +1428% rise from the June 2023 market bottom.
If we take a look at the previous Bull Cycle, a +1400 rise has been a norm during that run, in fact the rally started after a +1467% rise, which got doubled on its on the subsequent two rallies to the market top.
As a result, we expect at least another +1428% rise, thus putting our Target at a x10 state at $45.00.
-------------------------------------------------------------------------------
** Please LIKE 👍, FOLLOW ✅, SHARE 🙌 and COMMENT ✍ if you enjoy this idea! Also share your ideas and charts in the comments section below! This is best way to keep it relevant, support us, keep the content here free and allow the idea to reach as many people as possible. **
-------------------------------------------------------------------------------
💸💸💸💸💸💸
👇 👇 👇 👇 👇 👇

RUNEUSDT: Short Opportunity, Bearish Reversal Signals 54,30%?Hi Realistic Traders, let's delve into the technical analysis of BINANCE:RUNEUSDT
The chart has formed a compelling Head and Shoulders pattern and has decisively moved below the neckline, signaling a powerful shift from a bullish to a bearish trend. This bearish transition is confirmed by the price movement dropping below the EMA200 line. We anticipate an exciting continuation of this bearish momentum, targeting the Unfilled Order Area at 2.750. Following a potential pullback to the historical resistance area, the downward journey is expected to continue toward an enticing target of 2.052.
It is essential to note that the analysis will no longer hold validity once the target/support area is reached.
Disclaimer: "Please note that this analysis is solely for educational purposes and should not be considered a recommendation to take a long or short position on ThorChain Coin."
Please support the channel by engaging with the content, using the rocket button, and sharing your opinions in the comments below

RUNE: $6.55 | for 2023 Homerun at $120 levelslike SOLANA LUNA and the rest of big ticket items of Silicon Dubai Funds.. this one is in play for float to be taken over and peddel to $100 levels by Q4
in time for QATAR 2022 fifa fever

THORChain (RUNE): Chances for a Swing TradeOn the two-hour timeframe, the clarity of the market movements for BINANCE:RUNEUSDT becomes even more evident. The end of Wave ((i)) is marked by our high at $11.47. Following this peak, there has been a consistent downtrend, punctuated by a brief corrective phase—this is typical market Elliott Wave behavior.
We potentially have the end of Wave ((ii)) established within the 50% to 78.6% retracement levels. Additionally, a Fair Value Gap (FVG) is marked in yellow on this chart. This scenario presents a second strategic play for Rune.
We would wait for the price to rise, triggering a change in structure. This would involve retesting the trendline and the Fair Value Gap, then breaking out above and re-touching the support zone where we could place our entry.
This strategy would represent a short-term trade opportunity but is quite intriguing due to the dynamics at play on the lower timeframe. It’s feasible that we might follow this plan depending on how the situation develops with Rune.

THORChain (RUNE): An outlook on the Higher TimeframeAt BINANCE:RUNEUSDT , we are initially examining the monthly chart because we believe it reveals something very significant and promising. We are potentially in a major Wave 3, which could realistically target at least $34.70. This is a considerably high target, yet feasible for Rune given its performance relative to other cryptocurrencies—it hasn't risen as sharply, suggesting there might be substantial upward potential once it breaks out.
We have observed multiple fakeouts around this trendline but have never truly broken above it. This trendline, along with the demand zone highlighted on the monthly chart, will be crucial anchors for our analysis.
We do not expect to fall below this demand zone; it forms the basis of our swing or spot bag setup for Rune. The response to recent price dips has been encouragingly positive, indicating resilience. If we see a clear breakout above this trendline and the price successfully consolidates above it, we anticipate significant bullish momentum to follow.

RUNE - MASSIVE BREAKOUT IS COMING!RUNE is breaking out its resistance line, so we can expect a bullish momentum.
Buy zone - current price
Targets - as given in chart

THORChain RUNE Price wondering where to turn nextThe RUNEUSDT price does not behave like most altcoins or even BTC.
So, we can assume that MM is leading it "where it needs to go."
The previous wave of RUNE price growth was also "on its own" - it was driven up without any correction and despite negative news inputs on the market.
We don't know whether the same situation will happen again now, but we will be watching the price of THORChain token very closely around $5.25
- If it is fixed higher, then we take the blue scenario as a reference point.
- If sales begin and the price does not go above $5.25, then the red scenario will become quite realistic.
Frankly speaking, after such a wave of growth as we had in the second half of 2023 (almost uncorrected), it would be nice to see a deeper correction, perhaps even to $2.40
If we don't see this, then the targets for the pump are much higher, and we will need "to jump on board" in time
_____________________
Did you like our analysis? Leave a comment, like, and follow to get more

Ascending Apex: RUNE's Breakout Poised to Chart New Heights
Trendline Breakout: The central focus is on the cyan trendline that has been capping the price. A close above this trendline would signify a breakout, indicating bullish momentum. We will be watching for a decisive candlestick close above such a resistance trendline as confirmation of strength before initiating a long position.
Retest Strategy: A conservative and strategic approach involves waiting for a retest of the breakout level, which was previously resistance and may now turn into support. Entry at a retest offers a favorable risk-to-reward ratio because it allows for a tighter stop-loss just below the retested trendline.
200 EMA and the 50 EMA: The price is currently above both EMAs, suggesting a short-term bullish bias. The EMAs also appear to be providing dynamic support for the price action.
Overall Uptrend: The broader perspective shows RUNE in a general uptrend, which is the direction of the path of least resistance. A trend-following trade in an uptrend typically carries a higher probability of success of this trade.
Market Sentiment: Staying attuned to overall market sentiment and news specific to RUNE will provide additional context for the trade, as fundamental factors can swiftly impact technical setups.
In summary for now we are not doing anything and we will be watching closely where today's Candle will close. The close above the cyan trendline followed by a retest offers a prudent long entry point with a confluence of bullish indicators. Patience in waiting for these conditions to be met could provide a more confident entry with a well-defined risk profile. The current position of price relative to the EMAs and the general uptrend add further weight to the bullish scenario. However, it remains critical to monitor the trade and adjust to any new market information or technical developments.
Peace out.

RUNEUSD New MACD Cross can send it to $40. Cycle Top even $800!THORChain / RUNEUSD is about to form a Bullish Cross on the 1W MACD.
The previous Bullish Cross saw the price grow by +911.54%.
Another such rebound targets $40.00, that should be your medium term target.
Long term, if the price goes for a full repeat of the 2019-2021 run, we may even see $800 as the Cycle Top but don't keep the majority of your coins until then.
Previous chart:
Follow us, like the idea and leave a comment below!!

THORCHAIN ANALYSIS - Could RUNE Be In A New Bull Market???As you may be aware, I've been closely monitoring the Top 50 cryptocurrencies recently and have formulated several hypotheses aligning with the Bitcoin pattern, based on strict metrics. However, one particular crypto deviates from this trend, prompting me to investigate further. Despite not fitting the established pattern, the inherent pattern suggests significant upside potential—I've even heard predictions of $180, a figure I find plausible.
I believe this crypto is poised for a substantial surge, and while I'm not suggesting a long-term trade idea just yet, I wanted to alert you to my observation.
If the bullish momentum continues to build, I intend to consider trading it.

RUNE/USDT On the Cusp of a Bullish Break from Demand Zone? 👀💎 Paradisers, get set for a lucrative trading moment with #RUNEUSDT, as signs point towards a bullish continuation from a key demand level.
💎 Exploring #thorchain current path, it's encountering resistance at the $6.094 supply level. We're positioned for a bullish turnaround from the demand level of $5.503. Should the price maintain its drive, a strong bullish trajectory is anticipated, setting the stage for another assault on the formidable supply zone.
💎 If the drive behind #RUNE starts to wane, anticipate a bullish resurgence from the established demand at $5.034. The significant liquidity at this level boosts the chances of a bullish push. Yet, a descent below this critical point may signal a shift towards bearish territory.

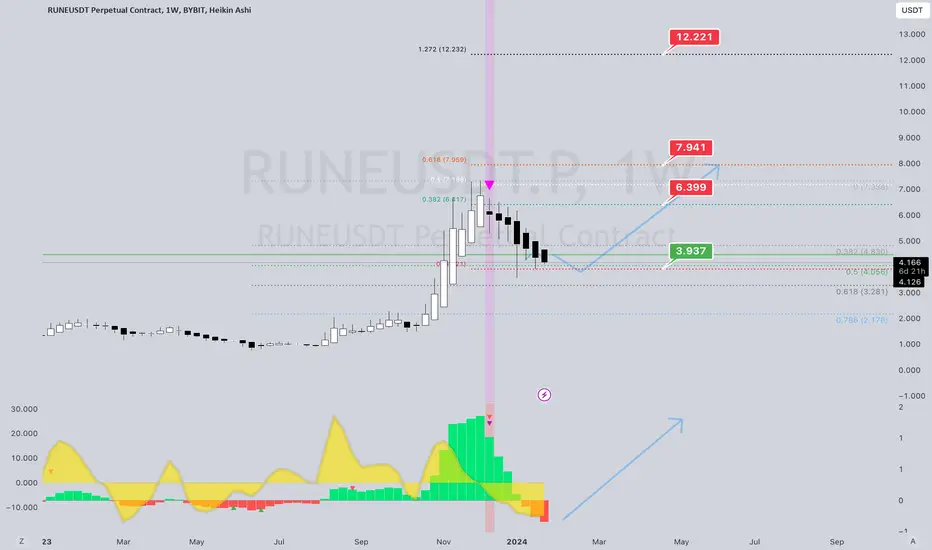
Rune Long Term AnalysisRune (Thorchain) is pulling into my accumulation zone again. Any dips below 3.95 is a buy the dip.
3.95 to 3.57 zone is an accumulation zone. This is a weekly chart so we may be in sideways and down trend a little while before we bounce.