RUNE WHAT NEXT?!!👀 ThorChain Today Analysis💎Rune is gearing up for an intriguing move. It's currently following a descending channel as resistance and is likely preparing for an upward shift.
💎 Previously, we noticed that demand turned into supply, resulting in a significant price drop. Currently, we have an order block in the 4-hour timeframe, and it's likely that the price will reach this level and initiate a bullish move.
💎 An interesting observation is the price rejection after grabbing liquidity at the OB. However, caution is advised as there's another OB below that the price might mitigate before initiating a bullish move.
💎 If a daily candle closes as a rejection with substantial volume at the OB, it could signal a good trading opportunity.
💎 In the dynamic world of crypto, staying informed and adaptable is key. Stay tuned for more updates and enjoy your trading journey
Thorchain

Retracement on THORChain after its strong bullish move?After a very impressive performance of +120% in 12 days, RUNE is now showing some signs of weakness, with sell signals on the Strength Reversion (BSR), while the Rainbow Score (BRS) is approaching the red zone. We could possibly look for an entry-level buy around the $1.15 level, before continuing the upward trend.

Rune - 1H major fallThe Rune price failed to achieve a higher high and even registered a lower low.
As a result, I'm anticipating a significant downtrend which is a pullback in the higher time frames.

RUNEUSD Major bullish break-out above the 1 year pattern.THORChain (RUNEUSD) broke above the top (Lower Highs trend-line) of the 1 year Falling Wedge pattern (since the August 11 2022). This is a major bullish break-out, considering that the price also broke above not just the 1D MA200 (orange trend-line) but also the 1W MA50 (red trend-line) for the first time since April 26 2022.
As long as the 1.7250 - 1.9750 Resistance Zone holds, we expect a better buy opportunity back on the 0.382 Fibonacci retracement level assuming the 1D MA50 (blue trend-line) supports. The long-term target is 3.15000 (Resistance 3).
-------------------------------------------------------------------------------
** Please LIKE 👍, FOLLOW ✅, SHARE 🙌 and COMMENT ✍ if you enjoy this idea! Also share your ideas and charts in the comments section below! **
-------------------------------------------------------------------------------
💸💸💸💸💸💸
👇 👇 👇 👇 👇 👇

Rune Thorchain RUNEUSDTPrice is at 2.5 yr old support level.
Projected targets are up there.
I will further breakdown this trade in trade update section
dont miss those moves.
GL

RUNE longRUNE broke trough the descending trendline. Asset broke trough the resistance level. Bullish movement to resistance level at 1.95 is expected to happen.

RUNE buy midtermI bought RUNE on a breakdown of the 1.5 zone. Stops are hidden under 1.38, a longer stop at 1.3. And the profit targets according to the chart markup 1.66 and 1.8.
Support for the author subscribe ✅ and start rocket 🚀.
Good luck and profits to all.

Long Term Investment on RUNERUNE is currently down for about 91% from its ATH. Meaning, if you buy now and it goes back to its ATH, you may have more than 10x profit.
Even if it doesn't go to its ATH, some possible scenarios:
- Closest support-turned resistance = 92% potential gain
- Closest weekly high = 5x profit potential
More supporting data from indicator to support this thesis =
Broke out 21 EMA
RSI shows bullish divergence

$RUNE - ShortHello my Fellow TraderZ,
I see some Change - of - Character #ALTS on shorter TF.
$Rune - waiting to hit my entry around $1.78 to drop further towards $1.4, so here is SHORT setup. You may adjust your SL according to your R:R .
Look at the breakout candle which is supported by Vol.
Keep tight , very tight SL, market may go for SL hunt.
CHEERS!!!

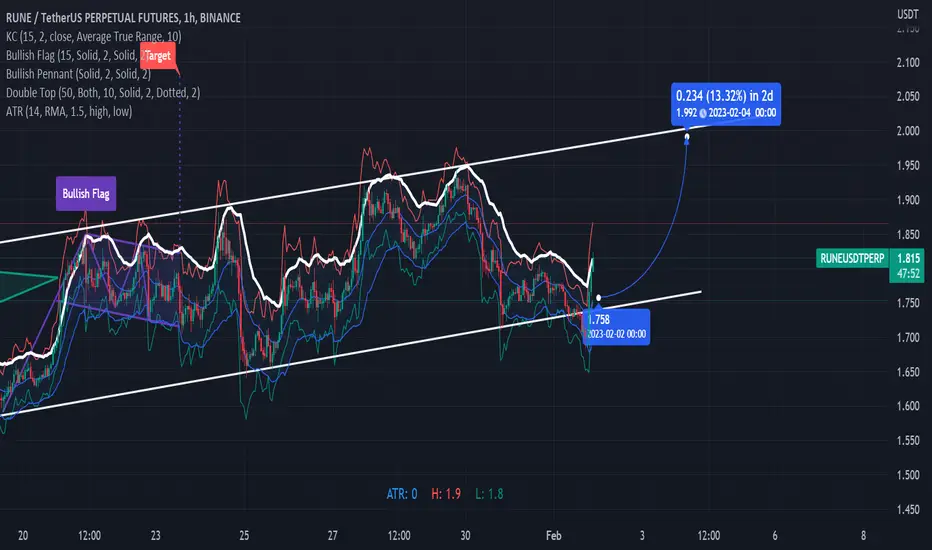
Rune bullish pennantTarget on this is 2.22 20% up from here we ar currently at a support and retest from current recent highs

Rune back on trackWe are back on track to go to 2 $ tight stoploss is just below the trendline i have drawn
a looser Sl would be the 1hr ATR @1.65
RUNE Thorchain Long spot trade I think RUNE will make a big move...very soon. And It's gonna run fast when it breaks daily (and weekly trend). If market continue to explode RUNE will be one of the really fast movers. In this spot trade I wouldn't wait for the trendbreak. I think the risk reward ratios is good as it is 1.6. RUNE is lagging compare to many other coins and I think its high probability that RUNE is one of the next coins that makes a big move - non financial advice.

THORChain - RUNEusdt notes on chartLet me know what you think, currently this is what I am seeing (notes on chart).
Ranging for now - will play this either way it decides to go.
Cheers

RUNE: Approaching ResistanceTHORchain (RUNE) technical analysis:
Trade setup : Trends are mixed. Wait for price to 1) break above $1.50 resistance, with upside potential to $2.00, or 2) pull back near $1.00 support for swing entry.
Trend : Uptrend on Short-Term basis, Neutral on Medium-Term basis and Downtrend on Long-Term basis.
Momentum is Mixed as MACD Line is below MACD Signal Line (Bearish) but RSI ~ 50 (Neutral).
Support and Resistance : Nearest Support Zone is $1.00. The nearest Resistance Zone is $1.50 (previous support), then $2.50, and $3.00.

RUNE / USDT PO3 formationThorchain (RUNE) long setup
* Possible PO3 formation
* Waiting for a retracement into the demand zone
* 80% position close recommended at first TP since we might get violated by bitcoin

RUNEUSD Is preparing a major bullish moveTHORChain (RUNEUSD) has been trading within a Channel Down pattern since the June 13 2022 (weekly) low inside a longer-term Bearish Megaphone since the May 17 (weekly) High. The 1W LMACD is close to forming a Bullish Cross. If completed, the short-term target will be the 1D MA200 (red trend-line). A break above the 1W MA50 will further be a bullish break-out signal, targeting the top (Lower Highs trend-line) of the Bearish Megaphone.
-------------------------------------------------------------------------------
** Please LIKE 👍, SUBSCRIBE ✅, SHARE 🙌 and COMMENT ✍ if you enjoy this idea! Also share your ideas and charts in the comments section below! This is best way to keep it relevant, support me, keep the content here free and allow the idea to reach as many people as possible. **
-------------------------------------------------------------------------------
You may also TELL ME 🙋♀️🙋♂️ in the comments section which symbol you want me to analyze next and on which time-frame. The one with the most posts will be published tomorrow! 👏🎁
-------------------------------------------------------------------------------
💸💸💸💸💸💸
👇 👇 👇 👇 👇 👇

Rune break trend - long term tradeRune looking good, long term. Weekly time frame completely oversold. Breaking trend 4h, 1d(?). Tomorrow I expect retest after break trend". I will DCA into the "yellow area" with no stop loss. If bitcoin is a fake out, again :(, I'm still happy with this trade.

RUNEBTC 1DRUNEBTC : RUNE has to break out of this descending wedge to get back into the ascending movement. From the top until today, RUNE BTC has devalued 84.67%. Moving averages imbedded downwards, but as the Ichimoku cloud works like a real magnet, I believe that we have already reached the bottom of this corrective and that RUNEBTC will now seek its first resistance in 0.0000865.

RUNE can be touch several TPsTHORChain is a decentralized liquidity protocol that allows users to easily exchange cryptocurrency assets across a range of networks without losing full custody of their assets in the process.
With THORChain, users can simply swap one asset for another in a permissionless setting, without needing to rely on order books to source liquidity. Instead, market prices are maintained through the ratio of assets in a pool (see automated market maker).
The native utility token of the THORChain platform is RUNE. This is used as the base currency in the THORChain ecosystem and is also used for platform governance and security as part of THORChain's Sybil resistance mechanisms — since THORChain nodes must commit a minimum of 1 million 300k RUNE to participate in its rotating consensus process.
THORChain was funded through an initial DEX offering (IDO) which launched through the Binance DEX in July 2019. Its single-chain chaosnet launched in April 2021, the multi-chain upgrade was launched in April 2021 and Mainnet is now live as of Jun 2022.
Buy setup
Entry : 1.33 - 1.59
SL : 1.145
TP1: 1.64
TP2: 1.7
TP3: 1.77
TP4: 1.85
TP5: 1.95
TP6: 2.1
TP7: 2.3
TP8: 2.5
TP9: 2.8
TP10: 3.2
TP11: 3.6
TP12: 4
TP13: 4.45
TP14: 4.9
TP15: 5.35
Spot or Future (1x, 2x, and 3x)
Run and enjoy it!
Follow me! Copy my trade!
TradeSetup_Reza

RUNE.Usdt (Y22.P3.Video1).Macro reviewHi All,
Just looking at when to average in on RUNE and also what possible setups we can plan for to go long or short.
Please give me a like and share.
Regards,
S.SAri

RUNE/USDT: On his way for bullish reversal---- Mid-term Analysis for the next coming 4 weeks to 3 months - Daily on Daily Chart (LIN)-------
RUNE/USDT: On his way for bullish reversal
Context
- The Global Crypto market leads by BTC and ETH reversed a new bullish trend - RUNE for now is still lagging versus ETH
- We are watching at 3,25/3,77 area to bypassed to extend the bullish recovery in progress
- Watch 2.00 as key support
Previous analysis : 18/08/2022 :
Market configuration
- Graphical Elements :
Graphical Resistance = 3,25/3,77 & 8,35 & 13,50
Graphical Support = 2,00
- Mathematical Indicators:
EMA ( Exp Moving averages) are now support at 2,69 = Bullish / Neutral
RSI indicator (below) is now above 50% area = Bullish
- Elliot & Harmonic Wave (Fibonacci):
Fibonacci Target E (B) has been already reached = 1, 42
Fibonacci resistance of the wave in progress = 3,25/3,77
Fibonacci support of the wave E (B)(max extension) = 1,42
Fibonacci Bullish Target = 5,48 & 6,25 (auto-similar move)
Conclusion
Preferred case => AS long as 2,00 remain support, we are looking at buy the dips in the buying area in order to challenged 3,25/3,77 and surpass this zone to confirm a bullish reversal towards 5,48 in a first step

RUNE/USDT: about to triggered significant recovery---- Mid-term Analysis for the next coming 4 weeks to 3 months - Daily on Daily Chart (LIN)-------
RUNE/USDT: about to triggered significant recovery
Context
The Global Crypto market leads by BTC and ETH is still evolving within a bearish market configuration. Like the others digital assets RUNE has been suffering about negative global market situation which should be ended with the rrecent bounce on going on ETH surpassing 1440
Previous analysis : 08/06/2022 :
Market configuration
- Graphical Elements :
Graphical Resistance = 3,25 & 8,35 & 13,50
Graphical Support = 1,62
- Mathematical Indicators:
EMA ( Exp Moving averages) are capping the market at 3,25 = Bearish / Neutral
RSI indicator (below) is bouncing off key support and challenge 50% area = Bullish
- Elliot & Harmonic Wave (Fibonacci):
Fibonacci Target E (B) has been already reached = 1,60/1,40
Fibonacci resistance of the wave in progress = 3,25
Fibonacci support of the wave E (B)(max extension) = 1,09
Fibonacci Bullish Target = 8,35 & 6,25 (auto-similar move)
Conclusion
Preferred case => Regarding the mid-term element, RUNE is still offering a good opportunity to play a continuation of the recovery on going - we adjust the key support 1,62, bypassing 3,25 the bullish recovery will be defenitly confirm offering opportunity to add the exposure on this Token

RUNEusdt analysisEverything is clear in the chart
According to my previous analysis, which was done in a simple way
This is also located on the roof of the channel
**This is an analysis, do not consider it for buying and selling**
