EU Prints Three Black Crows!FX:EURUSD has printed a strong Triple Candlestick Pattern called Three Black Crows after having made a 50% Retracement of the failed Higher High @ 1.1407.
This 50% Retracement found price testing a Previous Low and Resistance Zone where price now has broken a Previous Level of Structure being Support and is now on its way up to Retest this Break!
If Price is able to Retrace back to the Level of Structure @ ( 1.1336 - 1.1340 ) and shows signs of Resistance, this could deliver Short opportunities to take Price down to the Next Levels of Support @ 1.131 & 1.126!
Three Black Crows

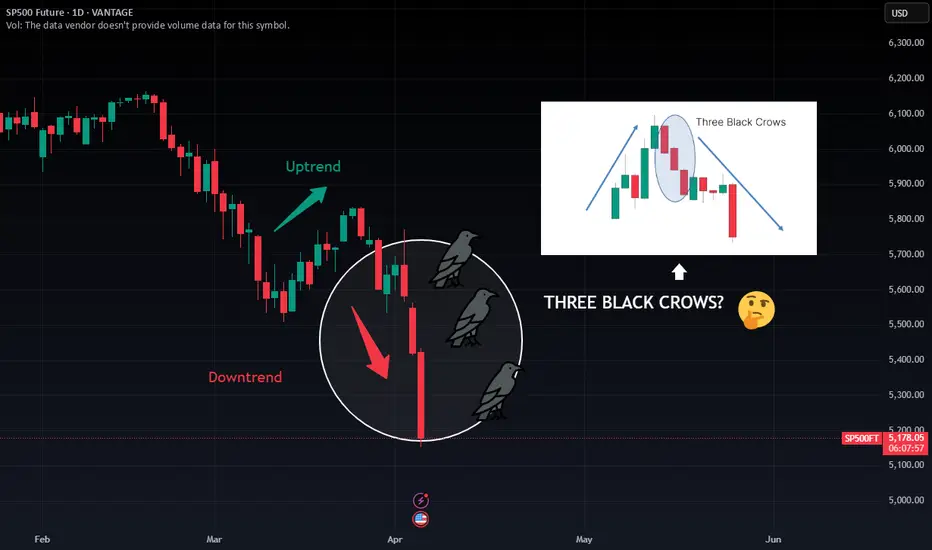
Are These the Three Black Crows Signaling More Pain Ahead? The S&P 500 has just printed three consecutive long-bodied red candles following a brief uptrend. This classic "Three Black Crows" formation could be a powerful bearish reversal signal—one that historically hints at a deeper correction on the horizon.
📊 What does this pattern mean?
Appears after an uptrend or rally.
Consists of 3 bearish candles closing near their lows.
Suggests strong seller control and trend reversal potential.
🔍 Current context:
The S&P is already under heavy pressure from macroeconomic and geopolitical concerns.
This pattern adds further bearish sentiment, especially if we see continued follow-through on volume.
🚨 If confirmed, we could be looking at the continuation of a larger downtrend. But remember: confirmation is key. Watch closely how price reacts in the next 1–2 sessions.
🧠 Do you see this as a real warning—or just a pause before the next leg up?
#SP500 #ThreeBlackCrows #CandlestickPatterns #BearishSignal #TechnicalAnalysis
The Three Black Crows Pattern: Trading PrinciplesThe Three Black Crows Pattern: Trading Principles
Various candlestick and chart patterns indicate potential market reversals. One such formation is the three black crows pattern that indicates a potential bearish reversal in the price of an asset. You can find three black crows stock, commodity, and forex patterns. This FXOpen article will help you understand how such a pattern is formed, explaining how it can be used to spot trading opportunities in the market and demonstrating live trading examples.
What Are the Three Black Crows?
The three black crows is a bearish candlestick pattern used in technical analysis to signal a potential reversal of an uptrend. It consists of three consecutive long bearish candlesticks that occur after a strong upward trend. The pattern suggests that the momentum has shifted from buyers to sellers, indicating that a downtrend could be about to begin.
Key Characteristics:
- Three Consecutive Bearish Candles: The pattern is composed of three long bearish candlesticks that open within the body of the previous candle and close near their lows.
- Appears After an Uptrend: The pattern typically forms after a prolonged uptrend, signalling a potential shift in market sentiment.
- Declining Price with Minimal Wicks: The candles should ideally have small upper and lower wicks, showing that the sellers controlled the market throughout the session.
- Steady Decline: Each candlestick in the pattern opens higher than the previous candle’s close but then reverses to close lower.
Psychological Interpretation
The pattern reflects a growing bearish sentiment among traders. Each successive bearish candlestick suggests that sellers are taking over, and buying pressure is weakening. This gradual increase in selling activity is often interpreted as a sign that the market could be heading for a downturn.
How Can You Trade the Three Black Crows Chart Pattern?
The three black crows formation has general trading rules. They can be modified depending on the timeframe, market volatility, and risk tolerance.
Entry
Once the formation is confirmed with the third long red candle and additional indicators, traders enter a short position below its low.
Take Profit
The pattern doesn’t provide specific take-profit targets. Usually, traders use other technical indicators and strong support levels to determine a suitable take-profit point. Some traders set the take-profit order with regard to the risk-reward ratio, say 1:2 or 1:3.
Stop Loss
The theory states that a stop-loss order can be placed above the first candlestick’s high to potentially limit losses. Moreover, it should be based on the trader's risk tolerance and trading approach.
Live Market Example
The above example shows the formation of the three black crows’ pattern on a weekly chart of the EUR/USD pair. When the pattern formed, the relative strength index had just left the overbought zone, confirming a potential trend reversal. A trader could go short after the third long bearish candle at 1.42550 and place a stop loss near above the first pattern’s candle (at 1.51763). The profit target could be set at the next important support level of 1.23378. It took six months for the price to reach the target level.
Practical Trading Strategies Using the Three Black Crows Pattern
Now, let’s look at two specific 3 black crows trading strategies.
MACD Strategy
The combination of the three black crows candlestick pattern and the MACD crossover offers traders a strong signal of a bearish reversal after a bullish movement. The three black crows formation suggests weakening bullish momentum, while the MACD crossover confirms the shift in momentum from buyers to sellers. Together, these indicators increase the likelihood of a sustained downtrend, offering an opportunity for traders to enter the market with greater confidence.
Entry
- Traders observe a bearish MACD crossover within a few candles of the three black crows, either just before, during, or just after.
- Both conditions (pattern completion and MACD crossover) are typically met by the close of the third candle, signalling a potential opportunity for a sell trade.
Stop Loss
- Stop losses might be placed just beyond the swing point before the three black crows pattern to potentially protect against false signals.
Take Profit
- Traders often set take-profit targets at a risk-reward ratio, such as 1:2 or 1:3, to lock in potential returns.
- Alternatively, profits might be taken at key support levels where the price may reverse.
- Another option might be to exit the trade upon observing a bullish MACD crossover, signalling the end of the downtrend.
HMA Strategy
Using two hull moving averages (HMA), one set to 20 and the other to 50, provides traders with an extra filter to confirm that a downtrend is beginning following the three black crows pattern. The three black crows indicate a potential bearish reversal, but a cross of the 20-period HMA below the 50-period HMA helps confirm the strength of the downtrend. HMAs are used as they are more responsive to trend shifts than other moving averages.
Entry
- Traders look for a bearish crossover where the 20 HMA crosses below the 50 HMA within a few candles of the three black crows.
- Both the pattern and the HMA crossover typically confirm the start of a downtrend, allowing traders to enter a short position.
Stop Loss
- Stop losses might be set just above the swing high before the pattern.
- Alternatively, they might be placed above one of the HMAs, depending on the trader’s risk tolerance and desired level of protection.
Take Profit
- Take-profit targets might be based on a risk-reward ratio, such as 1:2 or 1:3.
- Traders may also take profits at a known support level where price reversal is likely.
- Another potential exit point is when the HMAs cross over again, signalling the end of the trend.
Three Black Crows vs Three White Soldiers
The three white soldiers candlestick pattern is the opposite of the three black crows. It is a bullish reversal setup that traders commonly use to identify the potential end of a prior downtrend and the start of an uptrend. It consists of three consecutive long bullish candlesticks with highs and lows higher than the previous ones and with little or no wicks. It suggests that the buyers have taken control of the market and that the price will likely continue rising. The candles together create a formation that resembles three soldiers marching in a bullish direction.
This formation is usually considered a strong bullish signal when it appears after a prolonged downtrend, in contrast to the three black crows formation, which indicates a strong potential bearish reversal. Traders often use it as an indication to enter long positions, with a stop-loss order placed near the bottom of the pattern.
Confirmation Tools
Confirmation tools can help traders ensure that the 3 black crows candlestick pattern signals a true bearish reversal rather than a short-term pullback. Here are some key tools to consider when confirming the pattern:
- Volume Increase: A spike in selling volume during the formation of the three black crows can confirm heightened pressure and a stronger likelihood of a trend reversal.
- Momentum Indicators: Tools like the Relative Strength Index (RSI), MACD, or a Stochastic Oscillator can show a shift in momentum. An overbought RSI, a bearish MACD crossover, or bearish Stochastic divergence may reinforce the bearish signal.
- Support Level Break: Watch for a break below a key support level after the three black crows form. This can further validate the downtrend, indicating that sellers are gaining control.
- Bearish Candlestick Patterns: Additional bearish patterns, such as engulfing or dark cloud cover, emerging after the three black crows, can reinforce the likelihood of a sustained downtrend.
- Moving Averages: A cross of a short-term MA below a long-term MA can offer further confirmation of a bearish reversal.
Common Mistakes When Trading the Three Black Crows Pattern
In 3 black crows trading, it's common to make several mistakes that may lead to poor results or false signals. Here are key pitfalls to watch out for:
- Ignoring Volume: Failing to check for a rise in volume during the formation of the three black crows can lead to misinterpreting the pattern. Low volume may indicate weak selling pressure and an unreliable signal.
- Trading Without Confirmation: Jumping into a trade as soon as the pattern forms without using additional confirmation tools like momentum indicators or support breaks can increase the risk of a false reversal.
- Overlooking Market Context: The three crows candlestick pattern works in specific conditions. If the pattern appears in a sideways or range-bound market, it may not signal a true trend reversal, leading to misinterpretation.
- Setting Tight Stop-Losses: Placing stop-loss orders too close to the first candlestick’s high can result in early exit due to market noise. Proper risk management with room for fluctuations is essential.
- Neglecting Trend Strength: Ignoring the strength of the prior uptrend may lead to premature trades. The pattern is believed to be the most effective after a prolonged uptrend; using it in weak trends can result in false signals.
Final Thoughts
The three black crows pattern is a powerful bearish reversal signal that can help traders identify potential downtrends after a sustained uptrend. By understanding its formation, confirming the pattern with additional technical indicators, and implementing sound risk management strategies, traders can incorporate this pattern into their trading plans. However, as with any trading strategy, patience and proper confirmation are key to avoiding false signals.
Once you have practised identifying the black crows, consider opening an FXOpen account to start your trading journey!
FAQ
What Do 3 Black Crows Mean in Trading?
The 3 black crows’ meaning refers to a candlestick pattern signalling a bearish reversal. It consists of three consecutive long bearish candlesticks following an uptrend, indicating that sellers are taking control of the market. This pattern suggests a potential shift in momentum from bullish to bearish, meaning the price is likely to decline further as selling pressure increases.
What Do Three Black Crows Indicate?
The 3 black crows’ candlestick formation, after a prolonged uptrend, indicates a potential downside reversal. It means that sellers are taking control, and the price will likely trade downwards.
What Is the Success Rate of the 3 Black Crows?
The success rate of the three black crows pattern varies depending on market conditions, timeframe, and confirmation tools used. While it is generally considered a reliable bearish reversal signal, traders often use volume, momentum indicators, and support level breaks to confirm the pattern and improve success rates.
What Is the Meaning of Identical Three Crows?
The identical three crows is a variation of the traditional pattern. In this case, the three bearish candles open at the close of the previous candlestick, showing even stronger bearish pressure. This variation suggests that sellers are overwhelming buyers consistently, signalling an even more pronounced reversal.
How Do You Trade Three Black Crows?
To trade the 3 black crows pattern, traders wait for confirmation of a bearish reversal after the three consecutive down candles in an uptrend. They enter a short position once the pattern is completed and confirmed by additional indicators like increased volume or a break below support. They may place a stop-loss order above the high of the first candle and target key support levels below for profit-taking. Traders always manage risk carefully by using stop-losses and monitoring market conditions.
Are Three Black Crows Bullish?
No, the three black crows pattern is not bullish; it is a bearish candlestick pattern. It signals a potential reversal from an uptrend to a downtrend, indicating that selling pressure is starting to overwhelm buying pressure.
Trade on TradingView with FXOpen. Consider opening an account and access over 700 markets with tight spreads from 0.0 pips and low commissions from $1.50 per lot.
This article represents the opinion of the Companies operating under the FXOpen brand only. It is not to be construed as an offer, solicitation, or recommendation with respect to products and services provided by the Companies operating under the FXOpen brand, nor is it to be considered financial advice.

Strategy 2025. BTC Airless Scenario Below $100'000 Choking PointThe crypto market is flashing a worrying outlook for 2025, since a disappointing Santa Claus rally this year could deepen issues.
This is especially important if BTC will not be able to finish the year 2024 firmly above $100'000 per coin.
The financial market has had a tough week, but it might also be in store for a tough year in 2025.
The market is on track for its worst weeks over years after the Federal Reserve gave a hawkish forecast for interest rate cuts in 2025. But looking at the market's internals, it's clear that damage had been inflicted well before the Fed's Wednesday meeting—and the signal is a historic indicator of tough times ahead.
The number of stocks in Top Stock Club S&P 500 that are declining outpaced advancing stocks for 14 consecutive days on Thursday.
The advancing/declining data helps measure underlying participation in market moves, and the recent weakness signals that even though the S&P 500 is only off 4% from its record high, there's damage under the hood of the benchmark index.
This is evidenced by the equal-weighted S&P 500 index being off 7% from its record high.
According to Ed Clissold, chief US strategist at Ned Davis Research, the 14-day losing streak for the S&P 500's advance-decline line is the worst since October 15, 1978.
Clissold said 10-day losing streaks or more in advancing stocks relative to declining stocks can be a bad omen for future stock market returns.
While this scenario has only been triggered six times since 1972, it shows lackluster forward returns for the S&P 500. The index has printed an average six-month forward return of 0.1% after these 10-day breadth losing streaks flashed, compared to the typical 4.5% average gain seen during all periods.
"Studies with six cases hardly make for a strategy. But market tops have to start somewhere, and many begin with breadth divergences, or popular averages posting gains with few stocks participating," Clissold said.
Perhaps more telling for the stock market is whether it can stage a recovery as it heads into one of the most bullish seasonal periods of the year: the Santa Claus trading window.
If it can't, that would be telling, according to Clissold.
"A lack of a Santa Claus Rally would be concerning not only from a seasonal perspective, but it would allow breadth divergences to deepen," the strategist said.
Also concerning to Clissold is investor sentiment, which has flashed signs of extreme optimism since September. According to the research firm's internal crowd sentiment poll, it is in the seventh-longest stretch in the excessive optimism zone, based on data since 1995.
"Several surveys have reached what could be unsustainable levels," Clissold said, warning that any reversal in sentiment could be a warning sign for future market returns.
Ultimately, continued stock market weakness, especially in the internals, would suggest to Clissold that 2025 won't be as easy as 2024 for investors.
"If the stock market cannot rectify recent breadth divergences in the next few weeks, it would suggest our concerns about a more difficult 2025 could come to fruition," the strategist said.
Moreover, Dow Jones index has printed recently The Three Black Crows Bearish candlestick pattern, on weekly basis.
This is especially important, since mentioned above pattern is massively unwinding from Dow's all the history highs.
Previously this pattern has already appeared in TVC:DJI in November 2021 and lead to 20 percent decline in 2022 for Dow Jones Index and to more than 70 percent decline in BTC.
The Three Black Crows Bearish candlestick pattern also has appeared in Dow Jones Index in September, 2018 (lead to 18% decline) and in July, 2007 (lead to more than 50% decline).
The main technical graph represents a Choking Strategy for BTC in 2025, i.e. BTC airless scenario below $100'000 choking point.
The epic 52-week SMA breakthrough in BTC will definitely accelerate a decline at all.

American Homes 4 Rent: Monthly 3 Black Crows Channel BreakdownAMH has confirmed 3 Black Crows on the Monthly Timeframe and has cracked below an ascending channel and the 21SMA. I expect that we will get severe follow-through as both the Rental Sector and the Real Estate Industry in general continue their decline into the higher interest rate environment.

VOLKSWAGEN: Bull-trap? Potential formation of Three Black CrowsAfter Job openings, JOLTS data and macroeconomic data weakening in US; a potential formation of Three Black Crows on Daily graph of Volkswagen could be underway jeopardising the last 6 positive candles. Tomorrow's closing candle will confirm if the Three Black Crows take place and next week we will see whether the prophecy ("sell") takes place.

EURJPY | Bearish TrendAs this is following the lower low and lower highs pattern so the trend seems bearish and the last three candles also form three black crows so it is most likely to be a bearish trend.

USD JPY Bullish Trend Start. Bullish Candle Shows in Charts AfteOANDA:USDJPY USD JPY Bullish Trend Start. Bullish Candle Shows in Charts After Three Black Crows.

The Three Black Crows PatternThe Three Black Crows or as otherwise known Three Soldiers are a formation of price continuation showing how the bears are taking control over the bulls to reverse the trend as we can see here.
Price comes down buyers try to push it back up only to be reversed by sellers overpowering them so it falls back down the buyers try again but realise the bear is the almighty and with that last attempt they withdraw from the market causing a big sell off with a strong downward movement when just the bears remain
key points:
- last attempt of the bulls
- price goes up and bears push price down every time
- bears in control after a long uptrend shows prelude to sell

Selling CAD against YenA third possible lower high in a row, followed by breaking of fibonacci support level with strong bearish candlestick are a good entry point for bears in this trade

Gold Technical AnalysisHello Trader, Gold was running sideways very good time and now it's breakout also showing 3 black Crows candlestick pattern and decide to go short and 1:2. Good luck ☺

Is this "the three black crows" pattern?The three black crows candlestick pattern is considered a relatively reliable bearish reversal pattern.
Consisting of three consecutive bearish candles at the end of a bullish trend, the three black crows signals a shift of control from the bulls to the bears.
www.investopedia.com
So, Is this "the three black crows" pattern?
It's really looks like..

A look into the SPY: Are we sold on a full reversal yet?3Day Chart-
With 1 day left, the shadow of the candle kissed the 50 EMA. Even with a close ABOVE its previous candles close but BELOW its current candle shadow low this should be seen as bearish. This would print a Shooting Star. 444.39 would be the level to watch for this scenario.
3Day Chart
Bulls will want to see a close above the previous candles swing high at 446.46 at a minimum. Best case would be a close above the mid Feb swing high at 448 or better a close above the 50 EMA.
1Day Chart
March 14 22' there was a 50/200 EMA cross under. Since then there has been a bit of a rally. 4 days ago, the Daily candle printed above the 50 EMA and 2 days ago above the 200 EMA. In between a Doji printed, kissing both the 200 and 40 EMA signifying major uncertainty.
1 Day Chart
If the Daily candle prints at or below 445.50(ish) then we could view this as 1 Black Crow. My best gut feel says its this happens, then selling pressure may be more likely than not to continue through Friday.
A note to bulls: this scenario would be OK as long as the .786 Fib is ultimately respected. A healthy .382 is a more likely retracement, but keep in mind the worst case break point at 423.24. Any retracement is fine as long as a HIGHER low is set. Those sweet spots IMO are the above 2 I mentioned.
1 Day Chart
Ultimately, bulls want a close over the 200 EMA and bears under the 200 EMA.
Here is a link to the 1 Week and 1 Month chart, comments below.
Weekly Chart
The SPY weekly candle should close above previous swing high candle body resistance around 449.
Weekly Chart
453 is marked as resistance, as seen created locally in November. Nov-Jan it acted as support, but now broken it is viewed as resistance. This break of support to resistance happened in a breakout(down) of a major ascending level of supported created April 2020 as the market was recovering from the "covid" crash.
Weekly Chart
Best case for bulls: EOW rally to close the current weekly candle above 453.
Best case for bears would be a weekly close with no lower shadow around 440 or a close below the 50 EMA
A close of around 445-446 would print a Doji, meaning indecision in which patience is advised.
Monthly Chart
Best case for bulls is a close above its previous monthly candle high at 451. This would print a Bullish Engulfing candle.
Best case for bears is a close below 423. 423 is a level back in May 21 that acted as resistance and helped create a Doji (indecision). This setup would look similar to a 3 Black Crowes reversal pattern
The market has most certainly shown bullish signs, but IMHO this is a critical juncture that will shows us further signs of market recovery or turmoil.

XAUUSD ShortXAUUSD completed a bearish Gartley pattern before going bearish until meeting our Support I would ordinarily buy from this point but spotting the three black crows at this point, I see an opportunity to sell further. I anticipate the market making a slight bullish pullback, creating a bearish flag to confirm our three black crows signal. I will patiently wait for it and enter a sell to take my profit around 1768

3 Black Crows on the Weekly at the PCZ of a Bearish SharkMACD Bearish Divergence, RSI Bearish Divergence, Weekly 3 Black Crows, at a Bearish Shark PCZ.
I think it can go much lower than my specified 61.8 target but a 34% decline is plenty profitable to make this a great trade.

CHFJPY, 4hr tf, three black crows setup
It was very clear price holding below the 123.50 resistance for quite some time.
Notice that three black crows candles appeared and right now retracing for 61.8 fibonacci retracement.
This could be a good area for entering sell.
Sell CHFJPY 123.20
Stop loss 123.70
Take profit 121.00 (4.4R)
Use only 1-2% risk
Good luck


$DOGE forming Three Black Crows on the dailyThis is a bearish formation. If we can make a big green daily candle to form the Rising Three pattern then it will be bullish.
However as the price is now, I am expecting lower.

BTC lost over $60 Billion mkt cap in 24 hours- China's crackdownAny feedback and suggestions would help in further improving the analysis! If you find the analysis useful, please like and share our ideas with the community. Keep supporting :)
Quick glance: As of now, BTCUSD seems to be on under massive selling pressure Traders are looking closely at the $30k level.
Our previous analysis on BTCUSD correctly predicted the slippery slope BTC was at, and should the support be broken, there could be a massive downtrend.
Market in the last 24hrs
China's regulations on Bitcoin miners seem to have a major toll on the entire crypto spectrum. BTC is under serious selling pressure.
Today’s Trend analysis
Three black crows is a major bearish pattern, formed by three adjacent candles. This pattern is usually a reliable confirmation of the bear market, wherein each candle closes below the previous candle. As of now, $30k mark would a strong psychological support zone for BTCUSD.
Price volatility remained extremely high at approximately 12.8%, with the day's range between $31700.00 — $35763.80.
Price at the time of publishing: $32535.84
BTC's market cap: $610.85 Billion
Out of 11 Oscillator indicators, 6 are neutral, and 1 indicates to a bearish outlook, and 4 point to a 'BUY' signal.
Out of 15 Moving average indicators, 13 indicate a bearish outlook, 1 is 'NEUTRAL' and 1 gives out a bullish view.
Indicator summary is giving a 'SELL' signal on BTCUSD .
Volumes have remained high in the past 24 hours.
----------------------------------------------------------------------------------------
The analysis is based on signals from 26 technical indicators, out of which 15 are moving averages and the remaining 11 are oscillators. These indicator values are calculated using 4Hr candles.
Note: Above analysis would hold true if we do not encounter a sudden jump in trade volume .
----------------------------------------------------------------------------------------
Any feedback and suggestions would help in further improving the analysis! If you find the analysis useful, please like and share our ideas with the community. Keep supporting :)


