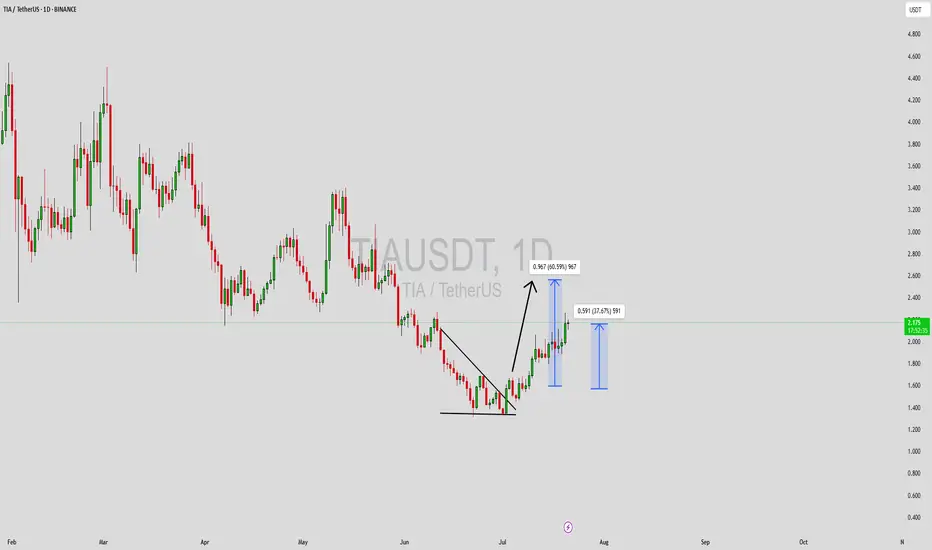
TIAUSDT Forming Falling WedgeTIAUSDT has recently shown a bullish breakout from a falling wedge structure on the daily timeframe—a pattern known for its strong reversal signals. This move is supported by rising trading volume, signaling fresh momentum entering the market. With current price action pushing higher, the short-term upside potential targets lie around the 50% to 60% gain zone, which aligns well with past resistance levels marked on the chart. This upward shift also breaks the series of lower highs that previously dominated the chart, suggesting a confirmed trend reversal.
From a broader perspective, TIA has built strong fundamentals as part of the Cosmos ecosystem, which gives it significant long-term value potential. The recent surge in price has been accompanied by increased community activity and mentions across social media platforms, which may indicate growing investor sentiment and renewed project interest. The consolidation phase appears to have ended, and TIA is now pushing for a sustained bullish leg.
Market participants should keep an eye on support retests and breakout validations as the rally progresses. The measured target after this wedge breakout puts TIA in a good position for a strong Q3 performance. With macro tailwinds favoring altcoins and mid-cap blockchain projects regaining traction, TIA could be setting up for an extended upward move.
✅ Show your support by hitting the like button and
✅ Leaving a comment below! (What is You opinion about this Coin)
Your feedback and engagement keep me inspired to share more insightful market analysis with you!
TIABTC
Free signal hello friends👋
🌟Considering that the price reaches an important weekly support, the price is expected to grow, so you can enter into a transaction with risk and capital management and move to the specified goals.
🔥Follow us for more signals🔥
*Trade safely with us*

TIA Coin: Unlock 118% Profit Potential (1D)From the point where we placed the red arrow on the chart, it appears the TIA correction has begun.
Despite the current bullish market trend, TIA has not yet experienced a pump, and it seems the price hasn't reached its bottom yet. This correction seems to follow a large, time-consuming diamond-shaped diametric pattern, and we are currently in the early or middle stages of wave G.
Recently, the price lost a minor trendline, marked with a red dotted line, indicating that wave G might continue its path.
We have identified a low-risk buy zone on the chart for catching the next bullish wave in TIA. We are targeting buy/long positions in this zone.
Price targets are clearly indicated on the chart.
A daily candle close below the invalidation level will invalidate this analysis and suggest a potential reversal.
invalidation level: 1.089$
For risk management, please don't forget stop loss and capital management
When we reach the first target, save some profit and then change the stop to entry
Comment if you have any questions
Thank You

TIA SIGNALSHello friends
As you can see, this currency has a beautiful chart and the technical analysis we did is that if the valid resistance is broken, we can open a buy trade with capital and risk management and move with it to the specified targets.
*Trade safely with us*

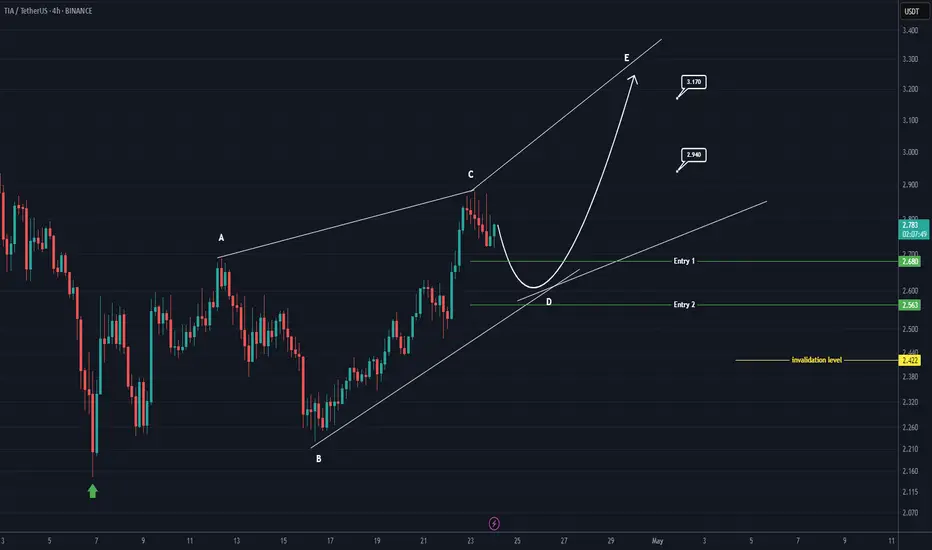
TIA buy/long setup (4H)TIA seems to be in the middle of a bullish pattern, especially as it has reclaimed key levels and there is an order block located below the current price.
Two entry points are marked on the chart, indicating where we’re looking for buy/long positions.
Targets are specified on the image.
A 4-hour candle closing below the invalidation level would invalidate this setup.
For risk management, please don't forget stop loss and capital management
When we reach the first target, save some profit and then change the stop to entry
Comment if you have any questions
Thank You
#TIA/USDT#TIA
The price is moving within a descending channel on the 1-hour frame, adhering well to it, and is heading towards a strong breakout and retest.
We are experiencing a rebound from the lower boundary of the descending channel, which is support at 2.18.
We are experiencing a downtrend on the RSI indicator that is about to be broken and retested, supporting the upward trend.
We are looking for stability above the 100 Moving Average.
Entry price: 2.27
First target: 2.36
Second target: 2.42
Third target: 2.53

TIAUSDT Bottoming Out?TIAUSDT Technical analysis update
TIAUSDT has been trading within the longest descending channel. The price has once again touched the channel support and also retested the November 2023 support level or bottom. A strong bounce from this zone is likely, and we could potentially see a 100–150% move from the current level.

Is TIA About to Break Down Hard? Traders Beware Before It’s lateYello, Paradisers! Did you catch the recent bullish rally on #TIAUSDT? It’s been delivering solid gains over the past couple of days, giving traders reason to celebrate. But what if we told you that this rally might just be setting up a classic trap—one that smart money is already preparing to take advantage of? The technical structure forming right now suggests a high probability of a reversal, and if you’re not paying attention, you might end up on the wrong side of the move.
💎#TIAUSDT, at the core of setup is a developing a probable Bearish Gartley pattern. These harmonic structures are rare but extremely powerful when they align with multiple technical confirmations and that’s exactly what we’re seeing here. With the recent move upward, TIAUSDT appears to have completed its C leg, a critical part of the Gartley structure. This sets the stage for the D leg, which typically completes much lower. The price reacted strongly from the C leg area, which also happens to line up perfectly with a previous local high adding even more probability to the resistance at that zone.
💎This resistance isn't just horizontal there's a dynamic element at play as well. The 21-period EMA on multiple timeframes is currently acting as a ceiling for price action. When a key moving average starts rejecting price repeatedly, it often signals that the current trend is losing steam and this dynamic resistance only strengthens the case for a downside move from here.
💎Looking deeper, the bearish signs are confirmed by momentum indicators. The RSI on lower timeframes is not only overbought but also showing clear signs of bearish divergence. This divergence occurs when the price continues to make higher highs while RSI starts forming lower highs a classic sign that momentum is weakening. It’s one of the more reliable early warnings that a reversal may be near. In this case, RSI is flashing that warning now, suggesting that buyers may soon run out of fuel.
💎If this bearish probable scenario plays out as expected, the first key level to watch on the downside sits around the 3.278 zone. This minor support may offer a temporary bounce, but if the D leg of the Gartley is to be completed, we could see even deeper price action. This makes the current area extremely sensitive—any weakness from bulls could trigger a fast move downward.
💎However, no pattern is complete without an invalidation level, and for the Bearish Gartley, that comes in around the 3.805 resistance zone. A strong, sustained close above this level would invalidate the bearish setup and signal renewed bullish momentum. Until then, all technical signals are pointing toward caution, especially for those still riding long positions without a tight risk plan.
Stay alert, Paradisers. The market is about to decide. This is a textbook moment where emotions can take over, and late buyers get punished for chasing green candles. That’s why, we are playing it safe right now. If you want to be consistently profitable, you need to be extremely patient and always wait only for the best, highest probability trading opportunities.
MyCryptoParadise
iFeel the success🌴

TIAUSDT – Weak at Key Weekly Level! More Downside Ahead?TIAUSDT – Weak at Key Weekly Level! More Downside Ahead?
“This chart looks weak—momentum favors the downside. But is there a bounce first?”
🔥 Key Insights:
✅ Sitting at a Critical Weekly Zone – A breakdown here could be brutal.
✅ Momentum Looks Bearish – No real strength from buyers.
✅ Only Considering Low-Risk Buys – Fibonacci Green Zone (0-0.5) is the ideal cheap area.
💡 The Smart Plan:
Looking for a Break & Retest Downward – If support cracks, shorts become clear.
Small Risk Buys from the Fibonacci Zone – Only for aggressive traders.
CDV & Volume Profile Must Confirm – No buyers? No trade.
“Weak price action, heavy risk. Only the right levels matter here—watch closely!” 📉🔥⚠️
A tiny part of my runners;
🌊 WAVESUSDT.P: Demand Zone Potential
🟣 UNIUSDT.P: Long-Term Trade
🔵 XRPUSDT.P: Entry Zones
🔗 LINKUSDT.P: Follow The River
📈 BTCUSDT.P: Two Key Demand Zones

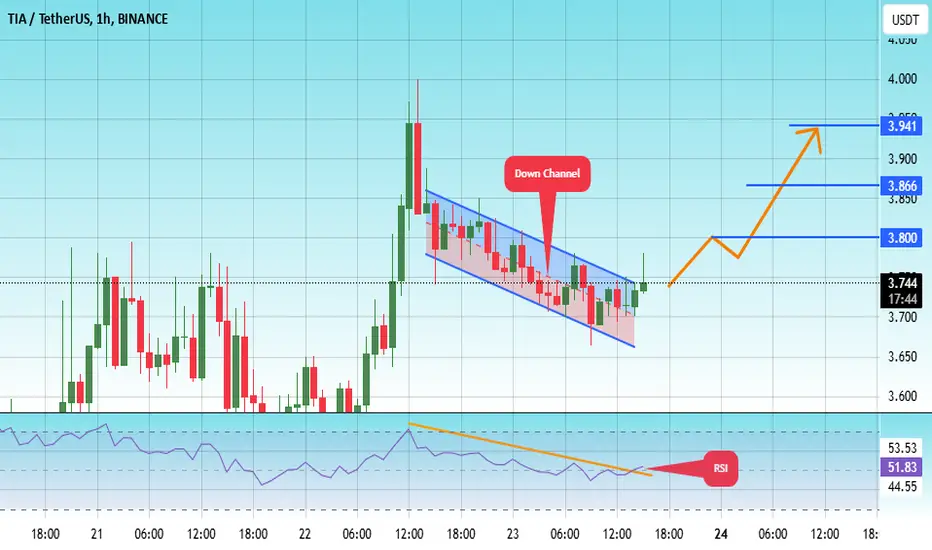
#TIA/USDT#TIA
The price is moving in a descending channel on the 1-hour frame and is adhering to it well and is heading to break it upwards strongly and retest it
We have a bounce from the lower limit of the descending channel, this support is at a price of 3.67
We have a downtrend on the RSI indicator that is about to break and retest, which supports the rise
We have a trend to stabilize above the Moving Average 100
Entry price 3.74
First target 3.80
Second target 3.86
Third target 3.92
$TIA: Ready to Breakout After 5 Months of Consolidation?
I think LSE:TIA is finally primed for a breakout after spending the last five months consolidating in the tight $4–$6 range. The lows have been respected multiple times, and we're now seeing the buildup of potential for a significant move.
I’m eyeing an entry at $4.85, which would be a perfect spot to load up if we get a retrace into that zone. If it does dip back there, it's a max bid scenario for me.
However, I'm also prepared to jump in a bit higher if needed, especially if I get left behind as the breakout gains momentum. It's a balancing act between waiting for the perfect entry and not missing out on the move entirely.
Let’s see how it plays out—I'm keeping a close watch!

#TIA/USDT#TIA
The price is moving in a descending channel on the 1-hour frame and is expected to continue upwards
We have a trend to stabilize above the moving average 100 again
We have a descending trend on the RSI indicator that supports the rise by breaking it upwards
We have a support area at the lower limit of the channel at a price of 4.33
Entry price 4.72
First target 4.90
Second target 5.12
Third target 5.47

#TIA/USDT#TIA
The price is moving in a descending channel on the 1-hour frame and is expected to continue upwards
We have a trend to stabilize above the moving average 100 again
We have a descending trend on the RSI indicator that supports the rise by breaking it upwards
We have a support area at the lower limit of the channel at a price of 4.65
Entry price 4.70
First target 4.91
Second target 5.10
Third target 5.32

TIA NEW UPDATE (1D)Due to tokenomics issues, TIA dropped along with the market.
Now, we’ve prepared a new update for TIA. At each target, secure a portion of your profit and lock it in.
By analyzing the TIA chart, it appears to be forming a large diametric pattern.
This diametric is likely part of wave D.
It seems TIA intends to form wave E of this diametric.
As long as the green zone is maintained, it can move towards the targets.
The targets are marked on the chart.
Closing a daily candle below the invalidation level will invalidate this analysis.
For risk management, please don't forget stop loss and capital management
Comment if you have any questions
Thank You

TIA still seems to be bullishFrom where we placed the green arrow on the chart, it seems that TIA has entered a bullish diamond diametric, and is currently in the middle of wave D.
We expect wave D to complete and wave E to start from the green range.
Targets are $10, $12, and $14.
A daily candle closing below the invalidation level will invalidate this analysis.
For risk management, please don't forget stop loss and capital management
When we reach the first target, save some profit and then change the stop to entry
Comment if you have any questions
Thank You

TradeCityPro | TIAUSDT Analysis Battling a Daily Resistance👋 Welcome to the TradeCityPro channel!
Let’s analyze this promising coin on a day when Bitcoin has set a new all-time high (ATH). As always, we'll break it down step by step to find optimal entry points. 🚀
🏆 Bitcoin Overview
Before diving into TIA, let’s take a quick look at Bitcoin
BTC recently broke its price ATH and achieved a market cap of $2.04 trillion, surpassing Saudi Aramco and securing the 7th position globally in asset rankings.
Following the breakout above 98,857, Bitcoin’s dominance surged, directing attention back to BTC. If dominance remains strong, expect focus to stay on BTC or strong-performing pairs like SUI.
📅 Weekly Time Frame
TIA is a newly listed coin with no prior bull market experience but has achieved a solid market cap, ranking 44th overall.
After an 80% drop, it ranged in a short box before breaking the 6.268 resistance alongside a trendline break.
Currently, TIA faces resistance at 8.783, and an RSI overbought condition post-breakout could trigger a sharp rally towards 11.794.
On a pullback, consider support at 6.268 , After 8.783 breakout, confirm the move with lower time frame analysis for safer entries.
🕐 Daily Time Frame
The range between 4.221–6.268 shows a consistent pattern of higher lows, indicating growing buyer presence.
After closing above the trendline, TIA now struggles at 8.373, with a potential breakout signaling further upward momentum.
For safer entries, wait for a daily close above 8.373, setting your stop-loss at 4.67 , The main breakout point was 6.268, but entering now carries slightly higher risk.
⏳ 4-Hour Time Frame
TIA is ranging between 7.189–8.740, forming clear triggers for futures trades , As long as 7.189 holds, focus remains on a breakout above 8.740 for long positions.
📈 Long Position Trigger
After a clear break of 8.740, ideally with increased volume and momentum.
📉 Short Position Trigger
Avoid shorting during a bull run. Wait patiently for new long opportunities.
💡 BTC Pair Insight
The TIA/BTC pair has shown downward pressure, but recent green candles indicate a bounce from key support.
breakout above 0.00001061 could mark the start of a bullish trend, making it a strong altcoin candidate for growth.
🎯 Conclusion
TIA is showing promising bullish potential, but patience and strategic entries are key. Focus on breaking 8.783 and monitor volume for confirmation. Let the market work in your favor while you position for the next major move!
📝 Final Thoughts
Stay calm, trade wisely, and let's capture the market's best opportunities!
This analysis reflects our opinions and is not financial advice.
Share your thoughts in the comments, and don’t forget to share this analysis with your friends! ❤️

#TIA/USDT Ready to go higher#TIA
The price is moving in a descending channel on the 4-hour frame and sticking to it well
We have a bounce from the lower limit of the descending channel, this support is at 7.30
We have a downtrend on the RSI indicator that is about to be broken, which supports the rise
We have a trend to stabilize above the 100 moving average
Entry price 8.64
First target 8.90
Second target 9.50
Third target 10.02

TIAUSDT - great targets aheadweekly chart displays breakout the descending channel since about 12 months!!
it's just begaining .. big move did'nt started yet
target around 60$🎯

#TIA/USDT#TIA
The price is moving in a descending channel on the 4-hour frame and it was broken upwards
We have a trend to stabilize above the moving average 100
We have an upward trend on the RSI indicator that supports the rise by breaking it upwards
We have a major support area in green at a price of 4.50
Entry price 5.40
First target 6.33
Second target 6.60
Third target 7.60

TIAUSDT Breaks Resistance: Strong Bullish Move AheadTIAUSDT Technical analysis update
TIAUSDT has been consolidating for the past 160 days, repeatedly testing the trend resistance line. Today, the price broke above the resistance line on the daily chart and crossed above the 100 EMA. A strong bullish move is anticipated in the coming days.
Buy zone : Below $6.30
Stop loss : $5.32
Take Profit 1: $7.10
Take Profit 2: $8.50
Take Profit 3: $11.85

TIATIA / USDT
After long correction period and another 5 months accumulation many people lost confidence in TIA but it finally brokeout
Its flying above our entry by 24% but looking at chart its just brokeout and long Journey still ahead
Best of wishes

TIA is at the bottom of the channel!The TIA is at the bottom of the major channel, it has broken the minor channel and is the bottom of the major channel.
We also have a bullish iCH on the chart, which gives us a bullish view.
A trigger line has also been created on the chart, which will break soon.
The mid-term and long-term targets are clear on the chart.
Supply range is very important for us
Closing a daily candle below the invalidation level will violate this analysis
invalidation level: 4.08
Do not enter the position without capital management and stop setting
Comment if you have any questions
thank you

#TIA/USDT#TIA
The price is moving in a descending channel on the 1-hour frame and is sticking to it well
We have a bounce from the lower limit of the descending channel and we are now touching this support at a price of 4.20
We have a downtrend and the RSI indicator is about to break, which supports the rise
We have a trend to stabilize above the moving average 100
Entry price 4.20
First target 4.63
Second target 4.98
Third target 4.43
