TIA Holding Support – Break Above $2.20 Could Trigger Big MoveLast week, I mentioned that TIA could be preparing for a move and that buying dips around $1.75 might be a good opportunity.
Well, price dropped exactly into that support zone, bounced slightly, and is now consolidating, which could be the calm before the next wave.
________________________________________
📌 Here’s what I’m watching:
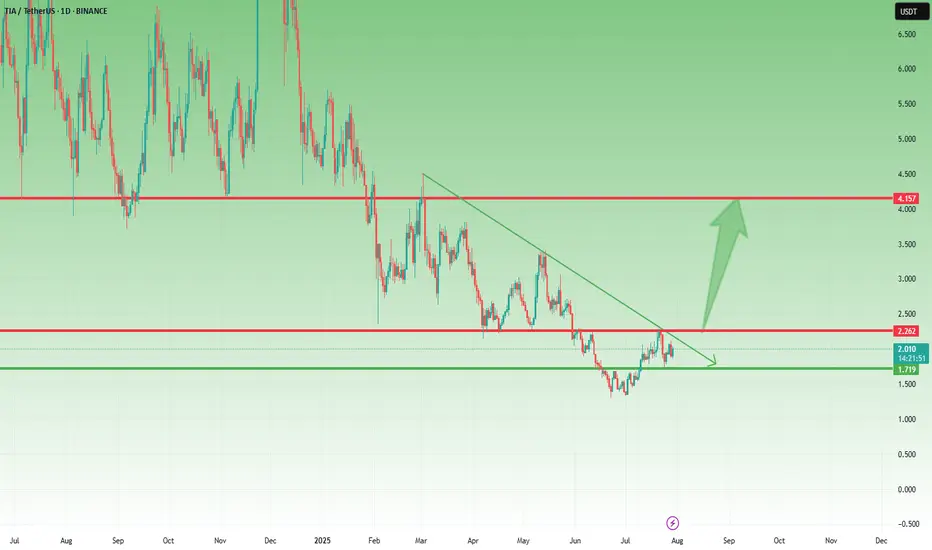
• The $2.10–$2.20 zone is now a confluence resistance area (horizontal + descending pressure)
• A break and daily close above this level could trigger a strong leg up, with the next major target around $4.00
________________________________________
📈 Bias remains bullish
As long as $1.70 holds, this setup stays valid, and dips continue to be buyable.
________________________________________
🎯 Trading Plan:
• Looking to buy dips toward $1.80–1.85
• Acceleration expected only above $2.20
• Bearish invalidation only below $1.70
________________________________________
Conclusion:
TIA is respecting structure perfectly. If it breaks above $2.20, we could be looking at a potential double in price toward $4.
TIAUSD
Will #TIA Continue to Soar or Bears Can Halt it? Must Watch Yello, Paradisers! Will we see #TIA continue to soar from here, or can bears halt its momentum? Let's see the latest setup of #Celestia to see what's going to happen:
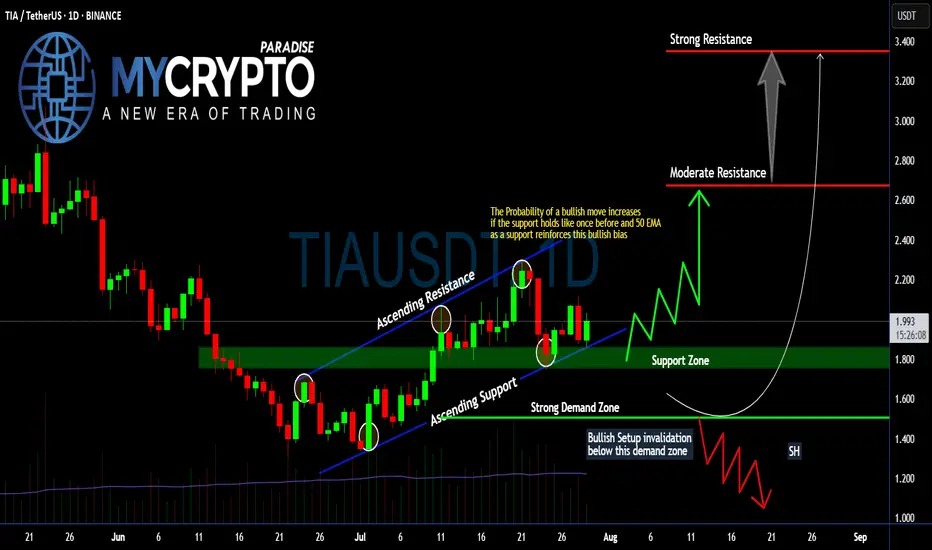
💎Following a textbook ascending channel structure, #TIAUSDT has been respecting both its ascending resistance and ascending support, with each touchpoint confirming trader participation and growing confidence. Price is currently holding above the 50 EMA and within a crucial support zone between $1.80–$1.90—an area that previously triggered a strong impulse move to the upside.
💎The probability of a bullish continuation increases significantly as long as the #TIAUSD respects this support zone and the 50 EMA acts as dynamic support. If this level continues to hold, we expect a move toward the moderate resistance around $2.67, the key area where sellers previously stepped in aggressively.
💎But that’s not all—if bulls gain momentum and break above $2.67 with strong volume, the next price magnet becomes the $3.34 level, where strong resistance and high-volume node overlap. This level would likely be the point of exhaustion unless broader market momentum takes over.
💎However, caution is critical here. If price breaks below the strong demand zone around $1.507, this invalidates the bullish structure entirely and opens the door for a swift move down toward the $1.20–$1.00 range, where a potential market shakeout could occur. Remember, a failed bullish setup often becomes a powerful bear trap for undisciplined traders.
Stay patient, Paradisers. Let the breakout confirm, and only then do we strike with conviction.
MyCryptoParadise
iFeel the success🌴
TIA/USDT – Major Breakout Incoming? Reversal in Sight!🔍 Full Technical Analysis (1D Timeframe):
TIA/USDT is approaching a critical turning point after experiencing a strong downtrend since December 2024. The chart clearly forms a Falling Wedge pattern — a classic bullish reversal signal known for explosive breakouts when confirmed.
Currently, the price is testing a key confluence zone around $2.00 – $2.30, where:
A major horizontal resistance meets
A long-term descending trendline (yellow), acting as dynamic resistance since the last local high.
🚀 Bullish Scenario (Confirmed Breakout):
If TIA successfully breaks and closes above the $2.30 – $2.78 range with strong volume, it could trigger a major mid-term rally. The potential upside targets are aligned with previous structural resistance levels:
Target Resistance Level
🎯 Target 1 $3.34
🎯 Target 2 $4.17
🎯 Target 3 $5.41
🎯 Target 4 $6.61
🎯 Target 5 (Extended) $8.87 – $9.28 (Major Weekly Supply Zone)
✅ Additional Bullish Confirmation: A volume breakout + RSI moving into the 50–70 zone would strengthen the bullish case.
🛑 Bearish Scenario (Fake Breakout Risk):
If the price gets rejected again from the descending trendline and fails to close above $2.00, the bearish pressure may push the price back toward key demand zones:
First support zone: $1.60
Last major defense: $1.31 (the current swing low)
This could lead to a double bottom structure before any meaningful trend reversal happens.
📐 Pattern Breakdown:
Pattern: Falling Wedge Breakout Pattern
Duration: Over 7 months of consolidation below trendline
Risk-to-Reward Potential: Highly favorable if breakout is confirmed
🧠 Market Sentiment:
Many altcoins are showing early signs of bottoming out and accumulation.
TIA could become a breakout leader in the next wave if it clears the current resistance cluster.
Expect momentum traders to join in once a solid bullish candle closes above the wedge.
✅ Conclusion:
TIA/USDT is at a technically golden level. A breakout from this falling wedge structure could ignite a multi-stage rally. However, caution is advised: wait for a confirmed breakout and manage risk in case of a failed breakout attempt.
#TIAUSDT #CryptoBreakout #FallingWedge #AltcoinRally #ReversalPattern #BreakoutTrade #CryptoTA #MomentumTrade #Altseason #TechnicalAnalysis #CryptoSignals

Free signal hello friends👋
🌟Considering that the price reaches an important weekly support, the price is expected to grow, so you can enter into a transaction with risk and capital management and move to the specified goals.
🔥Follow us for more signals🔥
*Trade safely with us*

TIA Coin: Unlock 118% Profit Potential (1D)From the point where we placed the red arrow on the chart, it appears the TIA correction has begun.
Despite the current bullish market trend, TIA has not yet experienced a pump, and it seems the price hasn't reached its bottom yet. This correction seems to follow a large, time-consuming diamond-shaped diametric pattern, and we are currently in the early or middle stages of wave G.
Recently, the price lost a minor trendline, marked with a red dotted line, indicating that wave G might continue its path.
We have identified a low-risk buy zone on the chart for catching the next bullish wave in TIA. We are targeting buy/long positions in this zone.
Price targets are clearly indicated on the chart.
A daily candle close below the invalidation level will invalidate this analysis and suggest a potential reversal.
invalidation level: 1.089$
For risk management, please don't forget stop loss and capital management
When we reach the first target, save some profit and then change the stop to entry
Comment if you have any questions
Thank You

Tia bearish short term.To me the view is pretty clear.
* The purpose of my graphic drawings is purely educational.
* What i write here is not an investment advice. Please do your own research before investing in any asset.
* Never take my personal opinions as investment advice, you may lose your money.
Celestia TIA price analysis#TIA price currently looks “weak,” gradually sliding down and updating lows.
A “ray of hope” may be a repeat of the fractal behavior of the OKX:TIAUSDT price from last year, when, after the third slight update of the low, the price began to rebound upward.
If we take this fractal as a basis, then in the near future, the price of the #Celestia token should rebound to $4, followed by a correction and continued growth to $5.55.
_____________________
Did you like our analysis? Leave a comment, like, and follow to get more

TIAUSDT 1D AnalysisTIA ~ 1D Analysis
#TIA Buy again from here if you still have confidence in this coin with a short term target of at least 15%+ from here.

TIAUSDT | Still No Buyers—Maintaining a Bearish Outlook
TIAUSDT has been one of today’s top volume movers, with 24‑hour trading volume hitting around $63.6 million—a 48.7 percent jump from the previous day.
Yet despite this surge, genuine buying interest remains absent, and price action is unable to find footing.
🔴 First Resistance: The Red Box
• This red box marks the first major zone where sellers have consistently defended price.
• Any rally into this area should be treated as a short opportunity—provided you see clear lower‑time‑frame breakdowns and CDV confirming sell‑side dominance.
📉 How Much Further Could It Fall?
I can’t predict the exact bottom—no one can. What I do know is that until buyers step up, downward pressure is likely to continue. Watch for each bounce to stall at resistance and use that as your cue to enter or add to shorts.
🤝 Key Trading Rules to Follow
Confirmation is Everything
Wait for a clean LTF breakdown inside the red box, with CDV divergence or rising sell volume. No confirmation means no trade.
Adaptive Bias
I will not insist on my short idea. If TIA breaks above this red box with volume and then retests it as support, I will shift to a long bias. Otherwise, my view stays bearish.
Risk Management
Keep stops just above the red box. Trade only what the market shows you—never chase.
This approach is built on watching real order flow and market behavior, not guessing. If you want to align yourself with a strategy that filters out noise and focuses on high‑probability setups, you’re in the right place.
📌I keep my charts clean and simple because I believe clarity leads to better decisions.
📌My approach is built on years of experience and a solid track record. I don’t claim to know it all but I’m confident in my ability to spot high-probability setups.
📌If you would like to learn how to use the heatmap, cumulative volume delta and volume footprint techniques that I use below to determine very accurate demand regions, you can send me a private message. I help anyone who wants it completely free of charge.
🔑I have a long list of my proven technique below:
🎯 ZENUSDT.P: Patience & Profitability | %230 Reaction from the Sniper Entry
🐶 DOGEUSDT.P: Next Move
🎨 RENDERUSDT.P: Opportunity of the Month
💎 ETHUSDT.P: Where to Retrace
🟢 BNBUSDT.P: Potential Surge
📊 BTC Dominance: Reaction Zone
🌊 WAVESUSDT.P: Demand Zone Potential
🟣 UNIUSDT.P: Long-Term Trade
🔵 XRPUSDT.P: Entry Zones
🔗 LINKUSDT.P: Follow The River
📈 BTCUSDT.P: Two Key Demand Zones
🟩 POLUSDT: Bullish Momentum
🌟 PENDLEUSDT.P: Where Opportunity Meets Precision
🔥 BTCUSDT.P: Liquidation of Highly Leveraged Longs
🌊 SOLUSDT.P: SOL's Dip - Your Opportunity
🐸 1000PEPEUSDT.P: Prime Bounce Zone Unlocked
🚀 ETHUSDT.P: Set to Explode - Don't Miss This Game Changer
🤖 IQUSDT: Smart Plan
⚡️ PONDUSDT: A Trade Not Taken Is Better Than a Losing One
💼 STMXUSDT: 2 Buying Areas
🐢 TURBOUSDT: Buy Zones and Buyer Presence
🌍 ICPUSDT.P: Massive Upside Potential | Check the Trade Update For Seeing Results
🟠 IDEXUSDT: Spot Buy Area | %26 Profit if You Trade with MSB
📌 USUALUSDT: Buyers Are Active + %70 Profit in Total
🌟 FORTHUSDT: Sniper Entry +%26 Reaction
🐳 QKCUSDT: Sniper Entry +%57 Reaction
📊 BTC.D: Retest of Key Area Highly Likely
📊 XNOUSDT %80 Reaction with a Simple Blue Box!
📊 BELUSDT Amazing %120 Reaction!
I stopped adding to the list because it's kinda tiring to add 5-10 charts in every move but you can check my profile and see that it goes on..

TIA NEXT TERMMy scenario is like this.
* The purpose of my graphic drawings is purely educational.
* What i write here is not an investment advice. Please do your own research before investing in any asset.
* Never take my personal opinions as investment advice, you may lose your money.

The key is whether it can rise above 3.211
Hello, traders.
If you "Follow", you can always get new information quickly.
Have a nice day today.
-------------------------------------
(TIAUSDT 1D chart)
The basic trading strategy is to buy near the HA-Low indicator and sell near the HA-High indicator.
However, if the HA-Low indicator falls, there is a possibility of a stepwise downtrend, and if the HA-High indicator rises, there is a possibility of a stepwise uptrend.
Therefore, when the HA-Low indicator is first created, the probability of rising is higher than the probability of falling, and when the HA-High indicator is first created, the probability of falling is higher than the probability of rising.
If the HA-Low indicator rises and then meets the previously formed HA-Low indicator again, the probability of falling is higher.
On the contrary, the HA-High indicator has a higher probability of rising.
You should check the movement of the chart with these characteristics in mind.
However, you should comprehensively judge the correlation between the OBV indicator and the StochRSI indicator.
-
From a trend perspective, since the M-Signal of the current 1D chart is < M-Signal of the 1W chart, you can see that it is in a reverse arrangement.
Therefore, when trading in a reverse arrangement, it is recommended to trade for a short period of time using day trading.
Therefore, if it shows a price that rises above the M-Signal indicator of the 1W chart and maintains the price, it is highly likely that a trend will be formed that can be traded.
In other words, when looking at the current price position, it can be seen that it can be traded for a short period of time or longer only when it rises above 3.211 and shows support.
-
Since the HA-Low indicator is formed at the 2.490 point, the price must be maintained above this point.
If not, there is a possibility of an additional stepwise downtrend, so you should think about a countermeasure for this.
-
If the average purchase price is significantly higher than the current price, you should not buy too much and increase your investment ratio.
In this case, it is better to trade with a relaxed mind and faithfully follow the basic trading strategy.
However, it is better to trade by increasing the number of coins (tokens) corresponding to the profit realization method and increasing the number of coins (tokens).
In other words, trade by purchase price.
If you bought 100 USDT at the current price of 2.840, you should sell 100 USDT when the price rises and shows resistance at 3.211.
In this case, only the number of coins (tokens) corresponding to the profit will remain.
At this time, you should be careful about the transaction fee.
Since you have to sell the purchase amount including the transaction fee, the actual selling amount when you place an order is not 100 USDT.
The transaction fee rate varies depending on the exchange.
For example, if the trading fee is 0.1%, you can trade 100USDT - (100USDT x 0.2%) = 99.8USDT.
-
Thank you for reading to the end.
I hope you have a successful trade.
--------------------------------------------------
- Here is an explanation of the big picture.
(3-year bull market, 1-year bear market pattern)
(3-year bull market, 1-year bear market pattern)
I will explain the details again when the bear market starts.
------------------------------------------------------

TIA SIGNALSHello friends
As you can see, this currency has a beautiful chart and the technical analysis we did is that if the valid resistance is broken, we can open a buy trade with capital and risk management and move with it to the specified targets.
*Trade safely with us*

TIA Secondary trend. Wedge. Reversal zone. 09 05 2025Logarithm. Time frame 3 days. The price dropped to the listing price zone, namely the level of 2.309. In this zone, the decline stops and the transition to consolidation - sideways. The decline formed a full-fledged descending wedge. This is a bullish pattern in cases of a breakthrough of its resistance (in most cases).
When working with such hype cryptocurrencies, observe money management. Now in “investors” more than 200-300 X, who always sell without loading the glass, but somewhere more, and somewhere less, under the market as a whole. I would advise you to work with the wedge that has now formed and "down-to-earth", logical goals, after exiting it and the consolidation zone.
Main trend. TIA (Celestia) Main trend. Maximum targets of the cycle. XXL+10Х
Line chart of prices, for clarity of the secondary trend, the descending wedge and the potential reversal zone.

TIAUSD just broke above the 5-month Falling Wedge!Celestia (TIAUSD) made a major bullish break-out today as not only did it break above its 1D MA50 (blue trend-line) but also above the 5-month Lower Highs trend-line (December 06 2024), which is the top of the Falling Wedge pattern!
With the 1D RSI also on Higher Lows, this bullish momentum is targeting the 2.0 Fibonacci extension level at 4.000, which is where contact with the 1D MA200 (orange trend-line) is expected to be made.
-------------------------------------------------------------------------------
** Please LIKE 👍, FOLLOW ✅, SHARE 🙌 and COMMENT ✍ if you enjoy this idea! Also share your ideas and charts in the comments section below! This is best way to keep it relevant, support us, keep the content here free and allow the idea to reach as many people as possible. **
-------------------------------------------------------------------------------
💸💸💸💸💸💸
👇 👇 👇 👇 👇 👇

TIAUSDT 2D AnalysisTIA ~ 2D Analysis
#TIA Buy gradually from here if you still have confidence in this coin with a short term target of at least 20%+ from here

TIAUSDT 1D AnalysisTIA ~ 1D Analysis
#TIA Buy after successfully penetrating this resistant line with a short -term target of at least 10%+.

TIAUSDT — 2025 Technical RoadmapTIAUSDT — Daily Technical Roadmap
🕞 60-Second Read
Trend on the 1-D chart is still structurally bearish ; price (spot 2.865 USDT) just carved a higher-low off the 2.44 vector block and is knocking on the Yearly BC lid. Two large upside voids now beckon.
Hot-Zone #1 – 2.60 → 2.44 (1 D + 4 H vector demand): stacked fresh liquidity, 9-15 % under spot.
Hot-Zone #2 – 2.985 (Yearly BC): first breaker & range cap, only 4 % above; a daily close above here opens the air-pocket to 4.27.
Hot-Zone #3 – 4.932 → 6.947 (Yearly Pivot ↔ Yearly TC): macro supply shelf guarding a 72-142 % rally window.
💧 Liquidity & Imbalance
Daily vector 7.85 (77 % fill-rate inside 60 d).
Stacked 4 H vectors 9.86 / 9.83 = 2.5 % supply shelf.
Demand stack 2.69 – 2.44 only 18 d old.
⚡ Volatility & Momentum
GMMA Z-Score curling up from −2 σ; short ribbons still under long ribbons – suggests pause, not reversal.
🎲 Probability Dashboard
HTF Structure −3
Liquidity voids +1
Momentum −1
Vol-regime 0
Bear / Neutral / Bull ≈ 42 % / 33 % / 25 %
📈 Trade Playbook
Strategy 1
1. Layered Limit Grid – Aggressive Counter-Trend Long
Entry layers (size %):
2.60 – 40 % of your allocated TIAUSDT size
2.44 – 30 %
2.05 – 20 %
1.90 – 10 %
SL = 1.75 (≈ 1 ATR below extreme demand)
TP ladder:
2.985 – 25 % off-load
3.722 – 25 %
4.932 – 25 %
6.947 – 15 %
7.849 – 10 %
Weighted R:R ≈ 4.3
Strategy 2
2. Layered Limit Grid – Conservative Breakout Long
Trigger: daily close > 3.722 (Yearly Low reclaim), then place grid orders.
Entry layers (size %):
3.75 – 40 %
3.55 – 30 %
3.25 – 20 %
2.985 – 10 %
SL = 2.70
TP ladder:
4.932 – 30 %
6.947 – 30 %
7.849 – 20 %
9.860 – 15 %
12.432 – 5 %
Weighted R:R ≈ 3.8
⚠️ Risk Radar
Low-float token – slippage risk on size.
Macro event: FOMC 1 May → volatility spike possible.
BTC options IV rising – spill-over risk to alts.
Price must conquer 2.985 to open the upside magnet trail toward 4.27 → 4.93. Failure keeps 2.60 → 1.90 demand stack in play before any durable markup.
Not financial advice – do your own research & manage risk.

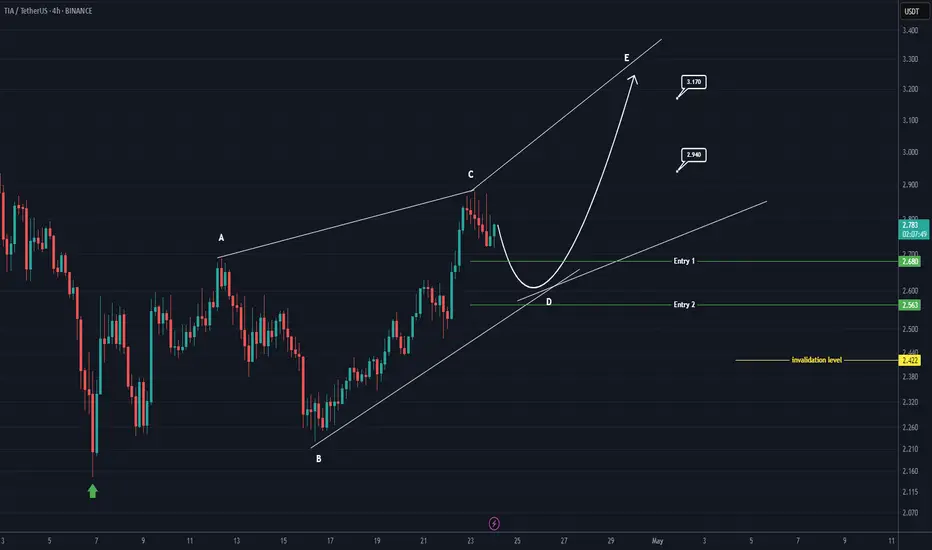
TIA buy/long setup (4H)TIA seems to be in the middle of a bullish pattern, especially as it has reclaimed key levels and there is an order block located below the current price.
Two entry points are marked on the chart, indicating where we’re looking for buy/long positions.
Targets are specified on the image.
A 4-hour candle closing below the invalidation level would invalidate this setup.
For risk management, please don't forget stop loss and capital management
When we reach the first target, save some profit and then change the stop to entry
Comment if you have any questions
Thank You
#TIA/USDT#TIA
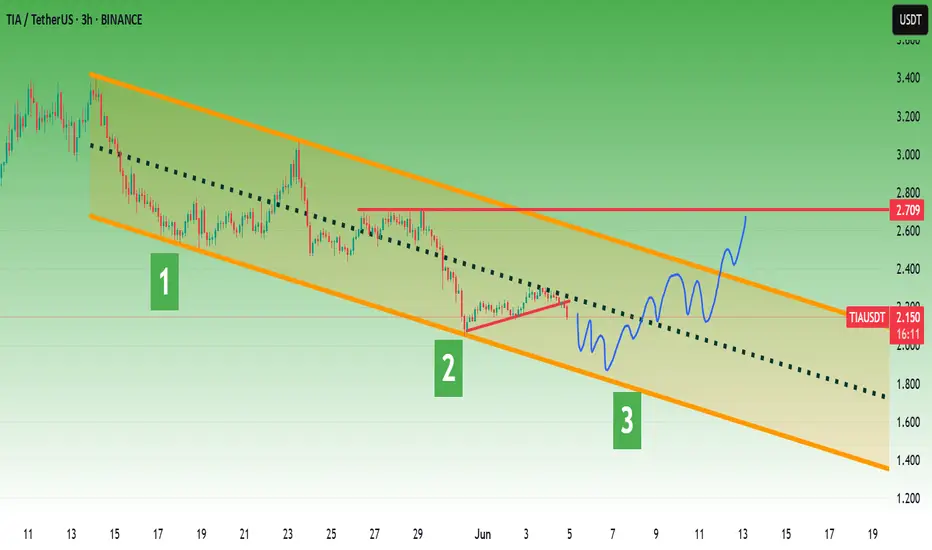
The price is moving within a descending channel on the 1-hour frame, adhering well to it, and is heading towards a strong breakout and retest.
We are experiencing a rebound from the lower boundary of the descending channel, which is support at 2.18.
We are experiencing a downtrend on the RSI indicator that is about to be broken and retested, supporting the upward trend.
We are looking for stability above the 100 Moving Average.
Entry price: 2.27
First target: 2.36
Second target: 2.42
Third target: 2.53

TIAUSDT Bottoming Out?TIAUSDT Technical analysis update
TIAUSDT has been trading within the longest descending channel. The price has once again touched the channel support and also retested the November 2023 support level or bottom. A strong bounce from this zone is likely, and we could potentially see a 100–150% move from the current level.

Is TIA About to Break Down Hard? Traders Beware Before It’s lateYello, Paradisers! Did you catch the recent bullish rally on #TIAUSDT? It’s been delivering solid gains over the past couple of days, giving traders reason to celebrate. But what if we told you that this rally might just be setting up a classic trap—one that smart money is already preparing to take advantage of? The technical structure forming right now suggests a high probability of a reversal, and if you’re not paying attention, you might end up on the wrong side of the move.
💎#TIAUSDT, at the core of setup is a developing a probable Bearish Gartley pattern. These harmonic structures are rare but extremely powerful when they align with multiple technical confirmations and that’s exactly what we’re seeing here. With the recent move upward, TIAUSDT appears to have completed its C leg, a critical part of the Gartley structure. This sets the stage for the D leg, which typically completes much lower. The price reacted strongly from the C leg area, which also happens to line up perfectly with a previous local high adding even more probability to the resistance at that zone.
💎This resistance isn't just horizontal there's a dynamic element at play as well. The 21-period EMA on multiple timeframes is currently acting as a ceiling for price action. When a key moving average starts rejecting price repeatedly, it often signals that the current trend is losing steam and this dynamic resistance only strengthens the case for a downside move from here.
💎Looking deeper, the bearish signs are confirmed by momentum indicators. The RSI on lower timeframes is not only overbought but also showing clear signs of bearish divergence. This divergence occurs when the price continues to make higher highs while RSI starts forming lower highs a classic sign that momentum is weakening. It’s one of the more reliable early warnings that a reversal may be near. In this case, RSI is flashing that warning now, suggesting that buyers may soon run out of fuel.
💎If this bearish probable scenario plays out as expected, the first key level to watch on the downside sits around the 3.278 zone. This minor support may offer a temporary bounce, but if the D leg of the Gartley is to be completed, we could see even deeper price action. This makes the current area extremely sensitive—any weakness from bulls could trigger a fast move downward.
💎However, no pattern is complete without an invalidation level, and for the Bearish Gartley, that comes in around the 3.805 resistance zone. A strong, sustained close above this level would invalidate the bearish setup and signal renewed bullish momentum. Until then, all technical signals are pointing toward caution, especially for those still riding long positions without a tight risk plan.
Stay alert, Paradisers. The market is about to decide. This is a textbook moment where emotions can take over, and late buyers get punished for chasing green candles. That’s why, we are playing it safe right now. If you want to be consistently profitable, you need to be extremely patient and always wait only for the best, highest probability trading opportunities.
MyCryptoParadise
iFeel the success🌴

TIAUSDT 3DTIA ~ 3D Analysis
#TIA Key support that must be maintained. Loss of this support, LSE:TIA price will be more depressed lower.

TIA | Next Altcoin to MOON ??In the macro, it's clear that TIA has been in a downward trend for an extended period of time. This means, it's a great place to buy - because the bullish cycle is up next.
In an earlier publication, I made an update about the ideal entry point for TIA:
A key indicator to watch is the daily timeframe, when the price begins to trade ABOVE the moving averages - that's when you'll have the first confirmation of a bullish turn around. It is a bullish sign to see the gradual higher lows.
Moving Averages:
