TIA | PERFECT Bottom??In the macro, it's clear that TIA has been in a downward trend for an extended period of time. This means, it's a great place to buy - because the bullish cycle is up next.
Trend based indicators are great to identify the immediate predominant pressure on the chart, in this case, bearish. A "Buy" signal in the weekly timeframe would be the first step in the right direction (reversal).
Trend Based Indicator:
Another key indicator to watch is the daily timeframe, when the price begins to trade ABOVE the moving averages - that's when you'll have the first confirmation of a bullish turn around.
Moving Averages:
______________________
BINANCE:TIAUSDT
TIAUSD

Breaking: $TIA Surges 17% Eyeing A Move to $5 The first modular blockchain network that enables anyone to easily deploy their own blockchain with minimal overhead by rethinking blockchain architecture from the ground up broke out of a falling wedge patten soaring 17% albeit the crypto market is highly volatile with CRYPTOCAP:BTC reclaiming the FWB:83K pivot.
Celestia Network Native token ( LSE:TIA ) has shocked the mainstream crypto market after breaking out of a falling wedge escaping the gasp of the support point holding it at the $2 zone.
With building momentum, LSE:TIA is eyeing a move to the $5 zone should it break the $4 resistant zone a move to the $5 target isn't far-fetched. With the Relative Strength Index (RSI) at 58, LSE:TIA is poised for a bullish run should the crypto market stabilize.
Celestia Price Live Data
The live Celestia price today is $3.74 USD with a 24-hour trading volume of $220,357,891 USD. Celestia is up 17.41% in the last 24 hours. with a live market cap of $2,091,803,371 USD. It has a circulating supply of 558,964,944 TIA coins and the max. supply is not available.

Celestia TIA price analysis🟣 For the second day in a row, the LSE:TIA price is showing growth
But would we risk buying OKX:TIAUSDT now - rather no than yes...
🟡 Above the orange trend line, purchases will be safer.
🟢 And during the $3 retest in the blue scenario, it's even safer)
Although, in the medium term, seeing #Celestia at $9 again is more than a realistic task.
_____________________
Did you like our analysis? Leave a comment, like, and follow to get more

#TIA/USDT#TIA
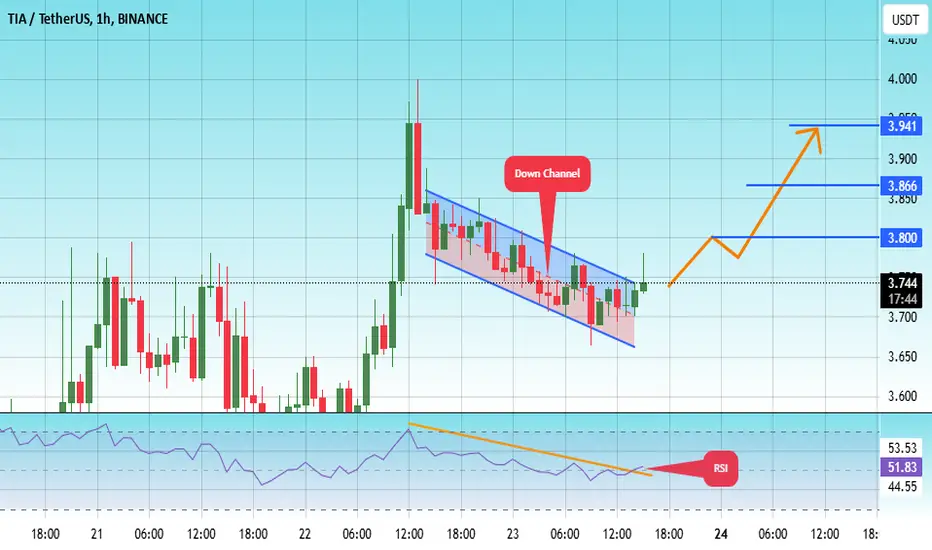
The price is moving in a descending channel on the 1-hour frame and is adhering to it well and is heading to break it upwards strongly and retest it
We have a bounce from the lower limit of the descending channel, this support is at a price of 3.67
We have a downtrend on the RSI indicator that is about to break and retest, which supports the rise
We have a trend to stabilize above the Moving Average 100
Entry price 3.74
First target 3.80
Second target 3.86
Third target 3.92
TIA target $5.64h time frame
-
Entry: $2.96
TP: $5.64
SL: $2.66
RR: 8.77
-
(1) TIA is still correcting and building the bottom structure after dump on 3rd Feb.
(2) Double bottom is one of the possible structure, the potential right leg is $2.9
(3) Fibonacci provides first target at $4.5 and final target at $5.6
(4) Stop loss once going below $2.66

TIA/USDThello friends
According to the arrival of buyers, we can enter into the transaction with capital and risk management.
*Trade safely with us*

TIAUSDT 3DTIA ~ 3D Analysis
#TIA This is the lowest support block for now. Buy gradually from here with a minimum target of 15%++.


#TIA/USDT#TIA
The price is moving in a descending channel on the 1-hour frame and is expected to continue upwards
We have a trend to stabilize above the moving average 100 again
We have a descending trend on the RSI indicator that supports the rise by breaking it upwards
We have a support area at the lower limit of the channel at a price of 4.33
Entry price 4.72
First target 4.90
Second target 5.12
Third target 5.47

#TIA/USDT#TIA
The price is moving in a descending channel on the 1-hour frame and is expected to continue upwards
We have a trend to stabilize above the moving average 100 again
We have a descending trend on the RSI indicator that supports the rise by breaking it upwards
We have a support area at the lower limit of the channel at a price of 4.65
Entry price 4.70
First target 4.91
Second target 5.10
Third target 5.32

TIA (Celestia) Main trend. Maximum targets of the cycle. XXL+10XLogo of rhymes. Time frame 3 days. Everything is shown and described on the price chart of this pre-planned super hype, to earn super profits out of nothing.
"Collected" (principle and scheme of deception) for 7 rounds of financing (the principle of the "access pyramid") - $ 156.5 million. This is the principle of super pumping and listing on exchanges for super huge profits of almost all hype assets since 2020.
Under the logic of the chart, as a rule, they pull under the general trend of the market cycle by another + 800-1000%. According to the chart, the average price between accumulation and distribution of the cycle is usually 500-800%. The main thing is to keep the logic of the chart under the general market cycle (for constant small, imperceptible sales). Such assets are constantly sold in trend, which is logical, there is no difference between 50x -100x - 1000X.
No matter how funny and illogical it may sound, while the “whales” are selling, you can be in the asset and be safe. When sales stop, that is, there is no interest in maintaining the hype, the prospects of the legend and the liquidity of the asset for sales, - a sharp (hack, break-in, or other fiction - justification for "closing the project") or slow death (the asset loses major players and demand / supply is given into the hands of “the majority of those waiting for XXX, who will never be”), that is, depreciation and scam.
The previous legend of prospects does not matter, as the focus of attention of the crowd shifts to other freshly created similar assets and marketing to attract “fresh blood” of new stupid money. All new assets are created, and most importantly advertising, at the expense of profits from the previous ones, only on a large scale. This is a disguised Ponzi scheme, which everyone agrees with, as they are sure that they will not be “the last”.
Linear for clarity.
Local game.

TIA NEW UPDATE (1D)Due to tokenomics issues, TIA dropped along with the market.
Now, we’ve prepared a new update for TIA. At each target, secure a portion of your profit and lock it in.
By analyzing the TIA chart, it appears to be forming a large diametric pattern.
This diametric is likely part of wave D.
It seems TIA intends to form wave E of this diametric.
As long as the green zone is maintained, it can move towards the targets.
The targets are marked on the chart.
Closing a daily candle below the invalidation level will invalidate this analysis.
For risk management, please don't forget stop loss and capital management
Comment if you have any questions
Thank You

#TIA (SPOT) entry ( 4.200- 4.800) T.(14.000) SL(4.161)BINANCE:TIAUSDT
#TIA/ USDT
Entry ( 4.200- 4.800)
SL 1D close below 4.161
T1 6
T2 10
T3 14
______________________________________________________________
Golden Advices.
********************
* collect the coin slowly in the entry range.
* Please calculate your losses before the entry.
* Do not enter any trade you find it not suitable for you.
* No FOMO - No Rush , it is a long journey.
Useful Tags.
****************
My total posts
www.tradingview.com
1Million Journey
www.tradingview.com
www.tradingview.com
**********************************************************************************************
#Manta #OMNI #DYM #AI #IO #XAI #ACE #NFP #RAD #WLD #ORDI #BLUR #SUI #VOXEL #AEVO #VITE #APE #RDNT #FLUX #NMR #VANRY #TRB #HBAR #DGB #XEC #ERN #ALT #IO #ACA #HIVE #ASTR #ARDR #PIXEL #LTO #AERGO #SCRT #ATA #HOOK #FLOW #KSM #HFT #MINA #DATA #SC #JOE #RDNT #IQ #CFX #BICO #CTSI #KMD #FXS #DEGO #FORTH #AST #PORTAL #CYBER #RIF #ENJ #ZIL #APT #GALA #STEEM #ONE #LINK #NTRN #COTI #RENDER #ICX #IMX #ALICE #PYR #PORTAL #GRT #GMT #IDEX #NEAR #ICP #ETH #QTUM #VET #QNT #API3 #BURGER #MOVR #SKL #BAND #ETHFI #SAND #IOTX #T #GTC #PDA #GMX #REZ #DUSK #BNX #SPELL #POWR #JOE #TIA

Celestia (TIA/USDT) - "LONG" Spot Margin Trade📈 LONG
Signal Type: (SPOT) ⬆️
💵Margin: 2%
✅Entry level:
$6.2 - $6.9
🎯Target Levels:
1) $7.7
2) $8.8
🚫Stop Loss: $5.749
💰 Leverage (Optional)
‼️Risk= Medium
⚠️Please use the risk management I provided for you accordingly and don't forget about the risk in futures trading. Be sure to adjust Stop Loss/Leverage to your needs.

TIA still seems to be bullishFrom where we placed the green arrow on the chart, it seems that TIA has entered a bullish diamond diametric, and is currently in the middle of wave D.
We expect wave D to complete and wave E to start from the green range.
Targets are $10, $12, and $14.
A daily candle closing below the invalidation level will invalidate this analysis.
For risk management, please don't forget stop loss and capital management
When we reach the first target, save some profit and then change the stop to entry
Comment if you have any questions
Thank You

$TIA Preparing for a Final Push to ATHsBINANCE:TIAUSDT is gearing up for one last push. I've added positions on the monthly retest and will be scaling out above $12.
Previous entries are sitting below $5, so feel free to check my earlier posts for the full context.
I believe the 7.2 zone will become the new range low, and it's looking reasonable to target new all-time highs (ATHs) from here. This opens the door to dreaming about even more ambitious targets.

#TIA/USDT Ready to go higher#TIA
The price is moving in a descending channel on the 4-hour frame and sticking to it well
We have a bounce from the lower limit of the descending channel, this support is at 7.30
We have a downtrend on the RSI indicator that is about to be broken, which supports the rise
We have a trend to stabilize above the 100 moving average
Entry price 8.64
First target 8.90
Second target 9.50
Third target 10.02

TIAUSD Its 1st ever 1D Golden Cross can take it to $46.00!Celestia (TIAUSD) is ahead of its first 1D Golden Cross in history, which should have been completed by next Monday the latest. Having broken above the Lower Highs trend-line that has dominated the majority of 2024, the only technical obstacle now is the 1W MA50 (red trend-line).
If that breaks, we expect the 1D Golden Cross to deliver a parabolic rally similar to November 2023 - January 2024. That was a +1018.18% rise from the bottom, which gives us a target estimate of $46.00.
-------------------------------------------------------------------------------
** Please LIKE 👍, FOLLOW ✅, SHARE 🙌 and COMMENT ✍ if you enjoy this idea! Also share your ideas and charts in the comments section below! This is best way to keep it relevant, support us, keep the content here free and allow the idea to reach as many people as possible. **
-------------------------------------------------------------------------------
💸💸💸💸💸💸
👇 👇 👇 👇 👇 👇

TIAUSDT - great targets aheadweekly chart displays breakout the descending channel since about 12 months!!
it's just begaining .. big move did'nt started yet
target around 60$🎯

TIAUSDT Breaks Resistance: Strong Bullish Move AheadTIAUSDT Technical analysis update
TIAUSDT has been consolidating for the past 160 days, repeatedly testing the trend resistance line. Today, the price broke above the resistance line on the daily chart and crossed above the 100 EMA. A strong bullish move is anticipated in the coming days.
Buy zone : Below $6.30
Stop loss : $5.32
Take Profit 1: $7.10
Take Profit 2: $8.50
Take Profit 3: $11.85

TIATIA / USDT
After long correction period and another 5 months accumulation many people lost confidence in TIA but it finally brokeout
Its flying above our entry by 24% but looking at chart its just brokeout and long Journey still ahead
Best of wishes

TIA is at the bottom of the channel!The TIA is at the bottom of the major channel, it has broken the minor channel and is the bottom of the major channel.
We also have a bullish iCH on the chart, which gives us a bullish view.
A trigger line has also been created on the chart, which will break soon.
The mid-term and long-term targets are clear on the chart.
Supply range is very important for us
Closing a daily candle below the invalidation level will violate this analysis
invalidation level: 4.08
Do not enter the position without capital management and stop setting
Comment if you have any questions
thank you
