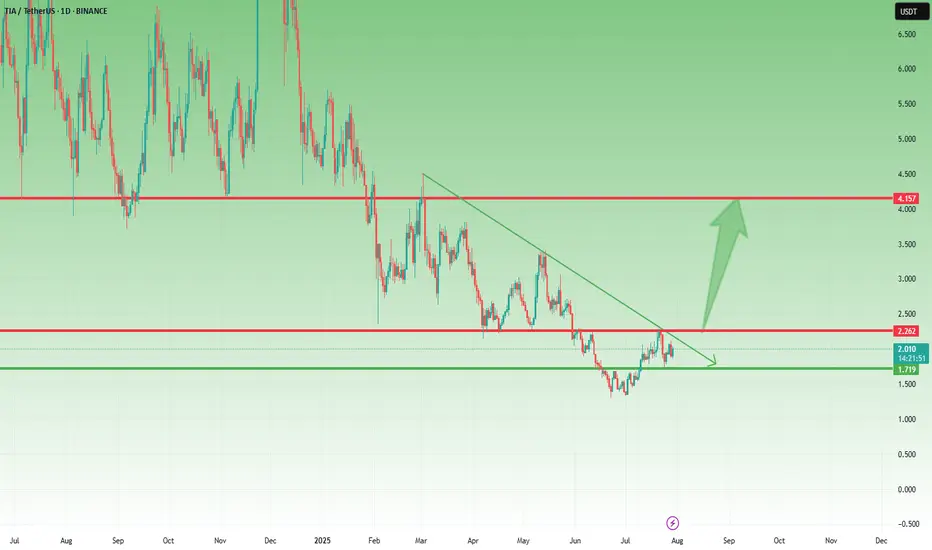
TIA Holding Support – Break Above $2.20 Could Trigger Big MoveLast week, I mentioned that TIA could be preparing for a move and that buying dips around $1.75 might be a good opportunity.
Well, price dropped exactly into that support zone, bounced slightly, and is now consolidating, which could be the calm before the next wave.
________________________________________
📌 Here’s what I’m watching:
• The $2.10–$2.20 zone is now a confluence resistance area (horizontal + descending pressure)
• A break and daily close above this level could trigger a strong leg up, with the next major target around $4.00
________________________________________
📈 Bias remains bullish
As long as $1.70 holds, this setup stays valid, and dips continue to be buyable.
________________________________________
🎯 Trading Plan:
• Looking to buy dips toward $1.80–1.85
• Acceleration expected only above $2.20
• Bearish invalidation only below $1.70
________________________________________
Conclusion:
TIA is respecting structure perfectly. If it breaks above $2.20, we could be looking at a potential double in price toward $4.
TIAUSDT
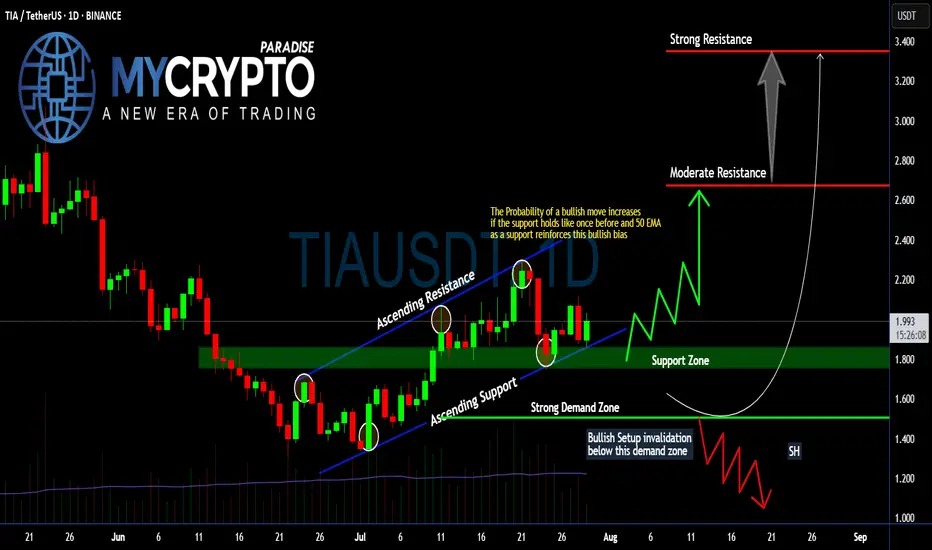
Will #TIA Continue to Soar or Bears Can Halt it? Must Watch Yello, Paradisers! Will we see #TIA continue to soar from here, or can bears halt its momentum? Let's see the latest setup of #Celestia to see what's going to happen:
💎Following a textbook ascending channel structure, #TIAUSDT has been respecting both its ascending resistance and ascending support, with each touchpoint confirming trader participation and growing confidence. Price is currently holding above the 50 EMA and within a crucial support zone between $1.80–$1.90—an area that previously triggered a strong impulse move to the upside.
💎The probability of a bullish continuation increases significantly as long as the #TIAUSD respects this support zone and the 50 EMA acts as dynamic support. If this level continues to hold, we expect a move toward the moderate resistance around $2.67, the key area where sellers previously stepped in aggressively.
💎But that’s not all—if bulls gain momentum and break above $2.67 with strong volume, the next price magnet becomes the $3.34 level, where strong resistance and high-volume node overlap. This level would likely be the point of exhaustion unless broader market momentum takes over.
💎However, caution is critical here. If price breaks below the strong demand zone around $1.507, this invalidates the bullish structure entirely and opens the door for a swift move down toward the $1.20–$1.00 range, where a potential market shakeout could occur. Remember, a failed bullish setup often becomes a powerful bear trap for undisciplined traders.
Stay patient, Paradisers. Let the breakout confirm, and only then do we strike with conviction.
MyCryptoParadise
iFeel the success🌴
Celestia · A Strong Bullish Wave of GrowthCelestia right now looks pretty good. This one was called to my attention by one of my followers in the comments. The truth is that we've been looking at TIAUSDT and right now it continues to look good. The candles message is that the action is about to transform into a very strong advance. The action has been sideways for so long, with a bearish bent, that we can forget that the market always changes. We might forget that right around the corner there is big change. Everything is about to change and for the better that's what I know after looking at hundreds of charts. Celestia is the same.
Looking at the chart from a neutral standpoint, it is hard to predict what I am predicting because all we see is the same followed by more of the same. And that's my point, the market is always seeking change. It has been the same for too long and so everything changes now. The change is always the contrary to what was previously happening. So Celestia was down then sideways moving lower, and this will change into higher highs and higher lows. A strong bullish wave of growth.
Namaste.

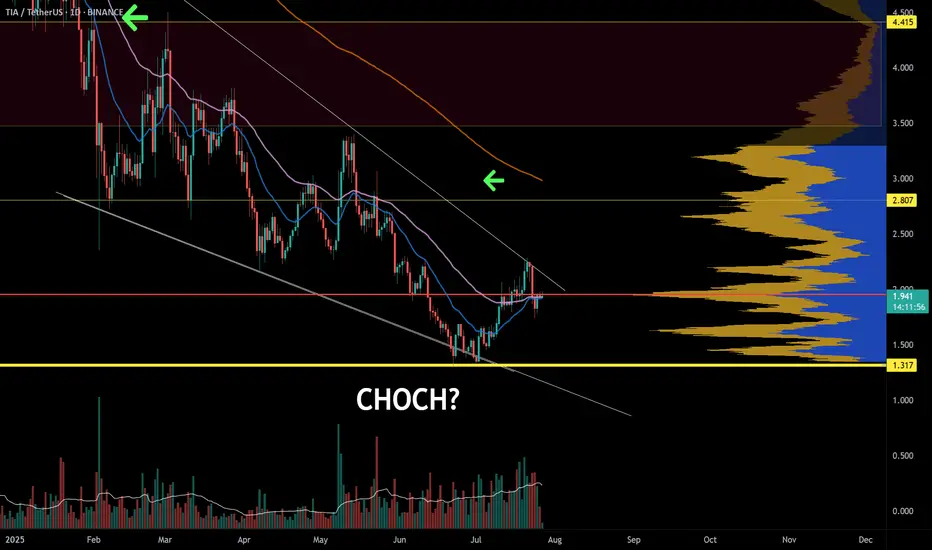
Celestia sell pressure could be done. TIA is still in a downtrend, LL and LH. A proper CHOCH of market structure would confirm a reversal. In the meantime, we keep an eye on momentum shifts. Patience is key.
Full TA: Link in the BIO
TIA- Is the Coin Finally Ready to Wake Up?After its launch on Binance in November 2023 and the immediate 10x pump, BINANCE:TIAUSDT has been, to put it mildly, a constant disappointment.
Since then, the hype has faded, and the price slowly deflated — leaving holders frustrated and the chart uninspiring.
🔍 Recent Signs of Life
However, something has started to shift.
After a fresh dip to 1.35, the coin formed a small double bottom and managed to recover above the 2.00 zone.
⚠️ Important to note: the rise hasn’t been impulsive.
But in the context of a broader altcoin revival — which I've outlined in my recent dominance analyses — TIA could become a decent candidate for a relief rally.
🔽 What I’m Watching
The recent structure looks like a bearish flag, and there’s a decent chance the pattern breaks down first before any real rally begins.
That’s why I’m watching the 1.70 area closely.
If price dips into that zone and gives a positive reversal signal, I’ll look to buy the dip.
🎯 Target and Potential
My upside target for this move is around 4.00, which would represent over 100% potential from the entry zone.
No moon calls. Just technical setup + potential market rotation + favorable risk/reward.
✅ Conclusion
TIA isn’t a favorite.
But sometimes, unloved charts offer the cleanest reversals.
I’ll let the market speak near 1.70.
If it holds and gives confirmation — I’m in. 🚀
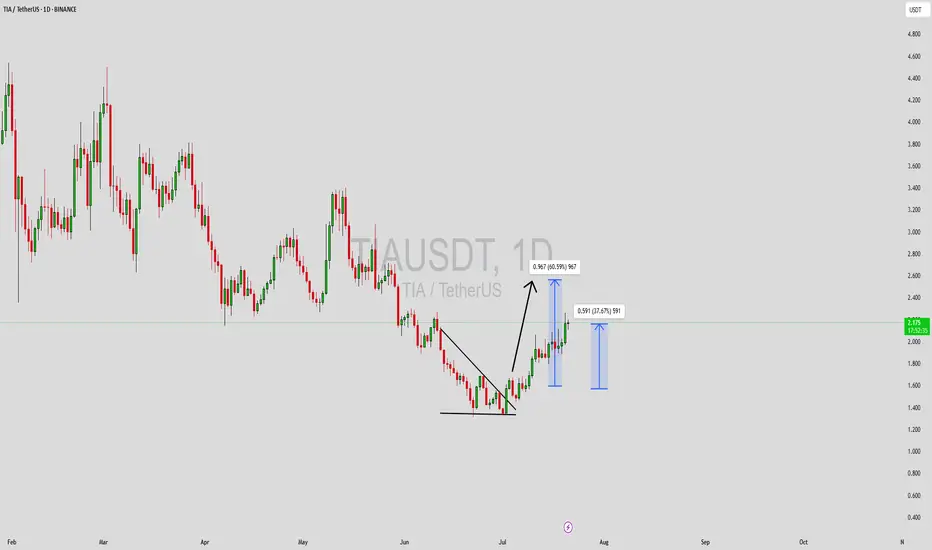
TIAUSDT Forming Falling WedgeTIAUSDT has recently shown a bullish breakout from a falling wedge structure on the daily timeframe—a pattern known for its strong reversal signals. This move is supported by rising trading volume, signaling fresh momentum entering the market. With current price action pushing higher, the short-term upside potential targets lie around the 50% to 60% gain zone, which aligns well with past resistance levels marked on the chart. This upward shift also breaks the series of lower highs that previously dominated the chart, suggesting a confirmed trend reversal.
From a broader perspective, TIA has built strong fundamentals as part of the Cosmos ecosystem, which gives it significant long-term value potential. The recent surge in price has been accompanied by increased community activity and mentions across social media platforms, which may indicate growing investor sentiment and renewed project interest. The consolidation phase appears to have ended, and TIA is now pushing for a sustained bullish leg.
Market participants should keep an eye on support retests and breakout validations as the rally progresses. The measured target after this wedge breakout puts TIA in a good position for a strong Q3 performance. With macro tailwinds favoring altcoins and mid-cap blockchain projects regaining traction, TIA could be setting up for an extended upward move.
✅ Show your support by hitting the like button and
✅ Leaving a comment below! (What is You opinion about this Coin)
Your feedback and engagement keep me inspired to share more insightful market analysis with you!
TIA/USDT – Major Breakout Incoming? Reversal in Sight!🔍 Full Technical Analysis (1D Timeframe):
TIA/USDT is approaching a critical turning point after experiencing a strong downtrend since December 2024. The chart clearly forms a Falling Wedge pattern — a classic bullish reversal signal known for explosive breakouts when confirmed.
Currently, the price is testing a key confluence zone around $2.00 – $2.30, where:
A major horizontal resistance meets
A long-term descending trendline (yellow), acting as dynamic resistance since the last local high.
🚀 Bullish Scenario (Confirmed Breakout):
If TIA successfully breaks and closes above the $2.30 – $2.78 range with strong volume, it could trigger a major mid-term rally. The potential upside targets are aligned with previous structural resistance levels:
Target Resistance Level
🎯 Target 1 $3.34
🎯 Target 2 $4.17
🎯 Target 3 $5.41
🎯 Target 4 $6.61
🎯 Target 5 (Extended) $8.87 – $9.28 (Major Weekly Supply Zone)
✅ Additional Bullish Confirmation: A volume breakout + RSI moving into the 50–70 zone would strengthen the bullish case.
🛑 Bearish Scenario (Fake Breakout Risk):
If the price gets rejected again from the descending trendline and fails to close above $2.00, the bearish pressure may push the price back toward key demand zones:
First support zone: $1.60
Last major defense: $1.31 (the current swing low)
This could lead to a double bottom structure before any meaningful trend reversal happens.
📐 Pattern Breakdown:
Pattern: Falling Wedge Breakout Pattern
Duration: Over 7 months of consolidation below trendline
Risk-to-Reward Potential: Highly favorable if breakout is confirmed
🧠 Market Sentiment:
Many altcoins are showing early signs of bottoming out and accumulation.
TIA could become a breakout leader in the next wave if it clears the current resistance cluster.
Expect momentum traders to join in once a solid bullish candle closes above the wedge.
✅ Conclusion:
TIA/USDT is at a technically golden level. A breakout from this falling wedge structure could ignite a multi-stage rally. However, caution is advised: wait for a confirmed breakout and manage risk in case of a failed breakout attempt.
#TIAUSDT #CryptoBreakout #FallingWedge #AltcoinRally #ReversalPattern #BreakoutTrade #CryptoTA #MomentumTrade #Altseason #TechnicalAnalysis #CryptoSignals

TIA Double Bottomed, $4.5 PossibleBYBIT:TIAUSDT.P bottomed out at the $2.3 level. From there, its initial rally took it to the $3.4 level. If a bottom formation occurs again at its current level, another rally could push it first to the $3.8 level, and if the rally is strong, potentially up to $4.5. Strength into higher levels are critical.

Free signal hello friends👋
🌟Considering that the price reaches an important weekly support, the price is expected to grow, so you can enter into a transaction with risk and capital management and move to the specified goals.
🔥Follow us for more signals🔥
*Trade safely with us*

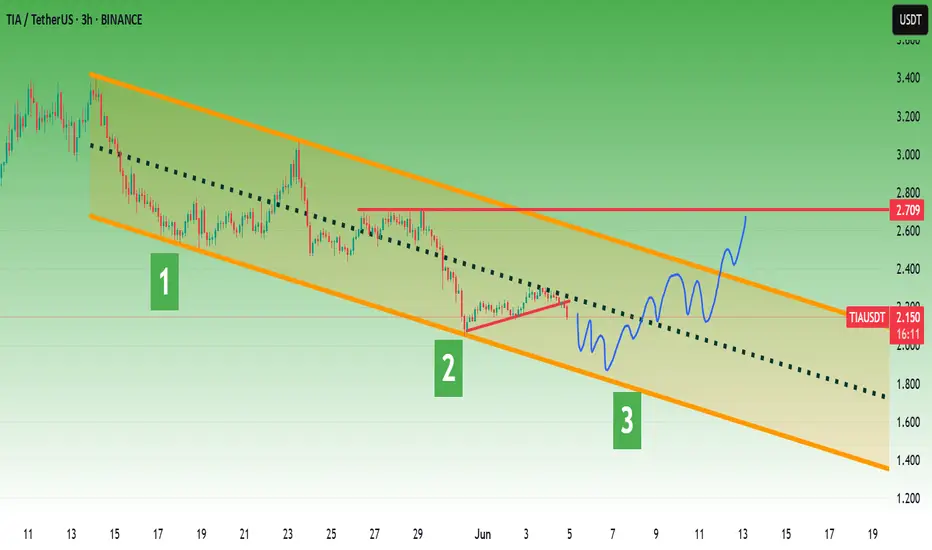
TIA/USDT – Potential Reversal After Channel BreakTIA has broken out of a long-standing descending channel on the 4H timeframe, signaling a possible trend reversal. The price is attempting to flip structure, and bullish momentum is building.
Structure:
Clear descending channel breakout
Retest of upper trendline underway
RSI back above 50, showing recovery
Setup:
Entry: On successful retest of the breakout zone near 1.50–1.55
Stop Loss: Below 1.43
Target Levels:
1.67, 1.83, 2.25 until 2.95
This setup looks promising if the price holds above the trendline. Watch closely for volume confirmation and follow-through.
DYOR. Not financial advice
#TIA #Altcoin

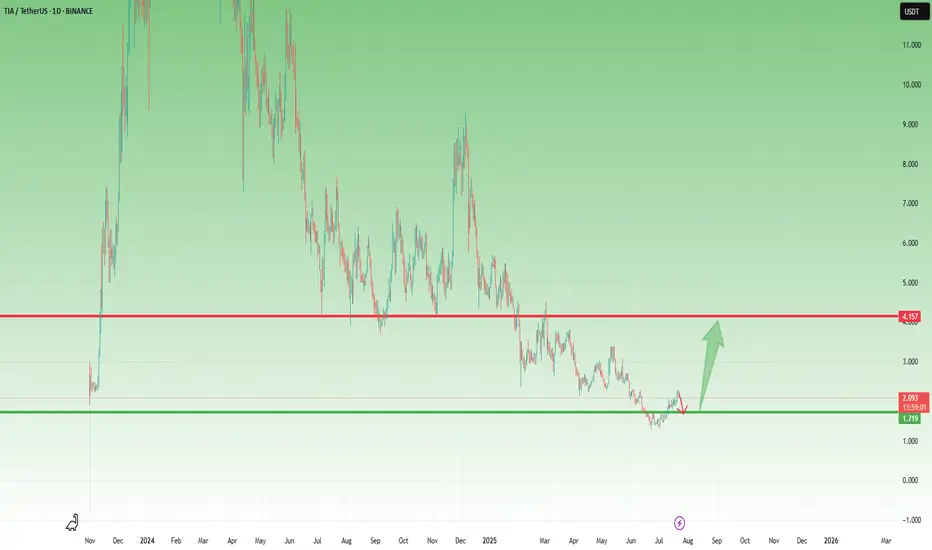
CelesTIA, All-Time Low Last Month, Trend Change—2025 Bull MarketI am showing multiple charts but my prediction is that the market will turn—the entire Cryptocurrency market—the altcoins market will turn bullish.
CelesTIA
There is an uptrend between late 2023 and early 2024, the same with the rest of the market. There was also a bullish wave late 2024. Huhhh, there will be an uptrend in late 2025 and early 2026.
Ok. Celestia. TIAUSDT.
It is easy to distinguish the downtrend vs no more downtrend.
The period drawn orange did produce lower lows but it is very different compared to the "downtrend," red on the chart.
So this is the transition. Strong down, then sideways, then up.
This pair is producing lower lows in its consolidation period but I also showed you many pairs that are producing higher lows, it makes no difference. Lower lows or higher lows, the action is very different compared to the "downtrend." The downtrend is no more.
My thesis concludes with a change of trend. This is where everything is leading, hundreds and hundreds of charts, more than 500 since 7-April. They all say the same.
In short, these hundreds of charts are saying that the market is about to become extremely bullish and that is something that we welcome with open arms. Actually, we have been waiting patiently, and some not so patiently, for this change to occur.
Many trust me; trusted me;
Many doubted me and that is also ok.
I love the truster and the doubter...
I love the reader and the follower...
I love TradingView and the Cryptocurrency market; but I will be proven right in the end.
I accept the fact that it is impossible to get it always right. I accept the fact that many times I am so, so very wrong.
You have to accept the fact that time is running out, Crypto is going up.
Celestia just hit a new all-time low and this is awesome news for me and for you, because, from this bottom low we will grow. You can mark these words... Just watch!
I would like to take just a few seconds of your time to say, thank you. Time is precious, and you took the time to read this long. If you enjoy the content, make sure to follow.
Thanks a lot for your continued support.
There is only one Cryptocurrency market, this is us.
It is you and me, it is all of us. It is not the whales or the exchanges. We are the whales and the exchanges. We are the government, the institutions, the programmers, the designers; the owners, the planners, the coders, the security expert, the writer, the reporter, the auditor; the professor, the mom, the father and the son. You are the market. You are it. You are the whole thing, the whole world.
You might think yourself unimportant as just a tiny ray of light, but there is no life without the sun. You being light, you permeate everything that exist around us. So you are the Cryptocurrency market. You are Bitcoin and you are the altcoins.
Namaste.

TIA Coin: Unlock 118% Profit Potential (1D)From the point where we placed the red arrow on the chart, it appears the TIA correction has begun.
Despite the current bullish market trend, TIA has not yet experienced a pump, and it seems the price hasn't reached its bottom yet. This correction seems to follow a large, time-consuming diamond-shaped diametric pattern, and we are currently in the early or middle stages of wave G.
Recently, the price lost a minor trendline, marked with a red dotted line, indicating that wave G might continue its path.
We have identified a low-risk buy zone on the chart for catching the next bullish wave in TIA. We are targeting buy/long positions in this zone.
Price targets are clearly indicated on the chart.
A daily candle close below the invalidation level will invalidate this analysis and suggest a potential reversal.
invalidation level: 1.089$
For risk management, please don't forget stop loss and capital management
When we reach the first target, save some profit and then change the stop to entry
Comment if you have any questions
Thank You

TIAUSDT Forming Descending TriangleTIAUSDT is gaining attention as traders and investors look for fresh opportunities in the altcoin market. With good volume backing recent moves, this crypto pair shows promising potential for a 40% to 50%+ gain in the near term. Although there’s no specific pattern visible right now, the price action suggests that TIA could be entering an accumulation phase before its next leg up. As the market sentiment for altcoins improves, TIAUSDT is likely to benefit from renewed buying interest.
Celestia (TIA) is a modular blockchain project designed to tackle scalability and customization in the crypto space. Its unique architecture allows developers to deploy their own blockchains with ease, making it a key player in the next generation of decentralized applications. This innovation, combined with growing community support, is a positive fundamental catalyst for the TIA token, which could translate into solid price action in the coming weeks.
Technical traders are closely watching support and resistance levels to catch the next breakout move. The increasing trading volume and investor interest are strong signals that a significant move could be on the horizon. Keeping an eye on upcoming project milestones, network upgrades, or partnership announcements could help you stay ahead of the curve and position yourself for the anticipated 40% to 50% gain.
✅ Show your support by hitting the like button and
✅ Leaving a comment below! (What is You opinion about this Coin)
Your feedback and engagement keep me inspired to share more insightful market analysis with you!

TIA Scalp trade setupwait for the retest of breakout, set sl & tp. While on swing trade will long below 1.31 and tp 2.0$, TIA is extremely oversold, So less affected by BTC.

$ENS / USDT Daily Time frame, MAJOR PUMP?Chart Overview
- Pattern Identified: Falling Wedge Pattern
- A bullish reversal pattern, often appearing after a downtrend.
- Three major touchpoints on the lower trendline indicate strong support and pattern validity.
Demand Zone (Support Area)
- Marked near the current price level ($2.0309 - $2.6722)
- Price is testing this zone for the third time.
Supply Zone (Resistance Area)
- Around ($6.6529 – $9.2734)
- Multiple swing highs are plotted within or near this region, indicating strong historical resistance.
Volume Profile (Right side of chart)
- High volume node between $2.50 – $4.00 suggests price acceptance and a potential area for consolidation or resistance after breakout.
- Low volume area between $4.50 – $6.50 implies less resistance, so price might move quickly through it.
FVG (Fair Value Gaps)
- Several FVGs (imbalance zones) are highlighted.
- $3.8 – $4.05
- $5.8236 – $6.1663
- These zones often act as magnets for price, offering potential targets after breakout.
📏 Fibonacci Levels
- Pullback levels (0.28, 0.5, 0.618, 0.786) are marked.
- Price may retrace toward these areas as part of the bullish structure.
✅ Bullish Scenario
- Breakout from the falling wedge pattern.
- Price pushes into first FVG (~$3.8), then toward $5.8236 – $6.1663, eventually challenging the supply zone ($6.6529 – $9.2734)
⚠️ Risks
- If price breaks below the demand zone, it invalidates the wedge and opens room for further downside.
- Falling wedge breakouts require confirmation (e.g., daily close above wedge resistance).
📊 Summary
- Bias: Bullish if support holds and wedge breakout occurs.
- Trigger: Break and close above wedge resistance line.
- Targets: $3.8 → $5.8 → $6.1 → $9.5
- Invalidation: Daily close below the demand zone ($2.00 - $1.90)
Please note this is not financial Advice. This is just an analysis!

TIA - Super Bullish For AltseasonBINANCE:TIAUSDT
𝐓𝐈𝐀/𝐔𝐒𝐃𝐓
TIA is coiling at the tip of a falling wedge — a breakout looks imminent. Eyes on the $3.31 level for a potential 107% move if bulls take charge

Tia bearish short term.To me the view is pretty clear.
* The purpose of my graphic drawings is purely educational.
* What i write here is not an investment advice. Please do your own research before investing in any asset.
* Never take my personal opinions as investment advice, you may lose your money.
Celestia TIA price analysis#TIA price currently looks “weak,” gradually sliding down and updating lows.
A “ray of hope” may be a repeat of the fractal behavior of the OKX:TIAUSDT price from last year, when, after the third slight update of the low, the price began to rebound upward.
If we take this fractal as a basis, then in the near future, the price of the #Celestia token should rebound to $4, followed by a correction and continued growth to $5.55.
_____________________
Did you like our analysis? Leave a comment, like, and follow to get more

TIA/USDT – Trendline breakout watchTIA/USDT – Trendline breakout watch
TIA has broken above the descending trendline, indicating a potential shift in momentum. If the price manages to hold above the breakout zone with stability, we can expect a bullish move ahead.
A successful retest and hold above the trendline could trigger a pump of around 15–30% in the coming sessions.
Key levels to watch:
* Breakout support zone
* Confirmation with volume
* Immediate resistance ahead
Monitor closely — holding the breakout could open the door for a solid upside move.

TIAUSDT 1D AnalysisTIA ~ 1D Analysis
#TIA Buy again from here if you still have confidence in this coin with a short term target of at least 15%+ from here.

TIAUSDT | Still No Buyers—Maintaining a Bearish Outlook
TIAUSDT has been one of today’s top volume movers, with 24‑hour trading volume hitting around $63.6 million—a 48.7 percent jump from the previous day.
Yet despite this surge, genuine buying interest remains absent, and price action is unable to find footing.
🔴 First Resistance: The Red Box
• This red box marks the first major zone where sellers have consistently defended price.
• Any rally into this area should be treated as a short opportunity—provided you see clear lower‑time‑frame breakdowns and CDV confirming sell‑side dominance.
📉 How Much Further Could It Fall?
I can’t predict the exact bottom—no one can. What I do know is that until buyers step up, downward pressure is likely to continue. Watch for each bounce to stall at resistance and use that as your cue to enter or add to shorts.
🤝 Key Trading Rules to Follow
Confirmation is Everything
Wait for a clean LTF breakdown inside the red box, with CDV divergence or rising sell volume. No confirmation means no trade.
Adaptive Bias
I will not insist on my short idea. If TIA breaks above this red box with volume and then retests it as support, I will shift to a long bias. Otherwise, my view stays bearish.
Risk Management
Keep stops just above the red box. Trade only what the market shows you—never chase.
This approach is built on watching real order flow and market behavior, not guessing. If you want to align yourself with a strategy that filters out noise and focuses on high‑probability setups, you’re in the right place.
📌I keep my charts clean and simple because I believe clarity leads to better decisions.
📌My approach is built on years of experience and a solid track record. I don’t claim to know it all but I’m confident in my ability to spot high-probability setups.
📌If you would like to learn how to use the heatmap, cumulative volume delta and volume footprint techniques that I use below to determine very accurate demand regions, you can send me a private message. I help anyone who wants it completely free of charge.
🔑I have a long list of my proven technique below:
🎯 ZENUSDT.P: Patience & Profitability | %230 Reaction from the Sniper Entry
🐶 DOGEUSDT.P: Next Move
🎨 RENDERUSDT.P: Opportunity of the Month
💎 ETHUSDT.P: Where to Retrace
🟢 BNBUSDT.P: Potential Surge
📊 BTC Dominance: Reaction Zone
🌊 WAVESUSDT.P: Demand Zone Potential
🟣 UNIUSDT.P: Long-Term Trade
🔵 XRPUSDT.P: Entry Zones
🔗 LINKUSDT.P: Follow The River
📈 BTCUSDT.P: Two Key Demand Zones
🟩 POLUSDT: Bullish Momentum
🌟 PENDLEUSDT.P: Where Opportunity Meets Precision
🔥 BTCUSDT.P: Liquidation of Highly Leveraged Longs
🌊 SOLUSDT.P: SOL's Dip - Your Opportunity
🐸 1000PEPEUSDT.P: Prime Bounce Zone Unlocked
🚀 ETHUSDT.P: Set to Explode - Don't Miss This Game Changer
🤖 IQUSDT: Smart Plan
⚡️ PONDUSDT: A Trade Not Taken Is Better Than a Losing One
💼 STMXUSDT: 2 Buying Areas
🐢 TURBOUSDT: Buy Zones and Buyer Presence
🌍 ICPUSDT.P: Massive Upside Potential | Check the Trade Update For Seeing Results
🟠 IDEXUSDT: Spot Buy Area | %26 Profit if You Trade with MSB
📌 USUALUSDT: Buyers Are Active + %70 Profit in Total
🌟 FORTHUSDT: Sniper Entry +%26 Reaction
🐳 QKCUSDT: Sniper Entry +%57 Reaction
📊 BTC.D: Retest of Key Area Highly Likely
📊 XNOUSDT %80 Reaction with a Simple Blue Box!
📊 BELUSDT Amazing %120 Reaction!
I stopped adding to the list because it's kinda tiring to add 5-10 charts in every move but you can check my profile and see that it goes on..

TIA NEXT TERMMy scenario is like this.
* The purpose of my graphic drawings is purely educational.
* What i write here is not an investment advice. Please do your own research before investing in any asset.
* Never take my personal opinions as investment advice, you may lose your money.

The key is whether it can rise above 3.211
Hello, traders.
If you "Follow", you can always get new information quickly.
Have a nice day today.
-------------------------------------
(TIAUSDT 1D chart)
The basic trading strategy is to buy near the HA-Low indicator and sell near the HA-High indicator.
However, if the HA-Low indicator falls, there is a possibility of a stepwise downtrend, and if the HA-High indicator rises, there is a possibility of a stepwise uptrend.
Therefore, when the HA-Low indicator is first created, the probability of rising is higher than the probability of falling, and when the HA-High indicator is first created, the probability of falling is higher than the probability of rising.
If the HA-Low indicator rises and then meets the previously formed HA-Low indicator again, the probability of falling is higher.
On the contrary, the HA-High indicator has a higher probability of rising.
You should check the movement of the chart with these characteristics in mind.
However, you should comprehensively judge the correlation between the OBV indicator and the StochRSI indicator.
-
From a trend perspective, since the M-Signal of the current 1D chart is < M-Signal of the 1W chart, you can see that it is in a reverse arrangement.
Therefore, when trading in a reverse arrangement, it is recommended to trade for a short period of time using day trading.
Therefore, if it shows a price that rises above the M-Signal indicator of the 1W chart and maintains the price, it is highly likely that a trend will be formed that can be traded.
In other words, when looking at the current price position, it can be seen that it can be traded for a short period of time or longer only when it rises above 3.211 and shows support.
-
Since the HA-Low indicator is formed at the 2.490 point, the price must be maintained above this point.
If not, there is a possibility of an additional stepwise downtrend, so you should think about a countermeasure for this.
-
If the average purchase price is significantly higher than the current price, you should not buy too much and increase your investment ratio.
In this case, it is better to trade with a relaxed mind and faithfully follow the basic trading strategy.
However, it is better to trade by increasing the number of coins (tokens) corresponding to the profit realization method and increasing the number of coins (tokens).
In other words, trade by purchase price.
If you bought 100 USDT at the current price of 2.840, you should sell 100 USDT when the price rises and shows resistance at 3.211.
In this case, only the number of coins (tokens) corresponding to the profit will remain.
At this time, you should be careful about the transaction fee.
Since you have to sell the purchase amount including the transaction fee, the actual selling amount when you place an order is not 100 USDT.
The transaction fee rate varies depending on the exchange.
For example, if the trading fee is 0.1%, you can trade 100USDT - (100USDT x 0.2%) = 99.8USDT.
-
Thank you for reading to the end.
I hope you have a successful trade.
--------------------------------------------------
- Here is an explanation of the big picture.
(3-year bull market, 1-year bear market pattern)
(3-year bull market, 1-year bear market pattern)
I will explain the details again when the bear market starts.
------------------------------------------------------
