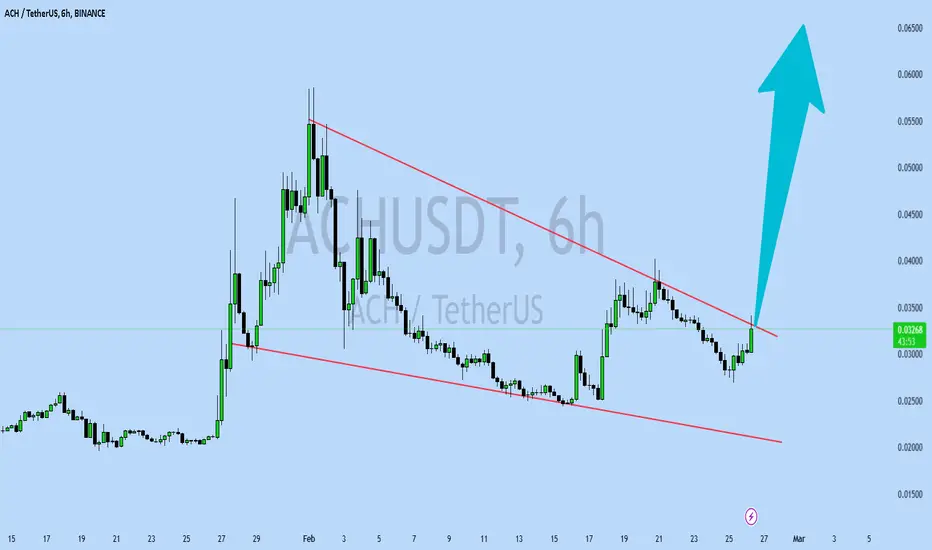
ACHUSDT UPDATEACHUSDT is a cryptocurrency trading at $0.03285. Its target price is $0.06500, indicating a potential 90%+ gain. The pattern is a Bullish Falling Wedge, a reversal pattern signaling a trend change. This pattern suggests the downward trend may be ending. A breakout from the wedge could lead to a strong upward move. The Bullish Falling Wedge is a positive signal, indicating a potential price surge. Investors are optimistic about ACHUSDT's future performance. The current price may be a buying opportunity. Reaching the target price would result in significant returns. ACHUSDT is poised for a potential breakout and substantial gains.
TIAUSDT
TIAUSDT - Tears apart!I wonder what made TIA BOOOM, But not here, OPT for small scalps throughout and follow for the nPoC

#TIA/USDT#TIA
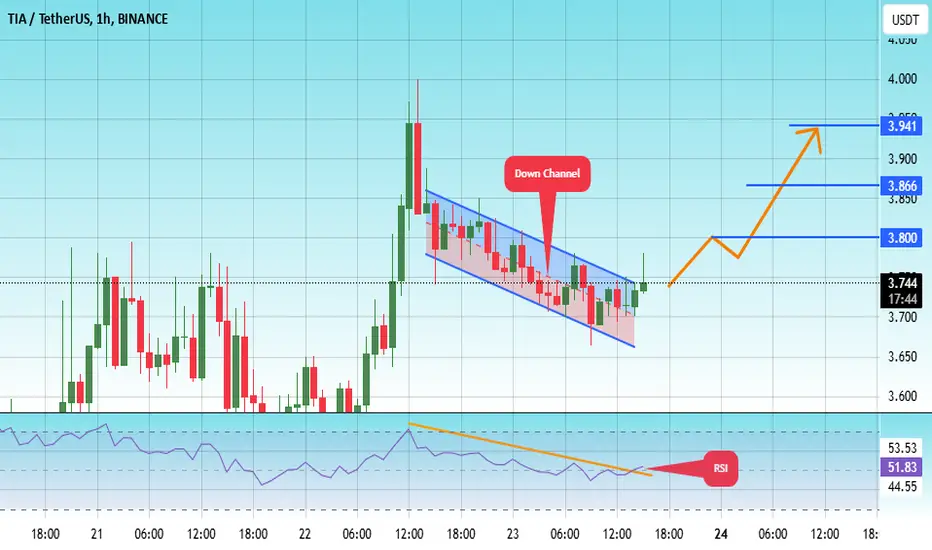
The price is moving in a descending channel on the 1-hour frame and is adhering to it well and is heading to break it upwards strongly and retest it
We have a bounce from the lower limit of the descending channel, this support is at a price of 3.67
We have a downtrend on the RSI indicator that is about to break and retest, which supports the rise
We have a trend to stabilize above the Moving Average 100
Entry price 3.74
First target 3.80
Second target 3.86
Third target 3.92
TIA target $5.64h time frame
-
Entry: $2.96
TP: $5.64
SL: $2.66
RR: 8.77
-
(1) TIA is still correcting and building the bottom structure after dump on 3rd Feb.
(2) Double bottom is one of the possible structure, the potential right leg is $2.9
(3) Fibonacci provides first target at $4.5 and final target at $5.6
(4) Stop loss once going below $2.66

TIA - Long Trade IdeaTIA could shoot up to 3.9–$4, but would love to see a retest at $3.30–$3.50 afterward for possible long re-entry
Targets:
$3.90
$4.38
$4.84
Stoploss below $3.14

TIA/USDThello friends
According to the arrival of buyers, we can enter into the transaction with capital and risk management.
*Trade safely with us*

TIA SHORT/LONGTIA has dropped below $3.7, the lower boundary of its range, which isn't necessarily a bad thing.
If the price manages to reclaim $3.7, it would confirm a major fakeout, potentially pushing the price back up to $5-$6.
In the short term, we might see a small bounce toward the 21 EMA on the daily timeframe, accompanied by a bullish cross on the Stoch RSI.
After that, another pullback could happen, setting up a second bullish cross on the Stoch RSI—which, historically, has often led to stronger upward moves.

TIAUSDT 3DTIA ~ 3D Analysis
#TIA This is the lowest support block for now. Buy gradually from here with a minimum target of 15%++.


TIA/USDTThe coin is in consolidation, and the January low was taken out with a manipulative move (deviation). This can be considered as an AMD setup. Growth targets:
Target 1 = 5
Target 2 = 5.7

tiausdt trade idea.tiausdt chart says everything, price creating lower lows. Now I am expecting price to create another lower low to grab previous day and week low liquidity then a good move up and breakout through channel.

#TIA 28JanFor this asset (TIA), I think if we want the bullish trend to continue, the price needs to hold above $6 on the daily timeframe. Otherwise, the marked green zone could act as a demand zone for buyers.
This is just my personal opinion.

$TIAUSDT on the Brink – 4.6 Accumulation for Big Moves to ATHsBINANCE:TIAUSDT Bottoming Out – Accumulating Below 4.6 for the Breakout
Looks like BINANCE:TIAUSDT is bottoming here, but it might take a couple of weeks for a breakout.
I’m patiently accumulating under 4.6. The daily hasn’t triggered a signal above 5.5 yet, so no rush to add above my current buy zone.
Last time I was expecting new ATHs, so this time I’ll chill and just call it – Our final stand towards ATHs 😂
Solid setup, just needs time.

$TIA: Ready to Breakout After 5 Months of Consolidation?
I think LSE:TIA is finally primed for a breakout after spending the last five months consolidating in the tight $4–$6 range. The lows have been respected multiple times, and we're now seeing the buildup of potential for a significant move.
I’m eyeing an entry at $4.85, which would be a perfect spot to load up if we get a retrace into that zone. If it does dip back there, it's a max bid scenario for me.
However, I'm also prepared to jump in a bit higher if needed, especially if I get left behind as the breakout gains momentum. It's a balancing act between waiting for the perfect entry and not missing out on the move entirely.
Let’s see how it plays out—I'm keeping a close watch!


Critical Moment for TIAUSDT: Bullish Reversal or Breakdown?Yello, Paradisers! Are you watching TIAUSDT closely? It’s at a critical juncture, and what happens next could shape the next major move. Let’s break it down!
💎Currently, TIAUSDT is holding its bullish market structure on the higher timeframes, which is an encouraging sign for the bulls. After taking inducement, the pair has also formed a classic "W" pattern, accompanied by a bullish divergence—a combination that significantly boosts the probability of a bullish reversal from these levels.
💎However, caution is always key. If the price retraces further or we see panic selling, we might still find a bounce from the support zone. For this scenario to play out, we’ll need to wait for a bullish I-CHoCH (Internal Change of Character) to confirm the reversal on lower timeframes. Without this confirmation, entering prematurely could expose us to unnecessary risk.
💎On the flip side, if the price breaks down and closes a candle below the support zone, this would invalidate the current bullish idea. In that case, it would be prudent to wait for new, stronger price action to develop before considering re-entry.
🎖This is why patience and discipline are your best allies in trading, Paradisers. Emotional decisions or rushing into trades without confirmations can lead to costly mistakes. Stick to robust strategies and always wait for high-probability setups to unfold. Remember, long-term consistency is what separates the winners from the herd.
MyCryptoParadise
iFeel the success🌴

#TIA/USDT#TIA
The price is moving in a descending channel on the 1-hour frame and is expected to continue upwards
We have a trend to stabilize above the moving average 100 again
We have a descending trend on the RSI indicator that supports the rise by breaking it upwards
We have a support area at the lower limit of the channel at a price of 4.33
Entry price 4.72
First target 4.90
Second target 5.12
Third target 5.47

#TIA/USDT#TIA
The price is moving in a descending channel on the 1-hour frame and is expected to continue upwards
We have a trend to stabilize above the moving average 100 again
We have a descending trend on the RSI indicator that supports the rise by breaking it upwards
We have a support area at the lower limit of the channel at a price of 4.65
Entry price 4.70
First target 4.91
Second target 5.10
Third target 5.32

TIA (Celestia) Main trend. Maximum targets of the cycle. XXL+10XLogo of rhymes. Time frame 3 days. Everything is shown and described on the price chart of this pre-planned super hype, to earn super profits out of nothing.
"Collected" (principle and scheme of deception) for 7 rounds of financing (the principle of the "access pyramid") - $ 156.5 million. This is the principle of super pumping and listing on exchanges for super huge profits of almost all hype assets since 2020.
Under the logic of the chart, as a rule, they pull under the general trend of the market cycle by another + 800-1000%. According to the chart, the average price between accumulation and distribution of the cycle is usually 500-800%. The main thing is to keep the logic of the chart under the general market cycle (for constant small, imperceptible sales). Such assets are constantly sold in trend, which is logical, there is no difference between 50x -100x - 1000X.
No matter how funny and illogical it may sound, while the “whales” are selling, you can be in the asset and be safe. When sales stop, that is, there is no interest in maintaining the hype, the prospects of the legend and the liquidity of the asset for sales, - a sharp (hack, break-in, or other fiction - justification for "closing the project") or slow death (the asset loses major players and demand / supply is given into the hands of “the majority of those waiting for XXX, who will never be”), that is, depreciation and scam.
The previous legend of prospects does not matter, as the focus of attention of the crowd shifts to other freshly created similar assets and marketing to attract “fresh blood” of new stupid money. All new assets are created, and most importantly advertising, at the expense of profits from the previous ones, only on a large scale. This is a disguised Ponzi scheme, which everyone agrees with, as they are sure that they will not be “the last”.
Linear for clarity.
Local game.

#Dot also same With Tia 20$ coming soon CRYPTOCAP:DOT BINANCE:DOTUSDT.P BINANCE:DOTUSDT
KUCOIN:DOTUSDT
### **1. Fibonacci Analysis**
Levels Identified**:
0% (high)**: **11.889** (recent high point).
- **0.236**: **9.928**.
- **0.5**: **7.735** (current price zone).
- **0.618**: **6.754**.
- **0.65**: **6.488** (golden pocket).
- **0.786**: **5.358**.
- **1 (low)**: **3.580** (recent low point).
Current Price Action**:
The price is sitting near the **0.5 Fibonacci level (7.735)**, a commonly used support/resistance level.
The annotation suggests this is a buying opportunity due to the convergence of technical factors.
---
### **2. Key Support and Resistance Zones**
Support Zones**:
- **6.754–6.488**: The golden pocket is a high-probability reversal zone.
5.358: Corresponds to the **0.786 Fibonacci level**, adding further support.
- **3.580**: Major historical low and 100% retracement.
Resistance Zones**:
9.928: **0.236 Fibonacci level**, acting as the first key resistance.
11.889: Recent swing high and ultimate target.
---
### **3. Buying Opportunity**
The annotation on the chart identifies the **0.5 Fibonacci level (7.735)** as an optimal buying zone. The reasoning is likely due to:
Confluence with the support zone.
Fibonacci retracement aligning with the trend.
---
### **4. Potential Price Scenarios**
Bullish Scenario**:
If the price holds above **7.735** and confirms support, it could target **9.928** (0.236 Fibonacci level).
A breakout above **9.928** opens the path to the recent high of **11.889**.
Bearish Scenario**:
A breakdown below **6.754–6.488** (golden pocket) could send the price toward **5.358** or lower.
---
### **5. Strategy**
- **Entry**:
Enter around the **7.735** level.
- **Stop-Loss**:
- Below **6.488** (below the golden pocket).
- **Targets**:
Target 1: **9.928**.
Target 2: **11.889**.
---
### **6. Indicators to Confirm Trade**
RSI: Check if it shows oversold conditions near the current level.
Volume: Increasing volume near **7.735** confirms buying interest.
MACD: Look for bullish crossovers to confirm momentum.

TIA NEW UPDATE (1D)Due to tokenomics issues, TIA dropped along with the market.
Now, we’ve prepared a new update for TIA. At each target, secure a portion of your profit and lock it in.
By analyzing the TIA chart, it appears to be forming a large diametric pattern.
This diametric is likely part of wave D.
It seems TIA intends to form wave E of this diametric.
As long as the green zone is maintained, it can move towards the targets.
The targets are marked on the chart.
Closing a daily candle below the invalidation level will invalidate this analysis.
For risk management, please don't forget stop loss and capital management
Comment if you have any questions
Thank You

Tia is good position for buying hello guys
This token is placed in a small bullish back channel after a deep correction.
According to the definition of the support range of the bottom of the channel, we expect it to grow up to the specified goals in a short period of time.
This analysis is only technically reviewed.
Be successful and profitable.

#TIA (SPOT) entry ( 4.200- 4.800) T.(14.000) SL(4.161)BINANCE:TIAUSDT
#TIA/ USDT
Entry ( 4.200- 4.800)
SL 1D close below 4.161
T1 6
T2 10
T3 14
______________________________________________________________
Golden Advices.
********************
* collect the coin slowly in the entry range.
* Please calculate your losses before the entry.
* Do not enter any trade you find it not suitable for you.
* No FOMO - No Rush , it is a long journey.
Useful Tags.
****************
My total posts
www.tradingview.com
1Million Journey
www.tradingview.com
www.tradingview.com
**********************************************************************************************
#Manta #OMNI #DYM #AI #IO #XAI #ACE #NFP #RAD #WLD #ORDI #BLUR #SUI #VOXEL #AEVO #VITE #APE #RDNT #FLUX #NMR #VANRY #TRB #HBAR #DGB #XEC #ERN #ALT #IO #ACA #HIVE #ASTR #ARDR #PIXEL #LTO #AERGO #SCRT #ATA #HOOK #FLOW #KSM #HFT #MINA #DATA #SC #JOE #RDNT #IQ #CFX #BICO #CTSI #KMD #FXS #DEGO #FORTH #AST #PORTAL #CYBER #RIF #ENJ #ZIL #APT #GALA #STEEM #ONE #LINK #NTRN #COTI #RENDER #ICX #IMX #ALICE #PYR #PORTAL #GRT #GMT #IDEX #NEAR #ICP #ETH #QTUM #VET #QNT #API3 #BURGER #MOVR #SKL #BAND #ETHFI #SAND #IOTX #T #GTC #PDA #GMX #REZ #DUSK #BNX #SPELL #POWR #JOE #TIA
