ORDI BREAKOUT ALERTORDI is trying to breakout and is currently trading around upper band of symmetric triangle, targets are 78, 84 & 96.
TIAUSDT

TIA BULLISH MOVE AHEADTIA is currently trading above upper band of symmetrical triangle, another bullish wave is expected.

Celestia - to the sky ?Celestia has the potential to grow into a top15/20 mcap project
Taking this into account + the technical analysis with a retest of RSI50 on the 3D TF, that gives us a swing idea with the idea of a possible acceleration on Total 3
Final tp would be just under 100usd - with intermediate at the fib ext levels

TIAUSDTsweeps are long entries from here
market grind down looks nearly over
shorts have been piling up on btc too apparently
not wise given 1.2T spending approved which is exeedingly risk on for all alts to USD
spending continues
inflation hedges grind higher..
bid for eth and btc mean more alternative alts probably grind up from here also...
this gem L1 has hardly dipped since its inception i doubt it lasts too long..

TIA/USDT It required break to switch back to be Bullish for TIA!💎 TIA has recently exhibited significant market dynamics. Currently, TIA is encountering resistance, necessitating a break and reclamation of price above this level to probability trigger a bullish reversal and continue the upward movement towards our target area.
💎 However, if TIA fails to overcome the resistance and experiences rejection, there's a likelihood of a retracement to test the support area within the range of $11.5 to $10.5.
💎 When TIA reaches the support area, it's crucial for it to bounce as this zone holds considerable significance. Failure to sustain this support level could result in further downward movement for the price.

TIA is ready to fly!!!The correction is done in my eyes. Will this be the first wave being wave 5 of 1 and things could get BUCK wild after that!!!
You know people will be shorting it as it pumps and they are already shorting it!!
NOT FINANCIAL ADVICE!!!!

short TIACelestia broke through the support level. The bearish movement to support level at $8.89 is expected to happen.

TIA/USDTBINANCE:TIAUSDT
This idea has a medium-term profit target.
All targets are indicated on the graph.
- Risk 1% on deposit
- R/R 1/2
P.S (This is not an investment recommendation, this is my personal opinion.)

TIA is at the key Support zoneTIA is at the key Support zone
🔵Entry Zone 13.72 - 14.07
🔴SL 12.3444
🟢TP1 15.0352
🟢TP2 16.7800
🟢TP3 18.5288
Risk Warning
Trading Forex, CFDs, Crypto, Futures, and Stocks involve a risk of loss. Please consider carefully if such trading is appropriate for you. Past performance is not indicative of future results.
If you liked our ideas, please support us with your likes 👍 and comments.

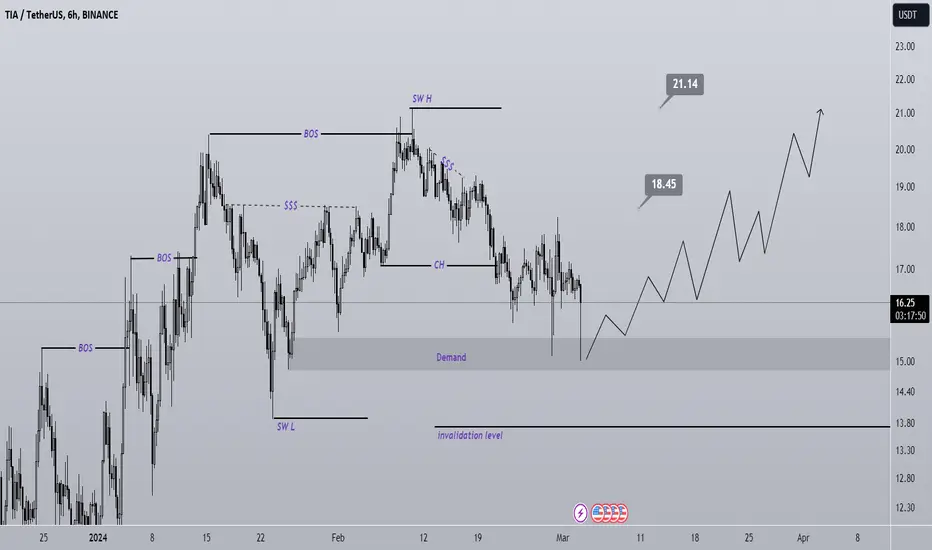
TIA has reached a valuable rangeTIA has reached a valuable range. By maintaining the specified demand, it can move towards the specified targets on the chart.
Closing a daily candle below the invalidation level will violate the analysis.
Note that the financial market is risky, so:
Do not enter any position without confirmation and trigger.
Do not enter a position without setting a stop.
Do not enter a position without capital management.
When we reach the first TP, save some profit and try to move the stop continuously in the direction of your profit.
If you have any comments please post them, comments will help us improve our performance
Thanks
TIA: buy in low level📊Analysis by AhmadArz:
🔍Entry: 15.79
🛑Stop Loss: 14.86
🎯Take Profit: 16.71-17.48-18.24
🔗"Uncover new opportunities in the world of cryptocurrencies with AhmadArz.
💡Join us on TradingView and expand your investment knowledge with our five years of experience in financial markets."
🚀Please boost and💬 comment to share your thoughts with us!

TIA: Trendline BreakoutTrendline Breakout ( Daily Chart ). Strength in the Background : Hidden Bullish Divergence.
.....................................................................................................................
We are not registered or licensed in any jurisdiction whatsoever to provide investing advice or anything of an advisory or consultancy nature.
and are therefore are unqualified to give investment recommendations.
Always do your own research and consult with a licensed investment professional before investing.
This communication is never to be used as the basis of making investment decisions, and it is for entertainment purposes only.

TIA ANALYSIS (6H)From where we entered start on the chart, we have had a symmetric, now we seem to be in the F wave of this symmetric, and it is expected to start from the green area of the bullish wave G of this symmetric and move towards the targets.
Closing a daily candle below the invalidation level will violate the analysis.
For risk management, please don't forget stop loss and capital management
When we reach the first target, save some profit and then change the stop to entry
Comment if you have any questions
Thank You

long TIACelestia broke through the short-term descending trendline. The bullish trend is expected to continue and reach the resistance level at $20.6


$TIA strong run until halvingI see the full crypto market to remain bullish until the halving. similar to Coinbase listing the halving will mark the pico top for this cycle. a good 30% correction all over the board and we continue the cycle later in mid year.

#TIA/USDT lONG#TIA
The price is moving in a downward channel on a 1-hour frame
We have a breakout to the top of the Moving Average 100
The rise is expected to continue to complete the model based on 3 goals
Entry price is 18.25
First goal 19.07
Second goal 19.71
Third goal 20.39

TIA/USDT - TIA: BBand Breakout◳◱ On the $TIA/ CRYPTOCAP:USDT chart, the Bband Breakout pattern suggests a consolidation phase that could precede a trend continuation or reversal. Traders might observe resistance around 18.09 | 19.79 | 23.03 and support near 14.85 | 13.3 | 10.06. Entering trades at 17.31 could be strategic, aiming for the next resistance level.
◰◲ General info :
▣ Name: TIA
▣ Rank: 1897
▣ Exchanges: Binance, Kucoin, Bybit, Huobipro, Gateio, Mexc
▣ Category/Sector: N/A
▣ Overview: TIA project overview is currently unavailable. I'll try to update this in the upcoming analysis.
◰◲ Technical Metrics :
▣ Mrkt Price: 17.31 ₮
▣ 24HVol: 62,707,138.361 ₮
▣ 24H Chng: 0.232%
▣ 7-Days Chng: -17.13%
▣ 1-Month Chng: -41.32%
▣ 3-Months Chng: -43.37%
◲◰ Pivot Points - Levels :
◥ Resistance: 18.09 | 19.79 | 23.03
◢ Support: 14.85 | 13.3 | 10.06
◱◳ Indicators recommendation :
▣ Oscillators: NEUTRAL
▣ Moving Averages: STRONG_BUY
◰◲ Technical Indicators Summary : BUY
◲◰ Sharpe Ratios :
▣ Last 30D: N/A
▣ Last 90D: N/A
▣ Last 1-Y: N/A
▣ Last 3-Y: N/A
◲◰ Volatility :
▣ Last 30D: N/A
▣ Last 90D: N/A
▣ Last 1-Y: N/A
▣ Last 3-Y: N/A
◳◰ Market Sentiment Index :
▣ News sentiment score is N/A
▣ Twitter sentiment score is N/A
▣ Reddit sentiment score is N/A
▣ In-depth TIAUSDT technical analysis on Tradingview TA page
▣ What do you think of this analysis? Share your insights and let's discuss in the comments below. Your like, follow and support would be greatly appreciated!
◲ Disclaimer
Please note that the information and publications provided are for informational purposes only and should not be construed as financial, investment, trading, or any other type of advice or recommendation. We encourage you to conduct your own research and consult with a qualified professional before making any financial decisions. The use of the information provided is solely at your own risk.
▣ Welcome to the home of charting big: TradingView
Benefit from a ton of financial analysis features, instruments and data. Have a look around, and if you do choose to go with an upgraded plan, you'll get up to $30.
Discover it here - affiliate link -

TIA has formed a flag patternTIA has formed a flag pattern
🔵Entry Zone 16.30 - 16.85
🔴SL 14.8174
🟢TP1 17.9517
🟢TP2 19.8919
🟢TP3 22.0188
Risk Warning
Trading Forex, CFDs, Crypto, Futures, and Stocks involve a risk of loss. Please consider carefully if such trading is appropriate for you. Past performance is not indicative of future results.
If you liked our ideas, please support us with your likes 👍 and comments.

TIA/USDT descending channel bullish horizons? 👀 🚀 TIA Analysis💎 Paradisers, brace yourselves for an enthralling venture with #TIAUSDT! It's stamping its presence in a support zone, signaling a potential bullish journey ahead.
💎 Having escaped a descending channel, #TIA is on the rise. Currently, it's mustering strength for a bullish breakout from the $15.25 support zone, with aspirations to overcome formidable resistance levels.
💎 Should this bullish wave persist, we're eyeing LSE:TIA to take on the $18.15 resistance zone. Breaking through this barrier could pave the way to tackle even loftier resistance heights.
💎 Conversely, should #TIA face hurdles and begin to falter, a bullish maneuver from the $14.09 support level could become our strategic response. However, dropping below this critical threshold might spell a significant downturn.

TIAUSDT - POTENTIAL SETUPTIAUSDT is in strong bullish trend.
As the market is consistently printing new HHs and HLs on higher TF.
currently the market is retracing a bit after last HH on daily, if the market successfully sustain this bullish confluence the next leg high could go for new HH.
we will enter at 17.8871


TIA / USDT - Bearish Signs Bearish signs:
1: Break 200 moving average
2: Break VWAP
If price continue down
Target
1. 14.7860 level
