TIA/USDT – Major Breakout Incoming? Reversal in Sight!🔍 Full Technical Analysis (1D Timeframe):
TIA/USDT is approaching a critical turning point after experiencing a strong downtrend since December 2024. The chart clearly forms a Falling Wedge pattern — a classic bullish reversal signal known for explosive breakouts when confirmed.
Currently, the price is testing a key confluence zone around $2.00 – $2.30, where:
A major horizontal resistance meets
A long-term descending trendline (yellow), acting as dynamic resistance since the last local high.
🚀 Bullish Scenario (Confirmed Breakout):
If TIA successfully breaks and closes above the $2.30 – $2.78 range with strong volume, it could trigger a major mid-term rally. The potential upside targets are aligned with previous structural resistance levels:
Target Resistance Level
🎯 Target 1 $3.34
🎯 Target 2 $4.17
🎯 Target 3 $5.41
🎯 Target 4 $6.61
🎯 Target 5 (Extended) $8.87 – $9.28 (Major Weekly Supply Zone)
✅ Additional Bullish Confirmation: A volume breakout + RSI moving into the 50–70 zone would strengthen the bullish case.
🛑 Bearish Scenario (Fake Breakout Risk):
If the price gets rejected again from the descending trendline and fails to close above $2.00, the bearish pressure may push the price back toward key demand zones:
First support zone: $1.60
Last major defense: $1.31 (the current swing low)
This could lead to a double bottom structure before any meaningful trend reversal happens.
📐 Pattern Breakdown:
Pattern: Falling Wedge Breakout Pattern
Duration: Over 7 months of consolidation below trendline
Risk-to-Reward Potential: Highly favorable if breakout is confirmed
🧠 Market Sentiment:
Many altcoins are showing early signs of bottoming out and accumulation.
TIA could become a breakout leader in the next wave if it clears the current resistance cluster.
Expect momentum traders to join in once a solid bullish candle closes above the wedge.
✅ Conclusion:
TIA/USDT is at a technically golden level. A breakout from this falling wedge structure could ignite a multi-stage rally. However, caution is advised: wait for a confirmed breakout and manage risk in case of a failed breakout attempt.
#TIAUSDT #CryptoBreakout #FallingWedge #AltcoinRally #ReversalPattern #BreakoutTrade #CryptoTA #MomentumTrade #Altseason #TechnicalAnalysis #CryptoSignals
Tiausdtidea

TIAUSDT Forming Descending TriangleTIAUSDT is gaining attention as traders and investors look for fresh opportunities in the altcoin market. With good volume backing recent moves, this crypto pair shows promising potential for a 40% to 50%+ gain in the near term. Although there’s no specific pattern visible right now, the price action suggests that TIA could be entering an accumulation phase before its next leg up. As the market sentiment for altcoins improves, TIAUSDT is likely to benefit from renewed buying interest.
Celestia (TIA) is a modular blockchain project designed to tackle scalability and customization in the crypto space. Its unique architecture allows developers to deploy their own blockchains with ease, making it a key player in the next generation of decentralized applications. This innovation, combined with growing community support, is a positive fundamental catalyst for the TIA token, which could translate into solid price action in the coming weeks.
Technical traders are closely watching support and resistance levels to catch the next breakout move. The increasing trading volume and investor interest are strong signals that a significant move could be on the horizon. Keeping an eye on upcoming project milestones, network upgrades, or partnership announcements could help you stay ahead of the curve and position yourself for the anticipated 40% to 50% gain.
✅ Show your support by hitting the like button and
✅ Leaving a comment below! (What is You opinion about this Coin)
Your feedback and engagement keep me inspired to share more insightful market analysis with you!

TIA Scalp trade setupwait for the retest of breakout, set sl & tp. While on swing trade will long below 1.31 and tp 2.0$, TIA is extremely oversold, So less affected by BTC.

TIA/USDT – Trendline breakout watchTIA/USDT – Trendline breakout watch
TIA has broken above the descending trendline, indicating a potential shift in momentum. If the price manages to hold above the breakout zone with stability, we can expect a bullish move ahead.
A successful retest and hold above the trendline could trigger a pump of around 15–30% in the coming sessions.
Key levels to watch:
* Breakout support zone
* Confirmation with volume
* Immediate resistance ahead
Monitor closely — holding the breakout could open the door for a solid upside move.

TIAUSDT 1D AnalysisTIA ~ 1D Analysis
#TIA Buy again from here if you still have confidence in this coin with a short term target of at least 15%+ from here.

$TIA pullback looks healthy for next leg up !!LSE:TIA is retesting the breakout zone perfectly
After a clean breakout from the falling wedge structure, the price is now pulling back into the key demand area.
I expect this zone to hold and if it does, we could see a strong move toward $5+ in the coming days.
Keep a close eye on this level, the next move could be explosive! 🚀
Like & Retweet if you're bullish!
#TIA #CRYPTOMOJO_TA

TIAUSDT 2D AnalysisTIA ~ 2D Analysis
#TIA Buy gradually from here if you still have confidence in this coin with a short term target of at least 20%+ from here

TIAUSDT 1D AnalysisTIA ~ 1D Analysis
#TIA Buy after successfully penetrating this resistant line with a short -term target of at least 10%+.

TIAUSDT — 2025 Technical RoadmapTIAUSDT — Daily Technical Roadmap
🕞 60-Second Read
Trend on the 1-D chart is still structurally bearish ; price (spot 2.865 USDT) just carved a higher-low off the 2.44 vector block and is knocking on the Yearly BC lid. Two large upside voids now beckon.
Hot-Zone #1 – 2.60 → 2.44 (1 D + 4 H vector demand): stacked fresh liquidity, 9-15 % under spot.
Hot-Zone #2 – 2.985 (Yearly BC): first breaker & range cap, only 4 % above; a daily close above here opens the air-pocket to 4.27.
Hot-Zone #3 – 4.932 → 6.947 (Yearly Pivot ↔ Yearly TC): macro supply shelf guarding a 72-142 % rally window.
💧 Liquidity & Imbalance
Daily vector 7.85 (77 % fill-rate inside 60 d).
Stacked 4 H vectors 9.86 / 9.83 = 2.5 % supply shelf.
Demand stack 2.69 – 2.44 only 18 d old.
⚡ Volatility & Momentum
GMMA Z-Score curling up from −2 σ; short ribbons still under long ribbons – suggests pause, not reversal.
🎲 Probability Dashboard
HTF Structure −3
Liquidity voids +1
Momentum −1
Vol-regime 0
Bear / Neutral / Bull ≈ 42 % / 33 % / 25 %
📈 Trade Playbook
Strategy 1
1. Layered Limit Grid – Aggressive Counter-Trend Long
Entry layers (size %):
2.60 – 40 % of your allocated TIAUSDT size
2.44 – 30 %
2.05 – 20 %
1.90 – 10 %
SL = 1.75 (≈ 1 ATR below extreme demand)
TP ladder:
2.985 – 25 % off-load
3.722 – 25 %
4.932 – 25 %
6.947 – 15 %
7.849 – 10 %
Weighted R:R ≈ 4.3
Strategy 2
2. Layered Limit Grid – Conservative Breakout Long
Trigger: daily close > 3.722 (Yearly Low reclaim), then place grid orders.
Entry layers (size %):
3.75 – 40 %
3.55 – 30 %
3.25 – 20 %
2.985 – 10 %
SL = 2.70
TP ladder:
4.932 – 30 %
6.947 – 30 %
7.849 – 20 %
9.860 – 15 %
12.432 – 5 %
Weighted R:R ≈ 3.8
⚠️ Risk Radar
Low-float token – slippage risk on size.
Macro event: FOMC 1 May → volatility spike possible.
BTC options IV rising – spill-over risk to alts.
Price must conquer 2.985 to open the upside magnet trail toward 4.27 → 4.93. Failure keeps 2.60 → 1.90 demand stack in play before any durable markup.
Not financial advice – do your own research & manage risk.

Is TIA About to Break Down Hard? Traders Beware Before It’s lateYello, Paradisers! Did you catch the recent bullish rally on #TIAUSDT? It’s been delivering solid gains over the past couple of days, giving traders reason to celebrate. But what if we told you that this rally might just be setting up a classic trap—one that smart money is already preparing to take advantage of? The technical structure forming right now suggests a high probability of a reversal, and if you’re not paying attention, you might end up on the wrong side of the move.
💎#TIAUSDT, at the core of setup is a developing a probable Bearish Gartley pattern. These harmonic structures are rare but extremely powerful when they align with multiple technical confirmations and that’s exactly what we’re seeing here. With the recent move upward, TIAUSDT appears to have completed its C leg, a critical part of the Gartley structure. This sets the stage for the D leg, which typically completes much lower. The price reacted strongly from the C leg area, which also happens to line up perfectly with a previous local high adding even more probability to the resistance at that zone.
💎This resistance isn't just horizontal there's a dynamic element at play as well. The 21-period EMA on multiple timeframes is currently acting as a ceiling for price action. When a key moving average starts rejecting price repeatedly, it often signals that the current trend is losing steam and this dynamic resistance only strengthens the case for a downside move from here.
💎Looking deeper, the bearish signs are confirmed by momentum indicators. The RSI on lower timeframes is not only overbought but also showing clear signs of bearish divergence. This divergence occurs when the price continues to make higher highs while RSI starts forming lower highs a classic sign that momentum is weakening. It’s one of the more reliable early warnings that a reversal may be near. In this case, RSI is flashing that warning now, suggesting that buyers may soon run out of fuel.
💎If this bearish probable scenario plays out as expected, the first key level to watch on the downside sits around the 3.278 zone. This minor support may offer a temporary bounce, but if the D leg of the Gartley is to be completed, we could see even deeper price action. This makes the current area extremely sensitive—any weakness from bulls could trigger a fast move downward.
💎However, no pattern is complete without an invalidation level, and for the Bearish Gartley, that comes in around the 3.805 resistance zone. A strong, sustained close above this level would invalidate the bearish setup and signal renewed bullish momentum. Until then, all technical signals are pointing toward caution, especially for those still riding long positions without a tight risk plan.
Stay alert, Paradisers. The market is about to decide. This is a textbook moment where emotions can take over, and late buyers get punished for chasing green candles. That’s why, we are playing it safe right now. If you want to be consistently profitable, you need to be extremely patient and always wait only for the best, highest probability trading opportunities.
MyCryptoParadise
iFeel the success🌴

TIAUSDT 3DTIA ~ 3D Analysis
#TIA Key support that must be maintained. Loss of this support, LSE:TIA price will be more depressed lower.

TIAUSDT – Weak at Key Weekly Level! More Downside Ahead?TIAUSDT – Weak at Key Weekly Level! More Downside Ahead?
“This chart looks weak—momentum favors the downside. But is there a bounce first?”
🔥 Key Insights:
✅ Sitting at a Critical Weekly Zone – A breakdown here could be brutal.
✅ Momentum Looks Bearish – No real strength from buyers.
✅ Only Considering Low-Risk Buys – Fibonacci Green Zone (0-0.5) is the ideal cheap area.
💡 The Smart Plan:
Looking for a Break & Retest Downward – If support cracks, shorts become clear.
Small Risk Buys from the Fibonacci Zone – Only for aggressive traders.
CDV & Volume Profile Must Confirm – No buyers? No trade.
“Weak price action, heavy risk. Only the right levels matter here—watch closely!” 📉🔥⚠️
A tiny part of my runners;
🌊 WAVESUSDT.P: Demand Zone Potential
🟣 UNIUSDT.P: Long-Term Trade
🔵 XRPUSDT.P: Entry Zones
🔗 LINKUSDT.P: Follow The River
📈 BTCUSDT.P: Two Key Demand Zones

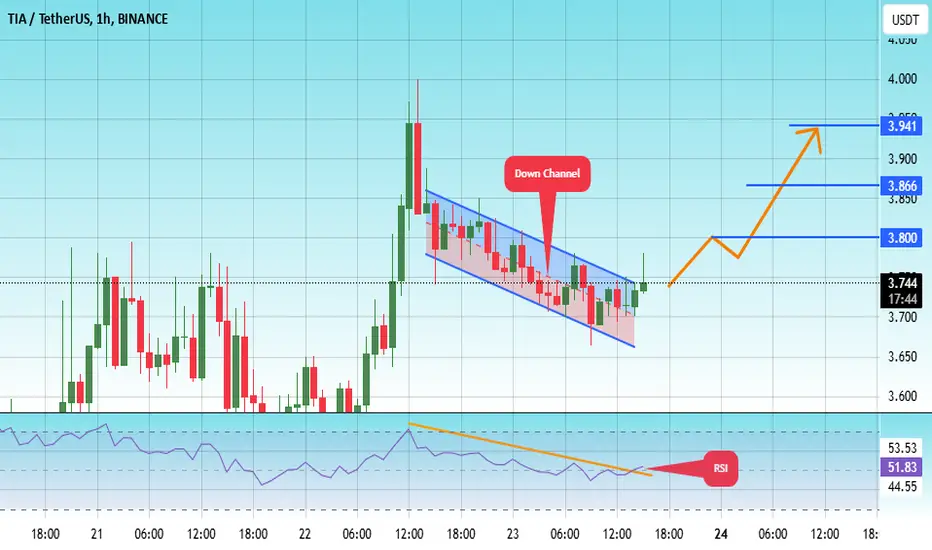
#TIA/USDT#TIA
The price is moving in a descending channel on the 1-hour frame and is adhering to it well and is heading to break it upwards strongly and retest it
We have a bounce from the lower limit of the descending channel, this support is at a price of 3.67
We have a downtrend on the RSI indicator that is about to break and retest, which supports the rise
We have a trend to stabilize above the Moving Average 100
Entry price 3.74
First target 3.80
Second target 3.86
Third target 3.92
TIA target $5.64h time frame
-
Entry: $2.96
TP: $5.64
SL: $2.66
RR: 8.77
-
(1) TIA is still correcting and building the bottom structure after dump on 3rd Feb.
(2) Double bottom is one of the possible structure, the potential right leg is $2.9
(3) Fibonacci provides first target at $4.5 and final target at $5.6
(4) Stop loss once going below $2.66

TIAUSDT 3DTIA ~ 3D Analysis
#TIA This is the lowest support block for now. Buy gradually from here with a minimum target of 15%++.

#TIA/USDT#TIA
The price is moving in a descending channel on the 1-hour frame and is expected to continue upwards
We have a trend to stabilize above the moving average 100 again
We have a descending trend on the RSI indicator that supports the rise by breaking it upwards
We have a support area at the lower limit of the channel at a price of 4.33
Entry price 4.72
First target 4.90
Second target 5.12
Third target 5.47

TIA / USDT : poised for a breakout as it approaches resistance tia/usdt: poised for a breakout as it approaches trendline resistance
TIA/USDT is gearing up for an intriguing move 📈 as it holds a crucial middle support level and heads towards trendline resistance 📊. The price action suggests a potential breakout could be on the horizon 💥. If this breakout occurs, we might witness a robust bullish trend emerge 🚀. Keep a close watch 👀 on this pair and wait for confirmation before taking action.
Key insights:
1. Middle support: TIA/USDT is currently maintaining a key support level, which could provide a solid foundation for the upcoming rally.
2. Trendline resistance: The pair is nearing a significant trendline that has capped upward movements in the past. A breach above this could signal a strong upward trajectory.
3. Bullish indicators: Momentum indicators, including RSI and MACD, are showing positive trends ⚡, bolstering the case for a breakout.
Steps to confirm the breakout:
- Monitor for a clear 4H or daily candle closing above the trendline 📍.
- A notable increase in trading volume during the breakout can indicate strong buyer interest 📊.
- A retest of the broken resistance turning into a new support area will add validity to the move ✅.
- Stay alert for potential false breakouts, such as sudden reversals or wicks above the trendline ⚠️.
Risk management strategies:
- Implement stop-loss orders to manage risk effectively 🔒.
- Ensure your position sizing aligns with your overall trading strategy 🎯.
This analysis is for educational purposes only and not financial advice. Always conduct your own research (DYOR) 🔍 before making investment decisions.

TIAUSDT - great targets aheadweekly chart displays breakout the descending channel since about 12 months!!
it's just begaining .. big move did'nt started yet
target around 60$🎯

TIAUSDT Breaks Resistance: Strong Bullish Move AheadTIAUSDT Technical analysis update
TIAUSDT has been consolidating for the past 160 days, repeatedly testing the trend resistance line. Today, the price broke above the resistance line on the daily chart and crossed above the 100 EMA. A strong bullish move is anticipated in the coming days.
Buy zone : Below $6.30
Stop loss : $5.32
Take Profit 1: $7.10
Take Profit 2: $8.50
Take Profit 3: $11.85

TIAUSDTTIA ~ 3D
#TIA Currently moving on this descending channel,. If you want to buy this coin,. It's best to wait for this descending channel to be successfully penetrated. with a minimum target of 20%+

TIA target $1212h time frame
-
Entry: $12
TP: $4.8
SL: $3.59
RR: 5.49
-
(1) TIA is building a big accumulation with a polyline structure
(2) Will be very strong once breaking above this structure
(3) Fib extension provides final target at $12
(4) Stop loss once going below $3.59

TIAUSDTTIA ~ 2D
#TIA for now it is trying to break out this descending pattern.
if you have Conviction on this coin,. Make purchases in stages from here.

long setup $TIAtia was a little bit choppy butt if you take a close look it printed a patter (cup and handle) i assume this will play out en even go higher as the profit target.
this is my setup for it.
CHEERS!
