TIA/USDT Testing Downtrend Line: Reversal or More Downside?Summary:
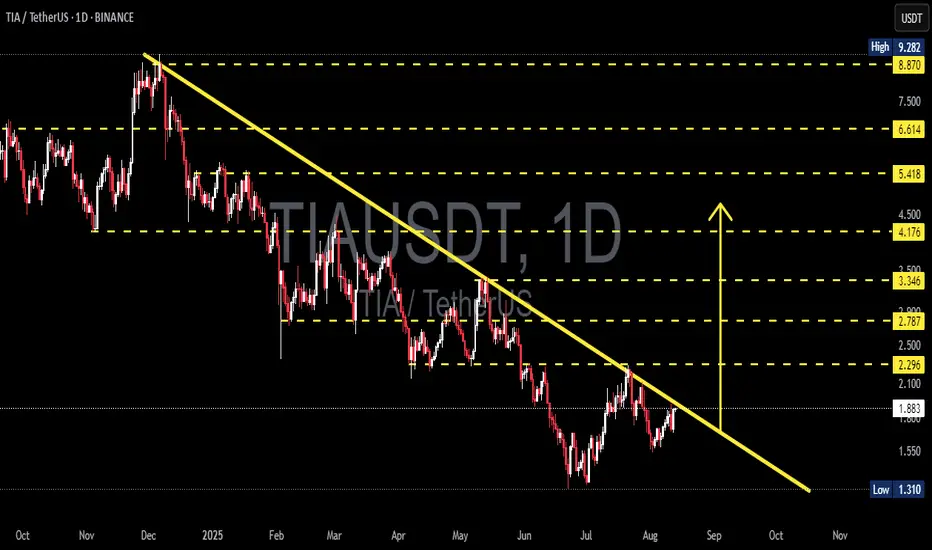
TIA price remains below the main descending trendline (yellow) drawn from the Dec–Jan peak. Price is currently hovering around $1.87–$2.00, right under the key $2.00–$2.10 resistance zone and the trendline. This is a decision zone: a breakout could trigger a reversal, while rejection could extend the bearish trend.
---
Key Structure Levels (from chart)
Support: $1.75–$1.80 (minor), $1.62, $1.31 (major low).
Resistance: $2.00–$2.10, $2.296, $2.787, $3.346, $4.176, $5.418, $6.614, $8.870 (near ATH $9.282)**.
---
Pattern & Context
Daily downtrend still dominant (series of lower highs) with the descending trendline acting as dynamic resistance.
Since mid-July, price has formed higher lows from $1.31 → gradually consolidating toward the trendline.
If $2.10 is treated as a “neckline” of a short-term accumulation, measured move = (2.10 − 1.31) ≈ $0.79 → conservative upside target ≈ $2.90 (aligns with $2.787 level).
---
Bullish Scenario
Trigger:
Daily close above the trendline + $2.10, ideally followed by a retest of $2.00–$2.10 as support.
Step targets:
$2.296 → $2.787 → $3.346 → $4.176.
Structure projection: ≈ $2.90 (around $2.787).
Invalidation / Risk:
Daily close back below $1.80 after breakout, or a failed breakout above $2.10 without follow-through.
---
Bearish Scenario
Trigger:
Strong rejection at the trendline / $2.00–$2.10 with a decisive bearish candle.
Downside targets:
$1.80 → $1.62 → $1.31 (key low).
Break below $1.31 opens deeper bearish territory ($1.20–$1.00 psychological zone).
Invalidation / Risk:
Daily close above $2.10 would cancel the short-term rejection setup.
---
Action Plan (not financial advice)
Bullish: Wait for confirmation above $2.10 with volume/follow-through; target $2.29 / $2.79 / $3.35; manage risk below retest level.
Bearish: Watch for pin bar/engulfing rejection at the trendline/$2.00–$2.10; target $1.80 / $1.62; invalidation if daily closes > $2.10.
#TIA #Celestia #TIAUSDT #CryptoTA #PriceAction #SupportResistance #Trendline #BreakoutWatch #DailyTimeframe #BearishVsBullish
Tiausdtlong
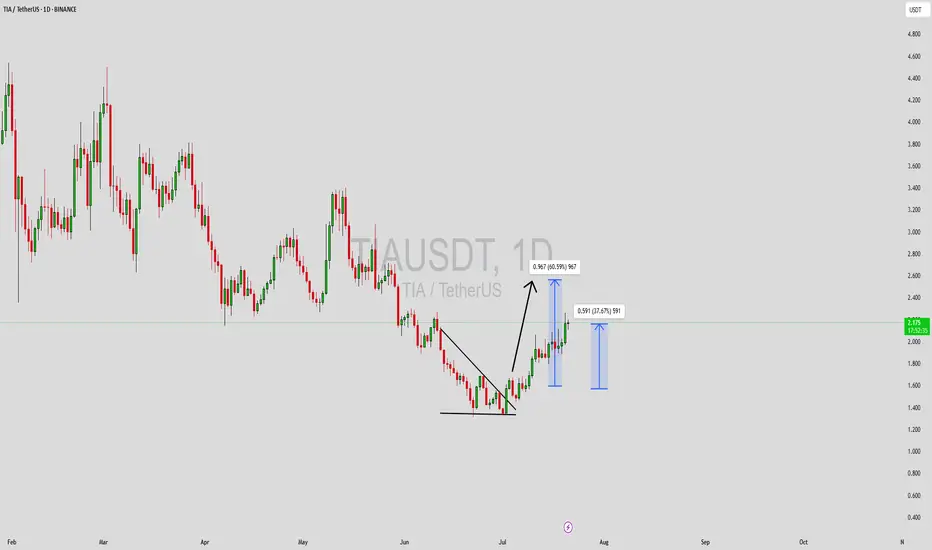
TIAUSDT Forming Falling WedgeTIAUSDT has recently shown a bullish breakout from a falling wedge structure on the daily timeframe—a pattern known for its strong reversal signals. This move is supported by rising trading volume, signaling fresh momentum entering the market. With current price action pushing higher, the short-term upside potential targets lie around the 50% to 60% gain zone, which aligns well with past resistance levels marked on the chart. This upward shift also breaks the series of lower highs that previously dominated the chart, suggesting a confirmed trend reversal.
From a broader perspective, TIA has built strong fundamentals as part of the Cosmos ecosystem, which gives it significant long-term value potential. The recent surge in price has been accompanied by increased community activity and mentions across social media platforms, which may indicate growing investor sentiment and renewed project interest. The consolidation phase appears to have ended, and TIA is now pushing for a sustained bullish leg.
Market participants should keep an eye on support retests and breakout validations as the rally progresses. The measured target after this wedge breakout puts TIA in a good position for a strong Q3 performance. With macro tailwinds favoring altcoins and mid-cap blockchain projects regaining traction, TIA could be setting up for an extended upward move.
✅ Show your support by hitting the like button and
✅ Leaving a comment below! (What is You opinion about this Coin)
Your feedback and engagement keep me inspired to share more insightful market analysis with you!
TIA/USDT – Major Breakout Incoming? Reversal in Sight!🔍 Full Technical Analysis (1D Timeframe):
TIA/USDT is approaching a critical turning point after experiencing a strong downtrend since December 2024. The chart clearly forms a Falling Wedge pattern — a classic bullish reversal signal known for explosive breakouts when confirmed.
Currently, the price is testing a key confluence zone around $2.00 – $2.30, where:
A major horizontal resistance meets
A long-term descending trendline (yellow), acting as dynamic resistance since the last local high.
🚀 Bullish Scenario (Confirmed Breakout):
If TIA successfully breaks and closes above the $2.30 – $2.78 range with strong volume, it could trigger a major mid-term rally. The potential upside targets are aligned with previous structural resistance levels:
Target Resistance Level
🎯 Target 1 $3.34
🎯 Target 2 $4.17
🎯 Target 3 $5.41
🎯 Target 4 $6.61
🎯 Target 5 (Extended) $8.87 – $9.28 (Major Weekly Supply Zone)
✅ Additional Bullish Confirmation: A volume breakout + RSI moving into the 50–70 zone would strengthen the bullish case.
🛑 Bearish Scenario (Fake Breakout Risk):
If the price gets rejected again from the descending trendline and fails to close above $2.00, the bearish pressure may push the price back toward key demand zones:
First support zone: $1.60
Last major defense: $1.31 (the current swing low)
This could lead to a double bottom structure before any meaningful trend reversal happens.
📐 Pattern Breakdown:
Pattern: Falling Wedge Breakout Pattern
Duration: Over 7 months of consolidation below trendline
Risk-to-Reward Potential: Highly favorable if breakout is confirmed
🧠 Market Sentiment:
Many altcoins are showing early signs of bottoming out and accumulation.
TIA could become a breakout leader in the next wave if it clears the current resistance cluster.
Expect momentum traders to join in once a solid bullish candle closes above the wedge.
✅ Conclusion:
TIA/USDT is at a technically golden level. A breakout from this falling wedge structure could ignite a multi-stage rally. However, caution is advised: wait for a confirmed breakout and manage risk in case of a failed breakout attempt.
#TIAUSDT #CryptoBreakout #FallingWedge #AltcoinRally #ReversalPattern #BreakoutTrade #CryptoTA #MomentumTrade #Altseason #TechnicalAnalysis #CryptoSignals

Free signal hello friends👋
🌟Considering that the price reaches an important weekly support, the price is expected to grow, so you can enter into a transaction with risk and capital management and move to the specified goals.
🔥Follow us for more signals🔥
*Trade safely with us*

TIAUSDT Forming Descending TriangleTIAUSDT is gaining attention as traders and investors look for fresh opportunities in the altcoin market. With good volume backing recent moves, this crypto pair shows promising potential for a 40% to 50%+ gain in the near term. Although there’s no specific pattern visible right now, the price action suggests that TIA could be entering an accumulation phase before its next leg up. As the market sentiment for altcoins improves, TIAUSDT is likely to benefit from renewed buying interest.
Celestia (TIA) is a modular blockchain project designed to tackle scalability and customization in the crypto space. Its unique architecture allows developers to deploy their own blockchains with ease, making it a key player in the next generation of decentralized applications. This innovation, combined with growing community support, is a positive fundamental catalyst for the TIA token, which could translate into solid price action in the coming weeks.
Technical traders are closely watching support and resistance levels to catch the next breakout move. The increasing trading volume and investor interest are strong signals that a significant move could be on the horizon. Keeping an eye on upcoming project milestones, network upgrades, or partnership announcements could help you stay ahead of the curve and position yourself for the anticipated 40% to 50% gain.
✅ Show your support by hitting the like button and
✅ Leaving a comment below! (What is You opinion about this Coin)
Your feedback and engagement keep me inspired to share more insightful market analysis with you!

TIA Scalp trade setupwait for the retest of breakout, set sl & tp. While on swing trade will long below 1.31 and tp 2.0$, TIA is extremely oversold, So less affected by BTC.

TIAUSDT 1D AnalysisTIA ~ 1D Analysis
#TIA Buy again from here if you still have confidence in this coin with a short term target of at least 15%+ from here.

$TIA pullback looks healthy for next leg up !!LSE:TIA is retesting the breakout zone perfectly
After a clean breakout from the falling wedge structure, the price is now pulling back into the key demand area.
I expect this zone to hold and if it does, we could see a strong move toward $5+ in the coming days.
Keep a close eye on this level, the next move could be explosive! 🚀
Like & Retweet if you're bullish!
#TIA #CRYPTOMOJO_TA

TIA SIGNALSHello friends
As you can see, this currency has a beautiful chart and the technical analysis we did is that if the valid resistance is broken, we can open a buy trade with capital and risk management and move with it to the specified targets.
*Trade safely with us*

TIAUSDT 2D AnalysisTIA ~ 2D Analysis
#TIA Buy gradually from here if you still have confidence in this coin with a short term target of at least 20%+ from here

TIAUSDT 1D AnalysisTIA ~ 1D Analysis
#TIA Buy after successfully penetrating this resistant line with a short -term target of at least 10%+.

#TIA/USDT#TIA
The price is moving within a descending channel on the 1-hour frame, adhering well to it, and is heading towards a strong breakout and retest.
We are experiencing a rebound from the lower boundary of the descending channel, which is support at 2.18.
We are experiencing a downtrend on the RSI indicator that is about to be broken and retested, supporting the upward trend.
We are looking for stability above the 100 Moving Average.
Entry price: 2.27
First target: 2.36
Second target: 2.42
Third target: 2.53

TIAUSDT Bottoming Out?TIAUSDT Technical analysis update
TIAUSDT has been trading within the longest descending channel. The price has once again touched the channel support and also retested the November 2023 support level or bottom. A strong bounce from this zone is likely, and we could potentially see a 100–150% move from the current level.

TIAUSDT 3DTIA ~ 3D Analysis
#TIA Key support that must be maintained. Loss of this support, LSE:TIA price will be more depressed lower.

TIAUSDT – Weak at Key Weekly Level! More Downside Ahead?TIAUSDT – Weak at Key Weekly Level! More Downside Ahead?
“This chart looks weak—momentum favors the downside. But is there a bounce first?”
🔥 Key Insights:
✅ Sitting at a Critical Weekly Zone – A breakdown here could be brutal.
✅ Momentum Looks Bearish – No real strength from buyers.
✅ Only Considering Low-Risk Buys – Fibonacci Green Zone (0-0.5) is the ideal cheap area.
💡 The Smart Plan:
Looking for a Break & Retest Downward – If support cracks, shorts become clear.
Small Risk Buys from the Fibonacci Zone – Only for aggressive traders.
CDV & Volume Profile Must Confirm – No buyers? No trade.
“Weak price action, heavy risk. Only the right levels matter here—watch closely!” 📉🔥⚠️
A tiny part of my runners;
🌊 WAVESUSDT.P: Demand Zone Potential
🟣 UNIUSDT.P: Long-Term Trade
🔵 XRPUSDT.P: Entry Zones
🔗 LINKUSDT.P: Follow The River
📈 BTCUSDT.P: Two Key Demand Zones

TIA | PERFECT Bottom??In the macro, it's clear that TIA has been in a downward trend for an extended period of time. This means, it's a great place to buy - because the bullish cycle is up next.
Trend based indicators are great to identify the immediate predominant pressure on the chart, in this case, bearish. A "Buy" signal in the weekly timeframe would be the first step in the right direction (reversal).
Trend Based Indicator:
Another key indicator to watch is the daily timeframe, when the price begins to trade ABOVE the moving averages - that's when you'll have the first confirmation of a bullish turn around.
Moving Averages:
______________________
BINANCE:TIAUSDT

#TIA/USDT#TIA
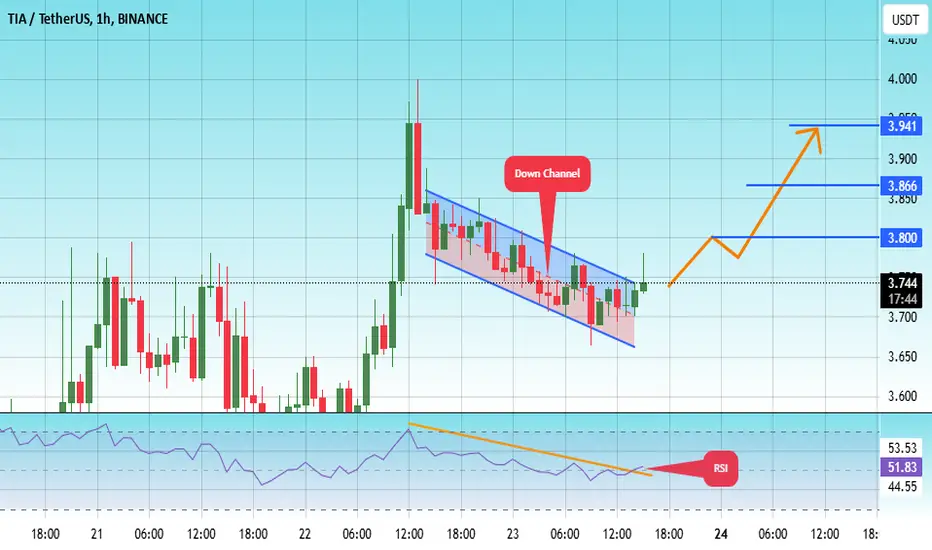
The price is moving in a descending channel on the 1-hour frame and is adhering to it well and is heading to break it upwards strongly and retest it
We have a bounce from the lower limit of the descending channel, this support is at a price of 3.67
We have a downtrend on the RSI indicator that is about to break and retest, which supports the rise
We have a trend to stabilize above the Moving Average 100
Entry price 3.74
First target 3.80
Second target 3.86
Third target 3.92
TIA target $5.64h time frame
-
Entry: $2.96
TP: $5.64
SL: $2.66
RR: 8.77
-
(1) TIA is still correcting and building the bottom structure after dump on 3rd Feb.
(2) Double bottom is one of the possible structure, the potential right leg is $2.9
(3) Fibonacci provides first target at $4.5 and final target at $5.6
(4) Stop loss once going below $2.66

TIAUSDT 3DTIA ~ 3D Analysis
#TIA This is the lowest support block for now. Buy gradually from here with a minimum target of 15%++.

$TIA: Ready to Breakout After 5 Months of Consolidation?
I think LSE:TIA is finally primed for a breakout after spending the last five months consolidating in the tight $4–$6 range. The lows have been respected multiple times, and we're now seeing the buildup of potential for a significant move.
I’m eyeing an entry at $4.85, which would be a perfect spot to load up if we get a retrace into that zone. If it does dip back there, it's a max bid scenario for me.
However, I'm also prepared to jump in a bit higher if needed, especially if I get left behind as the breakout gains momentum. It's a balancing act between waiting for the perfect entry and not missing out on the move entirely.
Let’s see how it plays out—I'm keeping a close watch!

#TIA/USDT#TIA
The price is moving in a descending channel on the 1-hour frame and is expected to continue upwards
We have a trend to stabilize above the moving average 100 again
We have a descending trend on the RSI indicator that supports the rise by breaking it upwards
We have a support area at the lower limit of the channel at a price of 4.33
Entry price 4.72
First target 4.90
Second target 5.12
Third target 5.47

#TIA/USDT#TIA
The price is moving in a descending channel on the 1-hour frame and is expected to continue upwards
We have a trend to stabilize above the moving average 100 again
We have a descending trend on the RSI indicator that supports the rise by breaking it upwards
We have a support area at the lower limit of the channel at a price of 4.65
Entry price 4.70
First target 4.91
Second target 5.10
Third target 5.32

Celestia (TIA/USDT) - "LONG" Spot Margin Trade📈 LONG
Signal Type: (SPOT) ⬆️
💵Margin: 2%
✅Entry level:
$6.2 - $6.9
🎯Target Levels:
1) $7.7
2) $8.8
🚫Stop Loss: $5.749
💰 Leverage (Optional)
‼️Risk= Medium
⚠️Please use the risk management I provided for you accordingly and don't forget about the risk in futures trading. Be sure to adjust Stop Loss/Leverage to your needs.
