Intermediate Trading Strategy - Part 1IMPORTANT NOTE: If you are looking for a shortcut then this is not for you! This is for individuals who are enthusiastic about putting in the time and effort but may lack the structure.
I plan out my trades through in depth technical analysis, risk management and market research. I believe that consistency is the most important factor in regards to trading profitably. A traders success is determined more by the consistency of their approach than it is by the quantity or quality of indicators being used.
Over the long run, a consistent process combined with a sound strategy will net a disciplined trader far greater returns than the market average.
If you have any questions then feel free to leave a comment or send a private message.
Click here for Sawcruhteez’ Trading Process
Before Making an Entry
Identify Trend
Higher highs and higher lows = bull market
Lower highs and lower lows = bear market
Lower highs and higher lows = triangle continuation pattern
Equal highs and equal lows = Consolidation/Range
Tyler Jenks’ Consensio
Price > Short term MA > Long term MA = Bull Market
-I like to use the 50 & 128 day MA’s by default for crypto. For traditional markets I use the 200 MA.
-For short term price movements (1 month or less) I like to use exponential moving averages. 12 & 26 EMA for crypto and for traditional markets the 9 & 21 EMA.
Welles Wilder’s ADX
If ADX > 25 then trending market
If ADX < 20 then no trend is present
If +DI > -DI then bull trend
If -DI < +DI then bear trend
In extreme circumstances I will bet against the trend. This will only happen when the risk:reward is too favorable to pass up.
Identify Time Horizon
Investment
Is this a 10+ year investment? If so then I will dollar cost average my way in and not even look at the charts or listen to the news. Investments are not meant to be babysat, they are meant to develop over time.
Bet it then forget it!
Position Trade
Buy/sell breakouts and attempt to hold on for the duration of the trend. This is done through technical analysis and trailing stop losses. If I am in a position trade I will tend to it daily by looking at charts and managing stop losses. It is not required to ‘baby-sit’ the position by watching it all day and this approach is actively discouraged.
Position traders do not concern themselves with intraday movements. Managing the position too closely will often cause traders to make mistakes they wouldn’t have otherwise such as: taking profit too early or adjusting stop losses in the heat of the moment.
This is my prefered method of trading for a number of reasons. Primarily it is because I like to live a balanced life. I like to be able to set my stop loss and forget about it while I am out playing golf, skiing or at the gym.
Time horizon for a position trade is often a couple months or even a year+
Swing Trade
“Markets do not go straight up, nor do they go straight down.” There is an ebb and a flow to the price movements. Swing traders try to capitalize on the daily - weekly price movements. Is price at resistance? Sell. Is price at support? Buy.
Swing traders have well defined price targets. They can trade within ranges or in trending markets but they generally do not hold through significant resistance in order to speculate on the price movement. If it does breakthrough resistance then they can re enter without as much risk.
Day trade
Mostly scalpers and high frequency robots. In traditional markets the price generally isn’t very volatile on an intra-day basis so most traders will use high leverage. This will allow them to 10X, 50X or even 100X a 1% price movement in the underlying asset.
In crypto the market is volatile enough for day traders to make a very handsome profit without using leverage. This approach is still the extremely risky.
TIME

Crypto Bears Still in Control Until Likely ETF Approval in SeptAs forecasted in my most recent updates, Wave-f is ending around this time and we should be beginning wave-g now. This wave will likely end sometime during September, and will likely end around 6000-4800. The key to look for will be a completed wave-g internal structure (probably a diametric) between the two time targets (Sept 1st-22nd). This time target not only coincides with the end of wave-g, it is also the time target for the end of the larger monthly wave-(d) (in orange). Based on recent news, and a possible positive ETF decision happening around that time, it seems like more consolidation on BTC is likely until then.
At least one of the Direxion ETFs is likely to be approved on September 21st by the SEC. Direxion is a large ETF provider that has brought to market many complex ETF products, and was the very first provider to get 3x Leveraged ETF products approved by the SEC. Their team of experienced and sophisticated financial engineers is very likely to have noticed a shift in the SEC's stance towards cryptocurrency and would have likely been one of the first to present products that capitalizes on that. This highly experienced team would likely have not even proposed this ETF to the SEC had they not been extremely confident that it will get approved, which is why this is the first time they've proposed a Bitcoin ETF to the SEC.
However, it's also possible that the ETF isn't immediately approved, but still the SEC's comments on it are very positive and paint a bright future for a future ETF to pass, which will be enough to ignite a bull run on speculation alone. We will have to wait until September 21st to know for sure what their decision is going to be, but the strong coincidence with that decision and my time target for wave-g points to a positive decision happening on that date, and crypto seeing an extremely powerful bounce that will be strong enough to begin a months-long uptrend.
Also many altcoins that have not gone up as much as BTC in the last month will likely see new low prices. It's also possible that BTC briefly makes a new low, but I think it's more likely that the 5800 support will hold more or less and we'll bounce off of that in September. Regardless of how low this goes, it definitely seems like the timing for the end of this correction is perfect for September 21st, and we may be two short months away from an epic bull run that could take BTC to well over 100k, and take many other cryptocurrencies even higher in terms of percent-gains over the following 9 months.

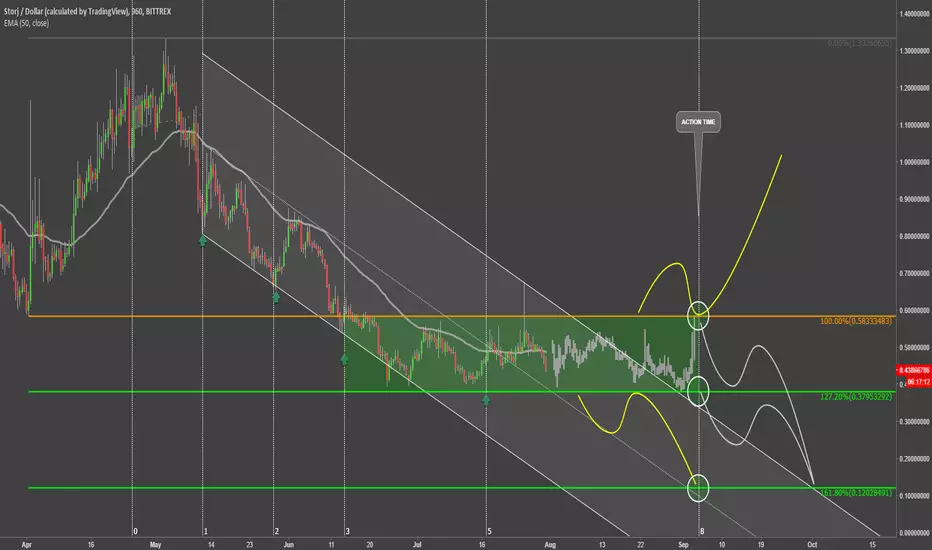
Storj Coin Action TimeStrorj has been steadily declining since 3rd of may, and already lost 70% to the USD. Price has moved down from $1.33 to the $0.4 low. STORJ/USD almost reached the 127.2% Fibonacci support level at $0.38, but failed to couch it.
In any case trend remains bearish as price still moves within the descending channel, and recently rejected the upper trendline, suggesting the continuation of the downtrend. At the same time it seems that currently price started to consolidate, between $0.4 support and $0.55 resistance.
The range trading could continue, but the interesting timing is the 4th of September, which is 8th period of the Fibonacci Time Zone indicator. Around that day, price might start showing some signs of a trend which could help to reveal further direction.
There are multiple scenarios that should be expected, but only break above the resistance or below the support could be the trigger for the next STORJ move.
If $0.38 support is broken, price is likely to go down further, to test 161.8% Fibs at $0.12. But if the resistance is broken, this might be the first sign of a potential trend reversal.
JD Hitting The All-Time HighLast post: June 30th. See chart .
Review: Price was heading up towards the previous all-time high.
Update: Price has now started to challenge the all-time high resistance level.
Conclusion: We need price to clearly break through the resistance level and stay above it, then we can start to look for long opportunities.
Any comments or questions, do not hesitate to leave them below. Give us the thumbs up if you share our sentiments!
Sublime Trading

WD Gann Price & Time Analysis for USDMXNMy forecast is for peso to make a swing low in July...
7-12ish could be possible but will have to do more research to be more confident.
Watch out for elections this Sunday coming up... it could go a little crazy
Cheers
Gann Analysis

NAsdaq: Super Long Term View using Gann Time CyclesSuper-Long Term View of World Markets
Back to the Source
The Daddy Cycle
The Faangs (+ Microsoft) make Nasdaq run.
Nasdaq in turn makes the SandP run (but not the Dow which is internationally based).
The SandP in turn makes FTSE and Dax and Nikkei run. Not always but usually so.
So what is good for Goog and FB and Amzn and Aapl and Msft and Nflx is good for world markets too due to the invisible algo/thread that inter-twines most major markets in 2018.
This chart below shows the Gann master time cycles working very clearly and very accurately so far this century through the main driver of nearly all major markets - the little used Nasdaq composite index.
We can see that the mid-term cycle high reached at the beginning of this year fell just days after the time cycle high was reached, creating the first significant (over 10%) decline since the last cycle high was reached which in turn created the first significant correction (21%) since the Euro problem lows of 2011.
Looking at the longer term we can see that the mid cycle high point has been broken. The next cycle high is due on 27.7.20 - look for the next standard deviation of 9-11% minimum at that point and a maximum of 19-21%. The pattern suggests it will still be the correct policy to buy that dip.
The grand cycle high point arrrives on 13.2.23 when all holdings should be sold into the final high at which point prices should roughly halve in value during the ensuing 2 year bear market.
The future is a J curve. Back in the day of robber barons men would find oil or gold and sell it and hoard the proceeds - now they tend to re-invest profits in AI and the future. And the more they invest in the quest for ultimate domination the faster the future comes at us. Why fight this trend?
It's a buy dips market through to early 2023 according to this chart.

Crude, Big Big Picture 2 Legged Move Completes on time $CL_F One Way, two legged moves on Crude appear to have finished here @ $73

Experimental Trade opportunity This plot tries to predict a future buy that should happens on June 6th. Time and price are precisely depicted on the plot.
If the settings of the buy get accomplished from now to the 6th, then I will buy and I will close the trade as pointed by the green arrow.
This new experimental strategy is based purely on Fibonacci settings. We will see how good it could be.
Trade your own plan, good luck :)
Thor

VRTV is a gainzta! Gainz, Gainz and more Gainz this has the chance to make it a nice week of gains! uptrend pattern only for a limited time!


Follow Up to March 19th Fibonacci Time Scale IdeaI published an Idea on March 19th pointing out the occurrence of BTC crashes on Fibonacci time scale lines. Most everyone using TA uses Fibonacci levels for retracement and extension of price right? So are Fibonacci time based markers useful? If the projected time range (May 12-16) produces another "event" then I'd say so. Stay tuned...
In the meantime, I've been looking at alot of TA since the BTC turnaround and much of what I read wants to define the price movement LINEARLY through "channels" and "Wedges". When I look a the same data I mostly see CURVES. I see non-linear movement. This becomes, to me, more apparent when looking at much longer time frames.
On this graph there are three curves that I've fit to the price movement. #1 and #2 are somewhat flexible depending on the chosen points but #3 fits really well. What I am interested in seeing from here is how well (or not) price follows the curve(s) and then how price/curves/Fibonacci time line all intersect.
This is NOT a predicition. I see things that I find interesting/not the norm in TA sometimes and I share them. Do with it what you will.
As always, comments are welcome and I hope that your BTC count increases!

Everybody is bullish again. That's because their not seeing thisHi friends,
First of, I am actually bullish long term. However, short term we do still have some hurdles to conquer. For this reason, I still remain neutral to bearish short term.
So let's take a look at what I've got here.
You can see that Litecoin has fallen out of an important ascending channel (outlined in BLACK). At almost the same time, we also fell back under the 200dma. We're also under 58 on RSI, an important number as is 54, which we're currently just under and flirting with.
My suspicion is that little Litecoin just wants to kiss daddy 50 and mommy 200 one last time before a final send off into next year.
Be ready for that final discount window to open buyers.
Peace and happy trades.

Interesting Curve FittingBack on March 19, 2018 I published an idea that simply pointed out the unique alignment of BTC price crashes with the Fibbonacci time scale. We refer to the Fibbonacci levels all the time regarding price levels so maybe the time component has something to reveal as well?
Since the recent price reversal I see alot of TA that uses "channels" and "wedges" to establish boundaries for and to predict price movement. When I look at the same charts I see curvature, not linearity. I have fitted 3 curves to the 4hr price chart to highlight what I see. Curves #1 and #2 can be changed slightly depending on chosen endpoints but they wont vary by much. Curve #3 however is a really good fit and its so interesting to me how it so nicely fits with the bottoms of price movement.
My Fibbonacci time target is only a few days ahead of us now and I am so very interested in seeing IF that day (range) holds any surprises AND how the curvature I've pointed out plays out as we hit the Fibonacci date(s).
This idea is NOT a prediction. I like to share some of what I see and find interesting.
Thoughts and comments are always welcome.

New Bitcoin Buy Zone Identified! 7.5-8k
I'm sorry for the messy chart folks. I do a lot of work on my charts trying to get these calls right.
Let's go through some of this stuff and I'll show you what I've come up with.
First off, one of the reasons why I put off posting this chart was:
-A) because the Head-and-Shoulders that I'm about to show you was still so incomplete and
-B) with all that bullish sentiment here on TradingView I was not sure that it would complete.
So we were in an uptrend channel (PURPLE). Even with that momentum, the charts were showing me we'd probably not go much higher than 9.5-10k. Why? See that BLUE down-trending line? That's been there since mid-Jan and the bullish momentum already seemed to be fading around 9.3k. But even if we did break the BLUE, above it on the DAILY stood the 200dma, a formidable foe for those bulls to be sure. It stood at 10k.
Ole' BLUE was tested and the bulls knocked their heads so hard up against it that it sent them down and out of the PURPLE channel. A bearish sign to be sure. But this was just the start. It also helped to confirm that another bearish signal was forming and that is the Head-and-Shoulders you see.
Now if we break that neckline, it should take us down to the 200dma (on the 4hr now) or lower. I have outlind your buy target zone in the chart.
One more thing to mention. See my RSI chart? I noted about half a year or so ago that ole' Bitcoin likes it's 60 day cycles. Sometimes these cycles are extended, such as was the case in the beginning of this year. But I think I have found it attempting to get back on track. Whereas last year the cycles were 75% bullish (meaning the first 45 days were UP and the last 15 days were DOWN), this year I have found that so far the cycles are 50/50 bull/bear. So, the first 30 days seem to cycle UP and the last 30 DOWN. Tomorrow, May 1st, marks the halfway point of this cycle. It could be something, and then maybe not. Nevertheless, I thought I'd throw this theory out there for you all to consider.
We'll see what happens here, but for now I've cast my buy nets in the green target zone IF that neckline breaks.
Good luck all and happing trading!

ICX long trade ! Long time resitance which has become supportLongtime resitance which has become support, stop loss for this will be very short as if it breaks below this it will go further down. and upside i have kept just below the next resistence, if it crosses that then next target is even higher.

USDCHF SWING SHORTProfit target, the D point of AB=CD
If i get an entry Monday will maybe update the TP and add points.
If no entry will try on a retrace

Breakthrough the down channel to happen on May the 5th. Upon my calculations, using the below techniques I'm estimating an important impulsive movement, which likely will be UP direction, and should happens on 05.05.2018.
Methods used:
-ROC crossing MA.
-2 x Fibonacci trend zone. Minimums and maximums appoints both to the same date!
-ESCGO by Lazzy Bear indicators. Helps locating price cycles in time.
-Fibbonacy Channels.
-Simple horizontal support/resistance analysis.
-Angled support/resistance analysis.
-Structures.
Yet, non of all of these together can be useful if you don't have a plan. Trade your own plan :)
Good luck to everyone !
Th.

New Triangle and Death Cross Spotted for poor little LitecoinFriends, critics, foes. A few days ago I made the prediction that little litecoin would break out of that first purple triangle you are seeing here on my charts. That it did. I was confident that it would go up rapidly. Not so much. Here's what I missed and why litecoin is baulking a bit at this upwards move.
I knew the 200dma was ahead, however, because I am not an elite "PRO" member here on TV, I was not permitted to also have the 50dma indicator (a basic member restriction) on my chart. It was not until I changed my MA time frame that I noticed the 50dma exactly where the 200dma was ...and crossing! When a downward 50ma crosses and upward 200ma, this is known as the "Death Cross", a bearish indicator.
Additionally, I was observing that other analysist had been drawing another triangle on their charts. This one with a higher top than my first. I have drawn this new triangle on my chart. Notice how it also intersects exactly at the point of the Death Cross. I don't think I have to tell you that this is not a good sign.
I know that I was fairly bullish in my previous post. And I had good reason to be. I did make good money on this trade, however, I am redacting my previous statement regarding holding for the long term as I am now doubting whether or not this is the longer term bottom. I am also lowering my sell target to between $140-$150 with these newly discovered indicators. I do plan on selling in this range.
I will not become bullish again until we both break above this second triangle AND cross over at least one (preferrably both) of these significant moving averages.
Stay safe. Peace and happy trading my crypto friends.

GBP/CHF- Fun with charts....Ok...... So I spent some more time to go over gchf since it has extended. I would like to point out that it did a W-X-Y double combo pattern in the form of 7 swings. For this pattern you would expect equal length to 1.236 extension. Hit 1.236 today, along with the .764, which would also be conducive with a continuing pattern which would need to come down to most likely that .618(longer .618 line) Keep in mind GU hit the high also. It also lines up (roughly) with about equal time span of each pattern within the combo. These pitchforks are not necessarily drawn how anyone else would draw them, but take a minute to really look at the medians (red lines) and how price follows them...... Anyways strong level. I've looked sells lower down looking for a different pattern, or at least a sharp 3 wave this move, but all it did is keep extending, right to the fib extension. The issue is as of right now we have no reversal pattern or ending diagonal, plus Gchf could go into a large sideways consolidation (which would still probably produce a nice sell). We might even get a zone bounce (see horizontal green lines). The daily TDI WAY over extended. So is the weekly. Just please keep in mind this is not a 5 min chart... That is the daily..... We have nothing but a 4hr pin bar right now. There are different ways to go about attempting this trade and not put yourself at too much risk. If you want to learn about price action along with this stuff then subscribe and watch my you tube channel. I did a live trading session earlier, I go over a lot of charts... (it's free guys)...

Euro/Yen Bullish Triangle CorrectionAfter the bullish 5 wave pattern,
it looks a little bit like a
corrective triangle pattern
has begun to form.
D Wave.
With the completion of
a double top pattern
at the 136 zone,
the D wave of
the triangle pattern
will have met its
61.8% Fib Level requirement
along the triangle trendline.
E Wave
The location of the projected
61.8% retracement from the
D Wave endpoint seems logical
because that is where price
can be expected to run out of
momentum
Only time will tell

Pound/Yen Bearish CorrectionAfter the 2007 to 2011 bearish 5 wave pattern,
this Zig Zag Correction Pattern on the
Monthly time frame could be expected to complete
a retracement to, about, the 61.8% fib mark.
Only time will tell

