Gann Astro Trading Lesson- Learn how to forecast market HIGH/LOWOANDA:XAUUSD
This Gann Astro Trading Lesson demonstrates one of the most revolutionary trading concepts introduced by W.D. Gann: "When Time and Price Become Equal, the Market Must Reverse." Through the integration of advanced astrological principles, mathematical precision, and deep market understanding, this method highlights the supremacy of time over price in market forecasting.
What Happened in the Chart?
1. Identification of the Low (27th November, 20:35)
Using a combination of Gann’s astrological tools and mathematical calculations, a significant market low was identified. The Ascendant (ASC) value, 123.09, became a key parameter to project the forthcoming reversal point. This low acted as the starting point for determining when time would align with price.
2. Projection of the Market High (28th November, 7:05 AM)
By applying precise calculations, the upcoming high was forecasted with remarkable accuracy. The market began to consolidate at this point, respecting the time projection and halting further upward movement.
3. The Role of New York Open (28th November, 9:30 AM)
The market did not break the predicted high before 9:30 AM. This delay was attributed to the presence of high-frequency trading algorithms (HFTs) that dominate price action during key market opens. As anticipated, once the New York market opened, the price reversed sharply, demonstrating the dominance of time cycles over simple price observations.
Why the Market Reversed?
Time and Price Equality:
The calculated time of 7:05 AM aligned perfectly with the earlier low, signaling a reversal point in the market. This alignment of time and price creates a "vibrational balance," a critical moment when market energy resets.
Algorithmic Impact at Market Open:
The consolidation near the projected high was not random—it reflected the preparation of institutional algorithms that execute trades in large volumes at the New York open. As anticipated, once the market opened, price reversed sharply, driven by these high-frequency trades.
Why TIME Is Superior to PRICE in Trading
Markets Follow Time Cycles:
Most retail traders focus on price patterns, trend lines, or indicators, but fail to recognize that price moves in accordance with time cycles. Price is merely a result, while time acts as the governing factor behind market reversals, trends, and consolidations.
Retail Traders’ Common Mistake:
Without an understanding of time cycles, retail traders view markets as random or speculative. They often chase price, buy during rallies, and sell during declines—moves that are counter to natural time-based market rhythms.
Gann’s Teachings on Time:
Gann taught that markets are ruled by universal laws of vibration, heavily influenced by planetary movements and time-based intervals. When time becomes equal to price, markets undergo a significant shift. Failing to understand this makes retail traders vulnerable to losses.
Lessons for Traders
Time Is the Key to Consistency:
Understanding time-based market mechanics removes randomness from trading. It enables traders to predict movements with high precision, often down to the minute, as shown in this example.
Avoid the Pitfalls of Price Chasing:
Retail traders lose money because they rely solely on price-based strategies. Without incorporating time, they are reacting rather than anticipating, leading to poor decision-making and losses.
Mastering Gann’s Principles:
W.D. Gann’s work proves that markets operate under natural laws. By mastering time cycles, one can forecast market highs and lows well in advance, achieving a level of precision that transforms trading from speculation to science.
If you're tired of inconsistent results, losing money, and treating the market like a gamble, it’s time to unlock the ultimate trading methodology. This is your opportunity to dive into the most advanced, precise trading techniques that blend W.D. Gann's principles, astrology, and advanced mathematics to decode the market’s hidden structure. You will learn to calculate time and price equality for any market, forecast highs and lows down to the last minute, and identify market reversals with unmatched precision.
This approach proves that the market is not random—it follows a disciplined, predictable order rooted in time, making it the ultimate edge over traditional trading strategies. By mastering these techniques, you will break free from the common retail trader mistakes and gain the ability to anticipate market moves with accuracy, long before they occur.
This is not gambling or speculation—it is the science of understanding market dynamics through time’s supreme influence over price. If you are ready to transform your trading, achieve consistency, and trade with absolute confidence, contact me today to learn this decoded and proven system that will change the way you see the markets forever. The secrets to mastering market timing and precision await you!
TIME

Reality & FibonacciParallels between Schrödinger’s wave function and Fibonacci ratios in financial markets
Just as the electron finds its position within the interference pattern, price respects Fibonacci levels due to their harmonic relationship with the market's fractal geometry.
Interference Pattern ⚖️ Fibonacci Ratios
In the double-slit experiment, particles including photons behave like a wave of probability, passing through slits and landing at specific points within the interference pattern . These points represent zones of higher probability where the electron is most likely to end up.
Interference Pattern (Schrodinger's Wave Function)
Similarly, Fractal-based Fibonacci ratios act as "nodes" or key zones where price is more likely to react.
Here’s the remarkable connection: the peaks and troughs of the interference pattern align with Fibonacci ratios, such as 0.236, 0.382, 0.618, 0.786. These ratios emerge naturally from the mathematics of the wave function, dividing the interference pattern into predictable zones. The ratios act as nodes of resonance, marking areas where probabilities are highest or lowest—mirroring how Fibonacci levels act in financial markets.
Application
In markets, price action often behaves like a wave of probabilities, oscillating between levels of support and resistance. Just as an electron in the interference pattern is more likely to land at specific points, price reacts at Fibonacci levels due to their harmonic relationship with the broader market structure.
This connection is why tools like Fibonacci retracements work so effectively:
Fibonacci ratios predict price levels just as they predict the high-probability zones in the wave function.
Timing: Market cycles follow wave-like behavior, with Fibonacci ratios dividing these cycles into phase zones.
Indicators used in illustrations:
Exponential Grid
Fibonacci Time Periods
Have you noticed Fibonacci ratios acting as critical levels in your trading? Share your insights in the comments below!

High risk, high reward, bargain hunting "cheap" crypto coinsLets talk about tiny caps. As crypto continues to run, and get more expensive, everyone will be looking for the next big deal, the still cheap crypto to buy as there is less and less options as the market runs up.
-----------------------------------------------------------------
We need to discuss marketcap real quick because even though the first major site to service crypto is literally named after crypto market cap, it seems a lot of folks in crypto dont pay attention to it. I see too often some will say oh that asset is $500 each, thats too high, looks like I already missed the boat, but look at this cheap asset for $0.0001 and imagine if I own half a million of those and it goes up to $1, I think this is a common vision for crypto holders. But at the same time that asset for $500 which can be bought in fractions, may have a market cap of $100M while that asset for 0.0001 may already have a marketcap of $50B which makes the asset for .0001 50x more expensive than the asset for $500. Keep in mind the amount of money it takes to get an asset to run from $50M to SEED_TVCODER77_ETHBTCDATA:5B versus the money it would take to move an asset from a SEED_TVCODER77_ETHBTCDATA:5B to $500B (half a trillion dollars), its a lot more fuel needed for that engine.
Additionally, if an asset had a $50B market cap already and cost .001 cent and it ran to $1 that means if we took every coin that exists for that crypto, multiplied it by the total coins and it would have a valuation of $50 Trillion dollars, to put it in perspective all USD digital and phsyical in the world right now is worth about $30 Trillion. So the idea that this asset that has almost no real usable purpose other than trading should be worth more money than all the USD's in the word is absolutely absurd. That said, we still see things like XRP that has no traction in getting banks to use a public blockchain for remittance, has a valuation that is more than goldman sachs or HSBC, both which are feature rich banks with dozens of revenue streams beyond remittance and billions in profit every year, which is often shared with sharefolders, none of which XRP has. Its clear XRP is already hugely over priced but crypto populous doesnt seem care about the market cap, they see $1.80 as cheap, they dont see $180B is expensive.
That said I would still day trade XRP though i tend to prefer XLm because it runs many times when XRP does but tends to run harder.
-----------------------------------------------------------------
Now why did I just talk about all this stuff that hopefully you were already aware of? Back to the point, cheap crypto and the likelihood that more and more people will be looking for it as this market continues to run. So actual cheap crypto is crypto with a low market cap, but I think from a trading aspect, because so many people in crypto do not understand market cap and envision that penny coin going to $1, anything under $1 is likely to perform better.
I primarily use Coinbase so this is not exhaustive, I would recommend you check low caps on the exchange you use, but here is a list of low/tiny caps I pulled up yesterday, already had a 70% run on POLS. But there is something you need to be aware of with these low caps, most of them are also low volume. This means you cant just go buy $20k to $100k of these assets at once, you will have a ton of slippage and start off negative right off the bat, the order books and the volume just is not there. So for these assets, you have to slow play acquire them and be prepared for high risk, high volatility and the potential for high reward. A lot of these, like many if not most crypto are kind of, or are, total garbage, but again no one seems to care in crypto, they just want a bargain.
Here are a list of low/tiny caps, with cap rate, circulation, cost and avg daily volume right now. Anything with less than MIL:1M daily volume is pretty much un-tradable, once the daily volume is MIL:1M they are somewhat tradable and once it reaches $5M daily volume it starts to become fairly tradable but the price will have already run a bit by then most likely.
GYEN - $14M cap 2b circ - 0.006613 each $17k volume
SHIPPING GETTEX:18M cap 10B cirv 0.008111 $3m vol
LIT $52M cap 100M .94cents - $5M volume (only 50m in circ)
BNT $90Mcap 10M circ .75 each 8M volume
INV $21M cap , 615k circ, $300k daily volume, $35.81 each
00token (00) $19M cap 1B circ, 1M daily vol
Muse $6M cap, 1.58m daily vol, 950k muse, 508k in circ, $13.15
chrono.tech (TIME) GETTEX:17M cap710k circ, $24 each, 228k vol
FIS $41M cap 149M .40 each $9M vol
ACS GETTEX:68M cap, 88B circ, .0018 price, $1.44M vol
MLN GETTEX:48M cap 2.6m supply, EUROTLX:4M daily vol, $18 each
GST GETTEX:48M cap 2.36B supply, $12M vol
ASM TRADEGATE:56M cap 1.5b circ, 0.03 price, $19m vol
FORTA $71m cap 1b circ, .14 price, $7m vol
POLS $72M , 100M circ, .68 price, $20M volume (just ran up 70%)
Remember these are high risk, generally low quality projects, low volume coins and the play here is trying to get in on the actual cheap coins, before everyone else rushes to do the same. Some or even potentially many could be de-listed which could cause near total loss if you are sitting on one, this is not for those looking for low risk.
This is not investment advice, its also one of the higher risk strategies I have pushed, I would urge you to tread lightly here.
If you know of assets sub $100M market cap that I missed here, feel free to add it in the comments for others.
Happy bargain shopping.

How to use Trading View - Part 3 - TemplatesHow to use Trading View - Part 3 - Templates
Easily switch your TF, Scrip and indicators with the help of templates.
These template help save time and ensure you don't miss out on any indicators/Time Frames or Opportunities.

How to use Trading View - Part 1 - Trend Lines and Time FramesHow to use Trading View - Part 1 - Trend Lines and Time Frames
Use these different tools to make the most of your trading View account.
Make sure to differentiate your time frames so that your charts are decluttered and you have a very clean chart handy always.
Avoid drawing too many lines and drawings at irrelevant time frames.
Keep it Simple,
Keep it Consistent,
Keep it Clean.

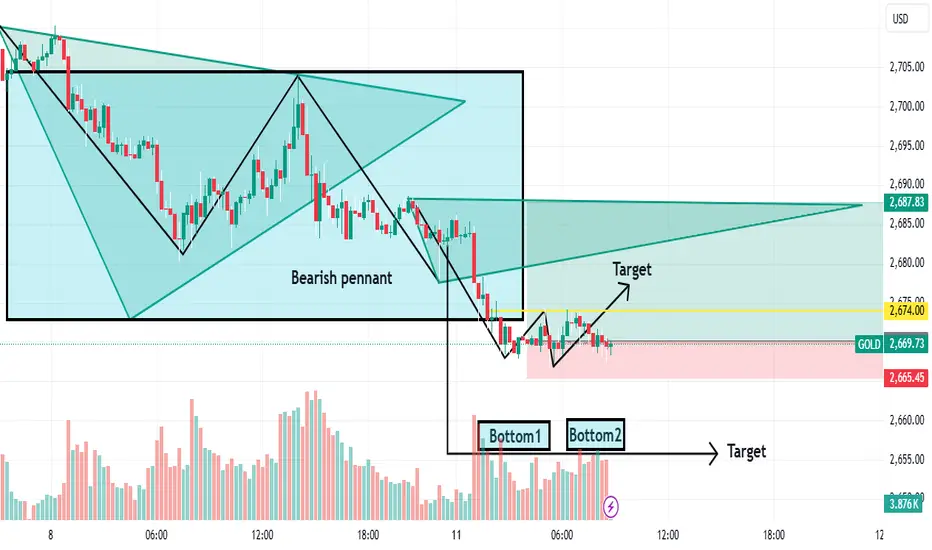
XAUUSD 15 MINUTE TIME FRAME CHARTGeneral outlook
XAUUSD has been under selling pressure within in the last couble of hours. The pair moved up the support level of 2669.
possible scenario
The best way buy use this opportunity is to place a buy order is at 2672.
Set yorur stoploss at 2665 below the previous low take profit 2688.
WISH YOU BEST LUCK
SPX Key $ Levels | 70%+ Accuracy! | WednesdayNew price targets for Sep 25 using Statistics and Data to drive a 70%+ historical accuracy.
Topics:
- Today's Targets
Overall we use stats and data pulled from a wide array of TradingView indicators and scripts so that I can have as much data as possible - even if it's unstructured or uncorrelated data. I then use AI and SOP's to systematically calculate a weekly and daily framework. My predictions are never 100% but ALL of them are mathematically proven to be 70%+ accurate historically or I wouldn't use them.
Most indicators I use on my Data Dashboard chart has the stats in their associated boxes that I show during the recording if you'd like to verify yourself.
Please leave me feedback as I am new to creating content and would like to improve.
Personally I use these targets in combination with ICT Concepts to trade.
Nothing I say is Financial Advice - Previous performance does not guarantee future success.

(TIME) chrono.tech "activity in Nigeria"33% of activity on Chrono.tech (TIME) is currently found to be in the Nigeria location using crunchbase.com data provided by Semrush analytics.

There is NO Right Time, Just time | $388 ProfitDoesn't matter who you are we all have the same 24 hours in a day, what you do with it is what dictates how successful you are.
We have to be very concerned with how we make use of the time at our disposal.
That is all.

BTC By HesamUNT ( Time cycle )hey traders
its not about uptrend or downtrend
its about key lvls with time cycle
The horizontal lines will b confirmation for time cycle , after each season there will b a new trend in this market
Red lines = Long-term scneario
Yellow Lines = Mid-term scenario
Blue Lines = Short-term scenario
what u think ?
share ur chart and leave a comment

Some Hopium for 2024 Cycle, Lets See How Well This Ages For FunComparing the 2 previous bull run cycles to the now current cycle using approximate scaling to compensate of overall size of each run. Notice the moving averages are relatively similar, also RSI, Stochastic and Aroon Indicators are in the same ballpark when considering scaling time for the higher capital size/price. Like most I felt we were further into the cycle but did consider the possibility if we were to drop and break the local parabolic curve we could just be setting up for a longer and larger bull cycle, especially since we had such an early start this time. Good hopium I suppose, and will see how good or bad this ages, will see if that scaling the chart will show some truth to my hypothesis, I am publishing this right after today's closing loss of the 200 MA on the Daily timeframe.

A Bitcoin Fib-Time Based Cycle ConceptHere we look at a quirky emoji infographic showcasing one of five potential Bitcoin cycle concepts. Using trend-based Fibonacci Time Extensions, I've drawn them since the inception of Bitcoin's first impulse rally from 2009 to its 2013 all-time high. These are then projected sequentially four times to 2025. While it seems simple, and not perfect, it appears to be quite effective and has not been invalidated to date.
Importantly, this is not a price prediction or estimation, nor does it offer an overall bearish or bullish take. Although the outlook seems bullish, cycles can play out over years, and we may not have seen Bitcoin's final cycle just yet. This is why it's the first of five concepts (long & short Term) I'll explore and adapt alternatives in the coming weeks and months.
This merely presents a conceptual analysis of Bitcoin's time and cycles, highlighting key pivotal points worth watching. Timing can be just as crucial as managing risk. Having a plan to correlate these factors allows you to spend less time watching charts and more time enjoying whatever you want.
Key Takeaways:
With a 1-2 weeks variance, each fib level (signpost) approximately triggers the next phase. It is within that phase expect the noted legend and take that mindset.
Each fib range marks 1456 days with 728 being the halfway point of each sequence. Note that 0.5 is not an actual fib level.
Once a cycle of phases is completed, rise and repeat.
We just passed the Halfway point in early Nov 2023.
This current cycle is projected to end in Nov 2025.
This is purely a concept and not financial advice. I apologise for the resolution. A screenshot can be viewed here:
Enjoy!

A Bitcoin Fib-Time Based Cycle (Concept #2)In this chart, we take a look at a second Bitcoin Fib-Time Cycles concept (2/5). Refer to the original idea for concept #1 linked below. This Concept #2 is an alternative 8-step cycle phase to my original concept. This zooms out further and takes Bitcoin from a greater 2-phase cycle perspective. This concept is for the long-term investor who aims to track major Bitcoin phases when time is not on their side. Treat each signpost phase as a ranged period mindset until the next is triggered. This is not to be conflicted with the original concept, however, another perspective.
In this second concept, the positioning of the trend-based Fib-Time Extensions has been drawn from Bitcoin's inception to the first impulse rally from 2009 to its 2017 all-time high. From there it is projected sequentially again to 2026. The reasons for placement are through an observational nature in the structure of the cycles, or at least how I see it. From 2009 > 2011 > 2013 > 2017 as being marked one cycle, to 2017 > to now as a potential being marked as the second cycle. A repeat of this cycle however is on a larger scale. The ATHs to cycle lows across these two cycles are also noted as 2011's low from ATH was -93% whereas 2013 was 86%. Thus in 2017, it was -84% and to date 2022 is -76%. It appears that it is 1 larger drop proceeding by a lesser % drop.
Note: These vertical projections are not manually placed; they are based on Fibonacci sequence numbers derived from the noted placements (0-1). Interestingly, where they end up relates to the major pivots across the start and end of the sequence.
Importantly, this is not a price prediction or estimation, nor does it offer an overall bearish or bullish take. Although the outlook seems bullish, cycles can play out over the years, and we may not have seen Bitcoin's final cycle just yet. This is why this is an alternative concept to others I have been exploring. More alternatives in the coming weeks and months.
This merely presents a conceptual analysis of Bitcoin's time and cycles to date, highlighting key pivotal points worth watching for. Timing can be just as crucial as managing risk. Having a plan to correlate these factors allows you to spend less time watching charts and more time enjoying whatever you want.
Key Takeaways:
With a 1-2 weeks variance, each fib level (signpost) approximately triggers the next phase. It is within that phase expect the noted legend and take that mindset.
Each fib range marks approximately 2900 days (8yrs)
Note that 0.5 is not an actual fib level.
Once a cycle of phases is completed, rise and repeat.
We are 8 weeks, 3 days until we hit the next phase (Climb the Wall of Worry)
This current second iteration cycle is projected to end in Dec 2025.
This is purely a concept and not financial advice. I apologise for the resolution. A screenshot can be viewed here:

HOT CAN SHOW HISTORICAL INCREASEHot seems to have an interesting volume, which could increase with the coming time frames, we will follow the trend to see for new changes in data.
will the trend follow FLoki, SHIBA's last hype? The chance is there high.
we did update before about Floki with same update

📈TON Breaks ATH: Eyes on $6-7 Target?🚀🔥🔍TON coin has recently shattered its all-time high (ATH) with a convincing candle on the weekly timeframe, marking a significant 32% move from the trigger candle. The uptrend appears to be continuing, with a potential next target range around $6-7 based on Fibonacci levels. If you bought at lower levels, it is advisable to hold for now.
✨Taking a glance at the annual pivot points, TON has reached the R2 level and seems to be consolidating. Observing the reaction at this level will be crucial in determining the next move. A break above R2 could indicate further upward momentum, while failure and a trigger candle might signal a potential sell-off.
📊The recent influx of volume into this coin over the past two weeks suggests strong interest from investors. If there's a reaction to the annual R2 level, monitoring the trendline drawn can provide insights. In case of a breakdown and confirmation candle, selling could be considered.
💥The RSI oscillator has entered overbought territory, signaling a potential sharp movement similar to the recent 30% surge. Fundamentally, TON is associated with the Telegram messaging platform. If you believe in the widespread adoption of this messenger, investing in its coin could be lucrative.
🛒Waiting for a pullback to the trendline with confirmation from a candle could be a viable strategy if you're still on the sidelines. Keep an eye on the market dynamics and react accordingly for potential profit opportunities.
🧠💼Just remember, jumping into trades too quickly before the main trigger can be risky. Always manage your money wisely and be aware of the risks involved.

Breakout in tata consumer 23% upside possible A good breakout with heavy volumes ND strong rsi was done in tata consumer.
Buy it at 1191-1240
Target 1280 1470
Sl 1165
There is high possibility that 23% will be achieved with in 5-11 week

dxy short . long term investas you can see dxy could possibly see one of its worse days. the first trigger for shirt has been passed and it wont stop that easily until 50. most likely it would stop there or become sideways but if it can break that support, it can go till my last tp :). but i think its less likely.

Gold LongI see price buying just to clear liquidity as for now. Price did its 4th element which was the reversal to the upside. That element usually aims for liquidity pools, external liquidity, highs and lows, before reversing. Im watching this every 15 days. Already rode the buy up at @2008

A Bitcoin Fib-Time Based Cycle (Concept #3)In this chart, we explore a third Bitcoin Fib-Time Cycles concept (3/5). Refer to the original idea for concept #1 or concept #2 (linked below). In this concept, we position Bitcoin within an unconventional greater two-cycle phase, where the current cycle, Cycle 2, contributes to a Supercycle. It offers a twist that may appeal to the more contrarian, as its approach is taken from the emotional 'Herd' perspective. We use this to examine investor sentiment as it often conflicts with price action and can provide moments of opportunities or reasons to prepare and avert risk. Unlike other concepts, each signpost should be viewed as a rolling emotional peak within that period, until the next is triggered. This chart is not to be confused with other concepts, however, it can be confluent whilst still being conceptually distinct.
In this third concept, the positioning of the trend-based Fib-Time Extensions has been drawn from Bitcoin's inception to the first impulse rally in 2020. From there it is then projected sequentially again up until 2030. The rationale behind this theory is based on the idea that originated from my first-ever TV-published chart (linked below) . The shift in Bitcoin's cyclical nature poses a possibility that most of Bitcoin's growth from the early stages (2009 to 2013) is now in a repetitive sequence. This could indicate signs at greater levels playing into larger growth, which then forecasts a longer-term bear market.
Note: These vertical projections are not manually placed; they are based on Fibonacci sequence numbers derived from the denoted placements (0-1). Interestingly, where they end up closely correlates to the major pivots across Bitcoin's historical patterns.
Importantly, this is not a price prediction or estimation, nor does it offer an overall bearish or bullish take. Although the outlook seems bullish (short-term), cycles can play out over the years, and we may not have seen Bitcoin's final cycle just yet. This is why this is an alternative concept to others I have been exploring. More alternatives in the coming weeks and months.
This chart merely presents a conceptual analysis of Bitcoin's time and cycles to date, highlighting key pivotal points and how Bitcoin can often play on emotion and sentiment-driven participants. Overall it is worth observing even without this concept as understanding timing and environmental circumstances can be just as crucial as managing risk or setting price targets. Having a plan to correlate these factors allows you to spend less time watching charts and more time enjoying whatever you want.
Key Takeaways:
This chart is based on the 2-week timeframe as its projections are till mid-2030
With a 1-2 weeks variance, each fib-time level (signpost) approximately triggers the next shift in the emotional phase. It is within a phase to anticipate the preceding signpost and observe the sentiment with the correct mindset.
Each fib range marks approximately 3808 days (10.43yrs)
Note that 0.5 is not an actual fib level.
Once a cycle of phases is completed, we will assess as I believe this concept could prove to be a new set of cycles.
We are 2 weeks, and 3 days until we crossover the next signpost (The Fomo Sweats!) Crossing the next signpost does suggest that there is a 1-3 month period of rapid upside.
This current second iteration cycle is projected to end in Jun 2030.
This is purely a concept and not certain and not financial advice. I apologise for the resolution. A screenshot can be viewed here:

853 days magic number for bitcoin?If you measure bitcoins bottom to top last 2 cycles you can begin to find a target date for the next bull run. both last two cycles botom to top lasted about 853 days, if we assume 15.5 k was bitcoins bottom 853 days would put us in in march 2025.

FIL 17.01.24In an environment where the market is generally positive, the halving is approaching, and finally interest rate cuts are discussed, FIL coin will also get its share.
The rising trend (green line) will be the best place to buy, but since I do not want to wait, it would be best to buy in pieces, including these levels.
It will be ready to fly when the 4-hour candle closes above the falling trend (red line) and retests.
TP1 : 7.4
TP2 : 7.99 (psychological resistance)
TP3 : 8.61
What I write here serves as a note to myself. Does not include investment advice.

Just think about sellingCurrently, it requires a very high risk to enter the transaction, so it is better not to do anything until reaching the specified level.
Due to the heavy fall, we expect gold to fall again
⚠️ This Analysis will be updated ...
👤 Banipal : @hosseinbakrani
📅 02.14.2023
⚠️(DYOR)
❤️ If you apperciate my work , Please like and comment , It Keeps me motivated to do better ❤️

All time high breakout!!!The chart has given previous all time high breakout and now trending above that levels. So, it has technically good potential for upside momentum. A clear cup and handle pattern breakout.
