Spot The Trend & Trade It On Lower Time FramesOne of the strongest setups are the ones that are being formed by the dual time frame momentum. By using multiple time frames you will be able to create a high probability setup. Key rule is: Large/High time frame for trend and Small/Low time frame for your entry. Personally I mostly I like to hold short term positions, so I use the daily time frame for the trend and then the 4 hour for my entry.
For the purpose of this educational post I will use the weekly time frame so that we can spot the long term trend and over the course of the next 2-3 months I will update this post and you will see how very well this strategy works (for the purpose of this guide I will assume it has broken the upper range, so it isn't a trading advice or prediction of what will happen)
Part 1
Spot The Trend
(I use the weekly time frame, but you can apply the same principles to the daily time frame)
Currently the weekly time frame is trading in a nice triangle that is narrowing. At the moment it isn't possible to spot a clear trend due to this. So we have some patience and we will wait till the price has broken out of the triangle. Now it's important to remember that a range is only considered to be broken when the candle has closed outside of it. Since we now use the weekly candle we wait till the market close on Friday, if you use the daily time frame you wait till the daily close of the market which will close the current candle and start a new one.
Lets jump a bit forward in time and assume the upper range has broken when the weekly candle closed. Now we know that the weekly time frame will show a nice wave up as is often the case with a range break out. So there we have had, we had some patience, we waited till the weekly would close outside of the range and now we know that the weekly time frame trend will be up the next weeks.
Now this doesn't mean straight away that on Monday the next trading day the price will jump up. Maybe the lower time frame will have a correction first because it just had a strong wave up. An indication of this on the weekly time frame can be the Stoch Rsi, Rsi or just Stoch indicator. If the price has broken out of the range but one of these indicators is already in the overbought or oversold area a retracement can be very likely. To confirm this we take a look at the lower time frames, because we want to make sure that your buy position wont drown first be a retracement on the 4 hour or daily time frame before going back up and following the weekly trend. This is the next step.
Find Your Entry
To avoid getting caught up in a lower time frame is very simple. You make sure that the lower time frame is pointing up in the same direction as the higher time frame. For example I use the daily for the trend and then I wait till the 4 hour points in the same direction as the daily trend and I have my entry. In our example it goes the same. Except now we use the daily and 4 hour time frames for our entry.
Why not only the daily? If the daily points like the weekly time frame, you can still get caught up in the 4 hour retracement.
Why not skip the daily and jump to the 4 hour Well if the 4 hour points up like the weekly time frame in our example,the daily time frame can still point down. So basically you're trading a retracement of a retracement. Which can make your position go up first based on the 4 hour, but once that retracement is done it will go down first till the retracement on the daily time frame is done.
To avoid getting caught up in all these retracements we wait till the daily and 4 hour time frames will both point in the same direction as the weekly. Which will be up in our example since we assumed that the upper range has been broken.
The following situation can indicate that the daily or 4 hour time frame are going up:
Range has been broken to the upside
Price has touched the lower range and the Stoch Rsi, Rsi, Stoch indicator made a bullish cross over
Timeframe

GOLD / D1-W1-M1 : MultiTimeFrame Analysis with Elliott+SinewaveTook me quite some time to build this up but the result shows a very clean sceanrio here ! Everything tends to correspond between each different timeframe and so the forecast is even more likely to occur.
It shows that on the biggest timeframe, gold has made it's 5 wave impulse and is now retracing in 2 impulses . The first have been completed and we clearly see it confirmed by multiple timeframe sinewave signals. We're now working on the corrective wave of this rectacement ( the A to B wave ) . Which normally plots as ZigZag and tends to be the case here. Looks like we've made the first impulse of our sub ZigZag... working on the corrective wave (that appears to be a barrier triangle on daily chart). The next move should be a 3 wave bullish impulse reaching out to 100-127% extension of the previous wave . Completing this will give us our B point of major count that we will the sell for the second corrective wave of the monthly corrective count. It can seem messy... but hold on, zoom in and take the time to read ! You'll have much clearer sight of what would be about to come ;)
Hope this idea will inspire some of you ! I'm pretty new to TradingView so I'ld appreciate any like/follow if you feel like it deserve it ;)
You can check my indicators via my TradingView's Profile : @PRO_Indicators

Possible Long Setup on USDCADHi guys,
lately CAD pairs have been very weak, on this particular pair we can see price is testing a key support area that was relevant on the daily timeframe (left-hand side). This means it could still be effective for price's movements and we can then search for long opportunities down on lower timeframes, such as 4hr. In addition to that you can see the RSI is in oversold condition, both in the daily and in 4hr charts. As we go down on the 4hr timeframe there's a huge pin signaling buying pressure at this precise level. Now, this doesn't mean we can now long but it could represent an early stage of a reversal pattern, that could be confirmed by the next candles.
I'll keep you updated in case of an entry.
If you have questions or if you want to share your ideas, feel free to comment below.
Otherwise, see you in the next chart!
$amt negative divergences and descending trianglehigher time frame is showing negative divergence in rsi
intermediate time frame is showing distribution and no conviction in buying pressure and forming a descending triangle further supporting higher time frame alignment
lower time frame is showing a downtrend breaking below support and retesting on pullback
will look to enter on 130.2x area for a move down to 129.3x area as first target and break lower to the 125.18 which coincides with the higher timeframe

$BABA breakout lookout-higher time frame shows defined uptrend and significant trend strength
-intermediate time frame shows strong uptrend with rising moving averages with price reaching resistance area of 125.5x area
-looking to price to test demand line and pullback to 125.56-.57 area which is the .236 retracement level on the shorter timeframe and demand line area
-rsi and obv aligned with price action
-will also be watching for a trendline break to the 125.0x area on the intermediate time frame which is the .382 retracement level on the shortertime frame
-if trendline is broken- it will signal trend weakening after third test and breakdown of the trendline and be cautious in initiating a position
-looking to retest test the resistance area of 125.5x on the fourth retest and breakout to first profit target at 126.51 (.618 extension level)

NZDUSD Buy IdeaPrice is currently trading inside this H4 channel and it is near the bottom of it. I want to see one more push down, towards the range marked on the chart and bullish divergence being created on the M15 chart. Ideally we will also get a false break on the bottom trend line of the channel.
Once that happens, look for the most recent trend line's breakout up (m15) and go long. Protection should be placed below last low, and final target would be the opposite trend line of the channel.

Head & Shoulders on NZDJPY!!Hi guys,
here it's an Head&Shoulders pattern on NZDJPY. I'm very interested on this cross because i think we have a nice rally ahead. On the daily price has formed 3 consecutive candles with buying pressure and we also have a divergence on the RSI. I patiently waited for a break of structure as a confirmation and that happened today.
Now there are two levels where i'm going to pay attention to: previous resistance and previous support.
If price will give us a weakness sign i will be buying this.
If you have any question or you want to share your thoughts about this, feel free to comment below.
Otherwise, see you in the next chart!

Strong support + Lower low (Multiple TF analysis) On this pair, price has struggled to break through daily support (110.757) which I am assuming could lead to a strong bullish reaction. If we look at the daily timeframe for this pair, a lower low has been created in the current downtrend which also suggests price could now be ready to rise. I will be trading this up to the major daily trend line. We may have a few fib retracements which I will be looking for opportunities to re-enter the trade to gain more pips.

Potential AUDUSD Long Reentry Possibility?!Hello Traders,
AUDUSD is in a big triangle pattern in the daily chart, as you can see in the first chart.
It was flirting with the last significant breakout highs at around 0.7536. Where also the 200-day moving average comes across.
The main idea is now that the market should at least bounce from its current daily levels. Therefore, we waited last week for a confirmation in the 1-hour chart. As a matter of fact, the 1-hour chart gave as an ending diagonal. With a breakout and a retest of this broken falling trend line, as you can see in the second chart, we decided to take a long position at 0.7555 with a stop loss of 0.75688 and an initial target of the last daily highs at 0.7715.
It is an approx. 5:1 risk to reward ratio, which is pretty good. The trade is currently with +70 Pips in profit.
But we will wait now for another consolidation pattern, like projected in the second chart. With a break again of its potential consolidation, we will take another long position to scale into our existing position. In case of a scale in we will put our stop-loss from the first position to break even. We will keep you updated.
We wish you a successful start in this upcoming week and please do use a tested strategy, this is just our opinion and we don't share OUR exact multi-timeframe strategy here. This will just give a sense of market direction.
Cheers


EURUSD 4HR Aproaching resistance. Buy at breakout.Alternative scenario: If price rejects then we will look for a short opportunity.


CADJPY - MONTHLY ANALYSISThis is a monthly,weekly timeframe analysis of CADJPY.I think this is correcting now and will be correcting for some time then will make an up move to 92.00,93.00 area. From where it can either continue the impulse up and if it does and then forms a corrective structure above that area then it is likely to reach about 115-116.00 and from there I think it will move down.But if from the 92-93.00 area it starts to fall down impulsively and then forms a corrective structure to sell, I think this pair will be crashing down towards 50-60 territory.

DXY: USD LongThe Dollar has made new highs and with 2017 being a potential year for more rate hikes there are really no sign to not long the Dollar. I believe the dollar will make its way to test the trendline on the weekyl/monthly time frame. I would wait for a pull back into previous resistance/now support to enter long.

Multi time frame StochasticThe idea for this is quite simple and no rocket science necessary to make decisions. This is to help you (hopefully) to anticipate instead of participate.
The thick yellow line is the default Stochastic (14,3,3); the shades of blue are lower time frame lines while the shades of red are higher.
When the 17 strands form a rope it's time for action, buy or sell. When the rope disentangles be cautious and/or exit.
Another good place to act is where the strands form angles (peaks & valleys) but not necessarily a nice rope yet. Check that you are in the overbought/oversold areas when actioning this.
When the rope forms a fishnet, beware, you will get caught! Hopefully you are out by then and waiting for the next peak/valley/rope to form.
You can also change the time frame to differ from that of the chart's time frame if you want to study or test strategies.
Use this with other indicators (Bollinger Bands, MA's) to help your decision making.
Hope this helps.


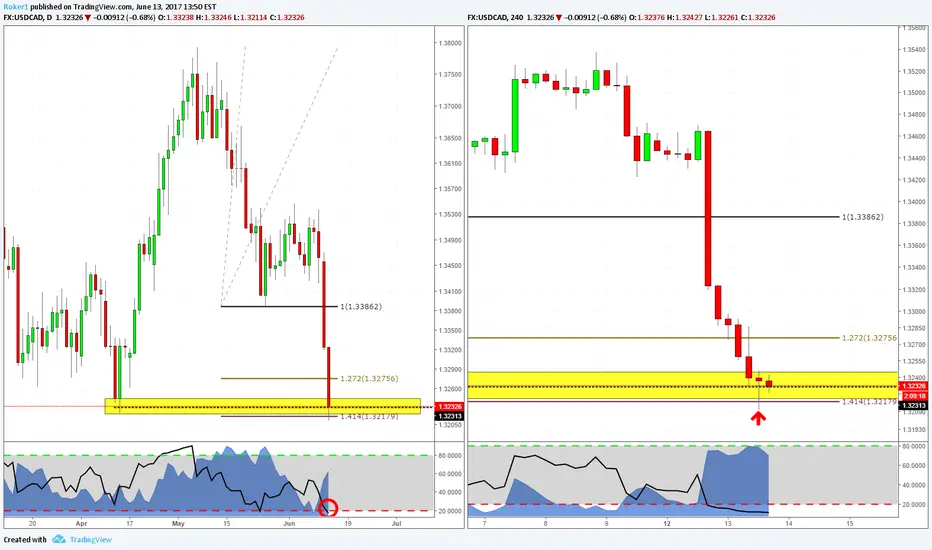
usdcad (short w/ time frame)usdcad,
chart with a time ext.
just about a 1.272 time ext of the AB time duration to the BD completion.
Analysis taken on basis of Scott Carney vol 1, pg 208 (Time considerations)

FORECAST USDJPYShort, Entry point at red trendline break.
Stop: 1 pip over the previous relative max.
Targets:
- 102.8 first target
- 102.27 sec. target
www.fxstreet.com
