Alien WorldsTLM/USDT i see the perfect buy zone now i looking for Bullish Rectangle
Entry Zone - 0.032 - 0.035
Target - 0.055
Stop Loss - 0.028
TLMUSD

#TLM/USDT 2Hr UPDATE !!Hello, members welcome to TLM/USDT 2hr chart update by CRYPTOSANDERS.
I have tried my best to bring the best possible outcome in this chart.
As we can see from the above-mentioned chart the TLM/USDT broke the inverse head and shoulder pattern and retested the green zone now, at the current scenario we are expecting that TLM will go up all the way to $0.0350 means almost 25%.
So if it moves to the green zone again then it will be the zone to go long on TLM/USDT
Remember:-This is not a piece of financial advice. All investment made by me is at my own risk and I am held responsible for my own profit and losses. So, do your own research before investing in this trade.
Sorry for my English it is not my native language.
Do hit the like button if you like it and share your charts in the comments section.
Thank you.

#TLM/USDT 1Hr Best Entry !!Welcome to this quick TLM/USDT analysis.
I have tried my best to bring the best possible outcome in this chart.
Reason for trade:- TLM/USDT looks bullish and buys the green zone and targets 40%.
TLM/USDT LONG TRADE SETUP
Entry:-$0.0327,$0.0340
Traget:- 40%
Stoploss:- $0.0315
leverage:-5x TO 10x
Remember:-This is not a piece of financial advice. All investment made by me is at my own risk and I am held responsible for my own profit and losses. So, do your own research before investing in this trade.
Sorry for my English it is not my native language.
Do hit the like button if you like it and share your charts in the comments section.
Thank you...

TLM USDT LONG AT LEAST 100%The graph indicates Ascending triangle pattern. It is an awesome sign to pump.

TLM alien worlds token price predictionMy TLM alien worlds token price prediction, i am bullish as this crypto has on the ground since one year. Its time to rise up this crypto

TLMUSDT With my previous analysis TLM gain 42% Profit. Which is still running.
Now there's a big Cup&Handle handle pattern. If we break and manage at 0.156 level. Then more 73% Profit coming for allien worlds. And the target would be 0.275.
Let's manage your risk accordingly with that SL TP everything.

TLM IS READY TO FLY🚀Please support this idea with a LIKE👍 if you find it useful🥳
Not a financial advice🙅🏼♂️
A bullish confirmation is seen here with a breakout from the previous high and a pullback to the area at $0.1181 as indicated on the chart.
Price is in an uptrend to price targets at $0.15, $0.17 and $0.19.
What do you think?
Share your opinion in the comment section✍️
You can also demand for analysis of your preferred coin
Follow me stay updated about this coin and more helpful projects like this🎁
Happy Trading💰🥳🤗


TLM - my next trade!Hey Guys, TLM looks good for me and I opened already a little position.
DYOR!
No financial advice!
Happy Trading!

TLM IDEA
TLM will also follow BTC.
A lot of other bearish signs there, but not going to highlight all. Invalidation is at Cross

💥TLMUSDT - TO FALL TO $0.0880Please support this idea with a LIKE👍 if you find it useful🥳
Not a financial advice🙅🏼♂️
Price is following the pennant pattern. It need to test the lower trendline once more. Therefore, I expect price to rise upward and fall to $0.0880.
What do you think?
Share your opinion in the comment section✍️
You can also demand for analysis of your preferred coin
Follow me stay updated about this coin and more helpful projects like this🎁
Happy Trading💰🥳🤗

TLMUSDT - TO RANGE BEFORE BREAKOUT🚀Please support this idea with a LIKE👍 if you find it useful🥳
Not a financial advice🙅🏼♂️
The blue box is a mini accumulation volume to break price to the upside.
Inside the bigger falling wedge, we have an inner trendline which made a falling wedge pattern too.
For we to have a valid breakout, Price needs to break the inner trendline upward;
Price needs the consolidation range upward; and
break the bigger falling wedge to the upside.
What do you think?
Share your opinion in the comment section✍️
You can also demand for analysis of your preferred coin
Follow me stay updated about this coin and more helpful projects like this🎁
Happy Trading💰🥳🤗

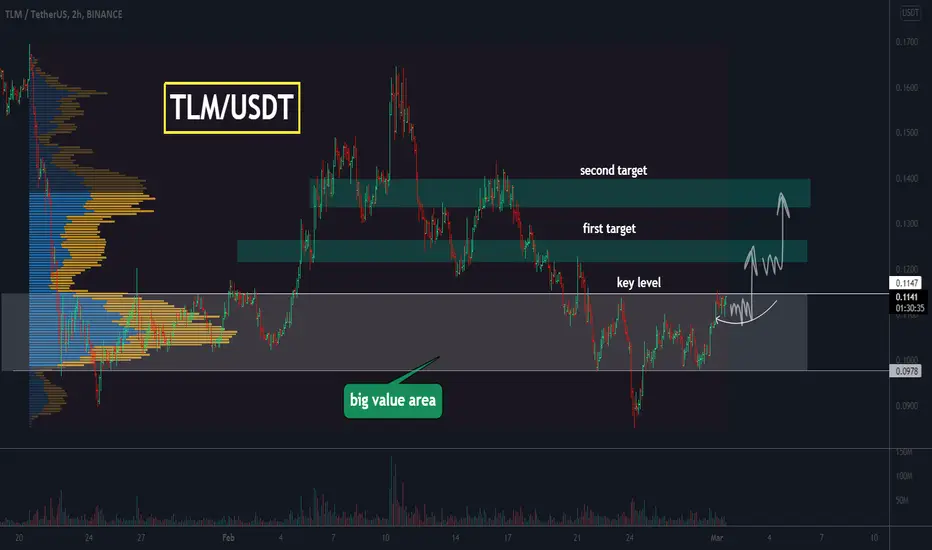
TLM, the price has started to squeeze near a key level!TLM is in a big value area. The price is close to the key level, which is the upper limit of the trading range. Now the price starts to squeeze, this is a good signal, a signal for a possible breakout.
In the case of squeezing and breakout of the key level, there could be a good opportunity to buy.
Write in the comments all your questions and the instruments you want to see analyzed.
Friends, press the "like" button, write comments and share with your friends - it will be the best THANK YOU.
P.S. Personally, I open an entry if the price shows it according to my strategy.
Always do your analysis before making a trade.
TLM, breakout as a good buying opportunityThe TLM is in a local range. The upper boundary of the range, which acts as a key level, can be highlighted on the chart. A squeeze and breakout of the key level could be a good buying opportunity.
Write in the comments all your questions and instruments analysis of which you want to see.
Friends, push the like button, write a comment, and share with your mates - that would be the best THANK YOU.
P.S. I personally will open entry if the price will show it according to my strategy.
Always make your analysis before a trade.

Alien Worlds TLMUSDT Accumulation zone has been hit. Whats nextHello Traders,
i like this project good fundamentals and good price action.
Some stats for BINANCE:TLMUSDT :
Market Cap
$99,946,154
Circulating Supply
914,030,370.25 TLM
Max Supply
10,000,000,000
Total Supply
5,189,345,239

Don't miss the great opportunity TLM/USDT
Don't miss the great opportunity to buy TLM
We are going wild soon
Join the 🐋 team
Good luck ✔

TLMUSDT - 10 jan 2022TLM reaches a good zone that you can divide your entries within the green zone as shown, price down and low volume means it is a correction to grab some liquidity
our entries will be as shown on the chart or wait the breakout with confirmation
first 2 targets will be easily to reach, the other targets will take time

TLM Update Sharing my latest analysis on TLM coin , as you can see trendline acting as strong support , you car refer this to take your trades

TLM - BREAK OUT!!!Except for the June 2021 crash. TLM's support line did a great job of keeping the price above it.
Currently, the price has broken out from the downtrend so we can expect a beautiful scenario in the near future.
Short-term target: 0.27 - 0.33 - 0.37
I believe we will see this price soon!
Have a nice day!

TLM/USDT Perfect bearish retest and Now looks bearish or Bullish#TLM/USDT Overview:-
$TLM current Price = $0.210
Overall This is also Bearish in LTF and In 2D time frame we can see Bearish Retest already done and Rejected from Resistance 1.
Now..?
As per chart if S1 break then we can see best entry around $0.151
This will also Bullish Retest level so Best time to Enter in $TLM
If $TLM break 1st Red TL then it will enter in Bull zone.
In Long Term it can hit $5 also.
Targets = Resistance
Support: $0.20/$0.151

TLMUSDT Aliens world 👉TLM
Since from my last analysis 32% up. Let's take some profit here. Long again in dip.

TLM - will history repeat itself?A wedge pattern is formed on the TLM chart. There was a similar scenario in November this year. In the event of a breakdown of the wedge, there could be a good buying opportunity. Last time after the breakdown of this pattern, there was a strong rally and the price went up by 120%. It will be interesting to see what happens this time.
Write in the comments all your questions and instruments analysis of which you want to see.
Friends, push the like button, write a comment, and share with your mates - that would be the best THANK YOU.
P.S. I personally will open entry if the price will show it according to my strategy.
Always make your analysis before a trade.

TLM - a falling wedge has formed on the chart!In the last idea, we marked the global picture on the TLM chart. And already then a descending wedge was forming. Now the pattern is still forming and the price is starting to squeeze near the upper boundary, which is a good signal - a signal for a breakdown!
In case of a breakdown or a retest of the upper boundary as support, there could be a good buying opportunity.
In the event of a false breakdown, close the trade and open a sell position.
Write in the comments all your questions and instruments analysis of which you want to see.
Friends, push the like button, write a comment, and share with your mates - that would be the best THANK YOU.
P.S. I personally will open entry if the price will show it according to my strategy.
Always make your analysis before a trade.
