TLMUSDT Analysis (LOCAL VISION)Hello friends.
Please support my work by clicking the LIKE button👍(If you liked). Also i will appreciate for ur activity. Thank you!
Everything on the chart.
Entry: market and lower
Target: 0.135 - 0.18 - 0.21
Stop: ~0.085 (depending of ur risk). ALWAYS follow ur RM .
Risk/Reward: 1 to 4
risk is justified
Good luck everyone!
Follow me on TRADINGView, if you don't want to miss my next analysis or signals.
It's not financial advice.
Dont Forget, always make your own research before to trade my ideas!
Open to any questions and suggestions.
Tlmusdtanalysis

TLMUSDT - TO RANGE BEFORE BREAKOUT🚀Please support this idea with a LIKE👍 if you find it useful🥳
Not a financial advice🙅🏼♂️
The blue box is a mini accumulation volume to break price to the upside.
Inside the bigger falling wedge, we have an inner trendline which made a falling wedge pattern too.
For we to have a valid breakout, Price needs to break the inner trendline upward;
Price needs the consolidation range upward; and
break the bigger falling wedge to the upside.
What do you think?
Share your opinion in the comment section✍️
You can also demand for analysis of your preferred coin
Follow me stay updated about this coin and more helpful projects like this🎁
Happy Trading💰🥳🤗

TLM/USDT 2HOUR UPDATE BY CRYPTOSANDERSWelcome to this quick
TLM //USDT analysis in the chart.
I have tried my best to bring the best possible outcome in this chart.
Reason of trade:- TLM/USDT widening formations are in line with the right angle and descending patterns and retest the trade line and buy is most important at entry zone and stop-loss
Entry:- $0.1073,$0.1105
Traget:-
T1:-$O.1150
T2:- $0.1207
T3:- $0.1276
T4:-$0.1336
T5:-$0.1411
Stoploss:- $0.1045
Remember:-This is not a piece of financial advice. All investment made by me is under my own risk and I am held responsible for my own profit and losses. So, do your own research before investing in this trade.
Happy trading.
Sorry for my English it is not my native language.
Do hit the like button if you like it and share your charts in the comments section.
Thank you...

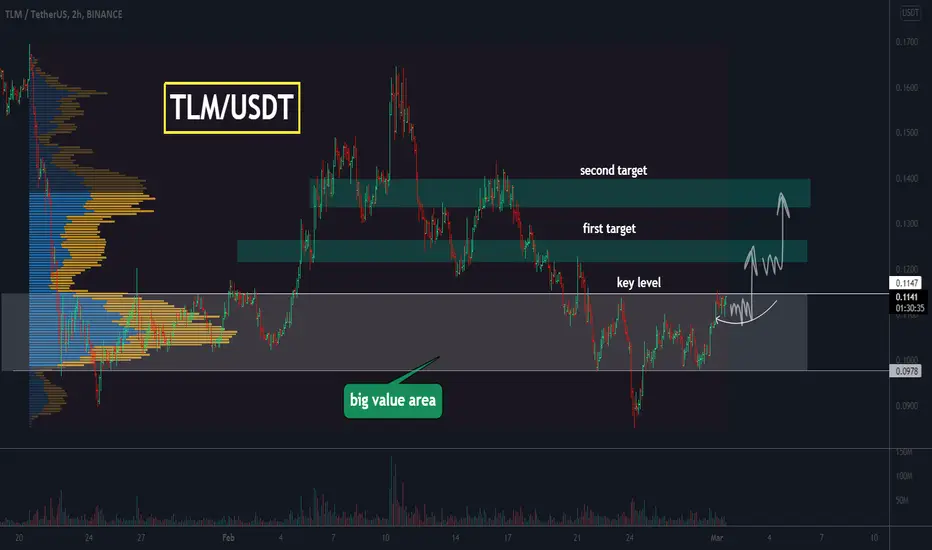
TLM, the price has started to squeeze near a key level!TLM is in a big value area. The price is close to the key level, which is the upper limit of the trading range. Now the price starts to squeeze, this is a good signal, a signal for a possible breakout.
In the case of squeezing and breakout of the key level, there could be a good opportunity to buy.
Write in the comments all your questions and the instruments you want to see analyzed.
Friends, press the "like" button, write comments and share with your friends - it will be the best THANK YOU.
P.S. Personally, I open an entry if the price shows it according to my strategy.
Always do your analysis before making a trade.
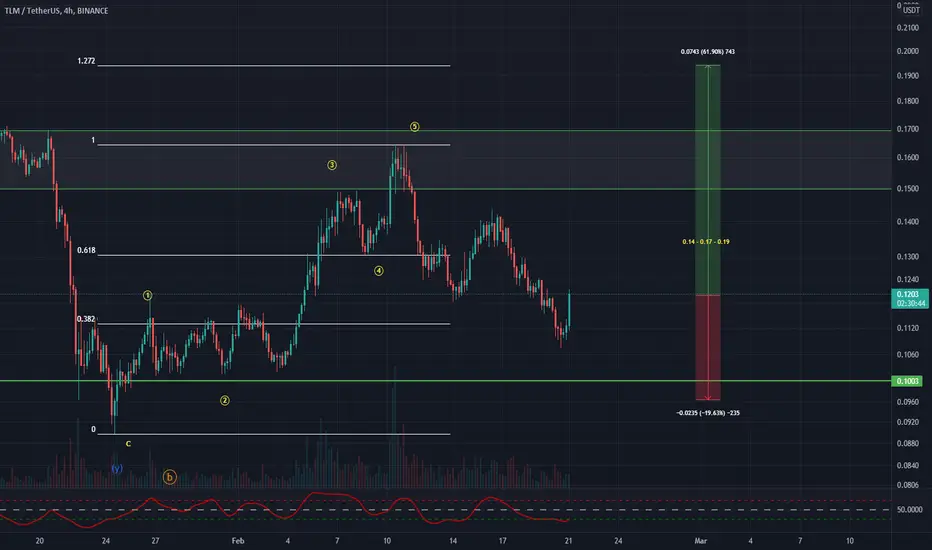
TLMUSDT Analysis (LOCAL VISION)Hello friends.
Please support my work by clicking the LIKE button👍(If you liked). Also i will appreciate for ur activity. Thank you!
Everything on the chart.
Entry: market and lower
Target: 0.14 - 0.17 - 0.19
Stop: ~0.095 (depending of ur risk). ALWAYS follow ur RM .
after first target reached move ur stop to breakeven
Risk/Reward: 1 to 3
risk is justified
Good luck everyone!
Follow me on TRADINGView, if you don't want to miss my next analysis or signals.
It's not financial advice.
Dont Forget, always make your own research before to trade my ideas!
Open to any questions and suggestions.
TLMUSDT WAVE ANALYSIS (GLOBAL VISION)Hello friends.
Please support my work by clicking the LIKE button👍 (If you liked).Thank you!
Everything on the chart.
Entry: market and lower
MAIN TARGET ZONE AT THE END OF BULL RUN: 0.65-0.8$
Stop: ~0.07 (depending of ur risk). ALWAYS follow ur RM .
Risk/Reward: 1 to 13
Risk is justified.
Good luck everyone!
Follow me on TRADINGView, if you don't want to miss my next analysis or signals.
It's not financial advice.
Dont Forget, always make your own research before to trade my ideas!
Open to any questions and suggestions.

Alien Worlds (TLM) formed bullish Cypher for upto 375% huge pumpHi dear friends, hope you are well and welcome to the new trade setup of Alien Worlds ( TLM ) token.
Previously we had a nice harmonic trade of TLM:
Now on a weekly time frame, TLM formed a bullish Cypher pattern.

TLM, breakout as a good buying opportunityThe TLM is in a local range. The upper boundary of the range, which acts as a key level, can be highlighted on the chart. A squeeze and breakout of the key level could be a good buying opportunity.
Write in the comments all your questions and instruments analysis of which you want to see.
Friends, push the like button, write a comment, and share with your mates - that would be the best THANK YOU.
P.S. I personally will open entry if the price will show it according to my strategy.
Always make your analysis before a trade.


Aliens World TLM LongCoin: Aliens World TLM
Type of signal : Spot
Entry Price : 0.06-0.11$
Price now : 0.10$
Goals:
Tp1 0.135$
Tp2 0.1588$
Tp3 0.21$
Tp4 0.263$
Tp5 0.35$
Long-Term
0.40$-0.50$-0.75$-1$-2$
SL Hold

TLM Buy PositionI found a price movement pattern. It keeps repeating and I think this is one of the best position. We are in a good spot to buy TLM coins.


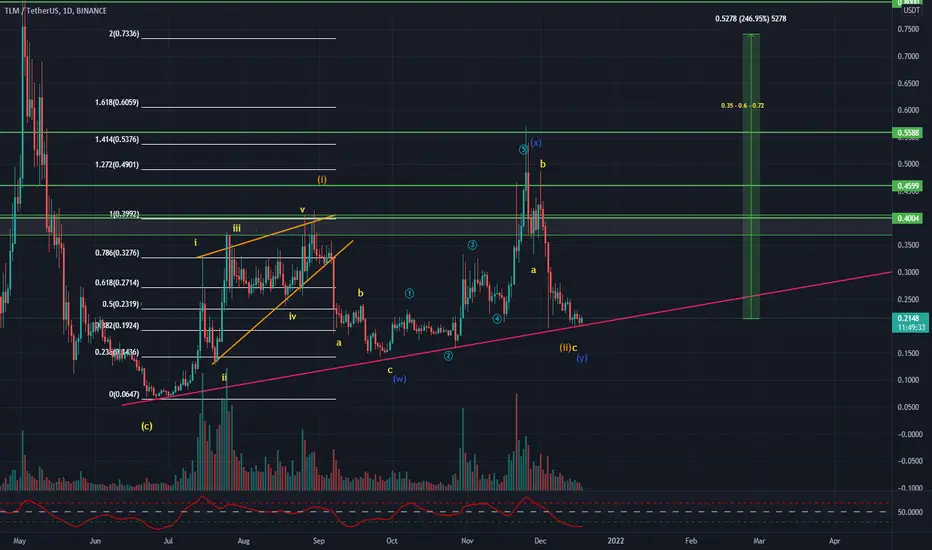
TLMUSDT midterm Analysis (+240% potential from here)Hello friends.
Please support my work by clicking the LIKE button(If you liked).Thank you!
Everything on the chart.
open pos: market and lower
target: 0.35 - 0.6 - 0.72
after first target reached move ur stop to breakeven
cancellation of growth, consolidation below 0.1
stop: im w/o stop (depending of ur risk). ALWAYS follow ur RM .
risk is justified
Good luck everyone!
Follow me on TRADINGView, if you don't want to miss my next analysis or signals.
It's not financial advice.
Dont Forget, always make your own research before to trade my ideas!
TLM Update Sharing my latest analysis on TLM coin , as you can see trendline acting as strong support , you car refer this to take your trades

TLM ANALYSISI AM BULLISH IN THIS TRADE
NEED TO WATCH IT CAREFULLY
ALL DEPEND ON BTC MOVEMENT
Broadening top formation
stoploss at 0.1800$
target 0.2700$

TLMUSDT Aliens world 👉TLM
Since from my last analysis 32% up. Let's take some profit here. Long again in dip.

TLM - will history repeat itself?A wedge pattern is formed on the TLM chart. There was a similar scenario in November this year. In the event of a breakdown of the wedge, there could be a good buying opportunity. Last time after the breakdown of this pattern, there was a strong rally and the price went up by 120%. It will be interesting to see what happens this time.
Write in the comments all your questions and instruments analysis of which you want to see.
Friends, push the like button, write a comment, and share with your mates - that would be the best THANK YOU.
P.S. I personally will open entry if the price will show it according to my strategy.
Always make your analysis before a trade.

TLM - a falling wedge has formed on the chart!In the last idea, we marked the global picture on the TLM chart. And already then a descending wedge was forming. Now the pattern is still forming and the price is starting to squeeze near the upper boundary, which is a good signal - a signal for a breakdown!
In case of a breakdown or a retest of the upper boundary as support, there could be a good buying opportunity.
In the event of a false breakdown, close the trade and open a sell position.
Write in the comments all your questions and instruments analysis of which you want to see.
Friends, push the like button, write a comment, and share with your mates - that would be the best THANK YOU.
P.S. I personally will open entry if the price will show it according to my strategy.
Always make your analysis before a trade.

Is TLM going to skyrocket❓❓❓In the last idea, we said that a break of the upper boundary of the wedge could be a good buying opportunity.
After the breakout, the price has already risen by 30%, which is a very good result.
A key level and a local support level can now be identified on the chart. The price is squeezed between these two levels. On the technical analysis side, the trend has reversed and it is worth looking for entry points to buy.
In case of a squeeze and breakout of the key level, there could be a good buying opportunity.
Write in the comments all your questions and instruments analysis of which you want to see.
Friends, push the like button, write a comment, and share with your mates - that would be the best THANK YOU.
P.S. I personally will open entry if the price will show it according to my strategy.
Always make your analysis before a trade.

long
I think in the range are the best places to returneth and breaking the range and continue the process is very important. This analysis is only for your better perspective


TLM chart Here is my chart analysis on TLM coin (Aliens worlds) . Till now trendline is acting as a good support , once broken you expect the price to be around 0.13 and for quick trade 0.1550 can be good opportunity .

TLM- What a Bargain!What a bargain huh?
You can see my way?
What do you think?
Stay following
Thanks
