Bond Bulls Smell Blood: 20-Year Yields Likely to Fall🧩 Fundamental Bear Case for 20-Year Yields
1. Recession Risk and Slowing Growth
Leading economic indicators (e.g., ISM Manufacturing, Conference Board LEI) continue to suggest softening demand across key sectors.
A recession or significant slowdown would drive capital into long-duration Treasuries, causing yields to fall as bond prices rise.
Historically, 20-year yields fall 200–300bps from cycle peaks during recessions. With yields near 5%, there is ample downside room.
2. Federal Reserve Policy Pivot
The Fed’s hiking cycle appears to be at or near its terminal point. Rate cuts in 2025 are increasingly priced in, especially as inflation moderates.
If inflation continues to decelerate toward the Fed’s 2% target while growth slows, the Fed may be forced to ease sooner or more aggressively than expected.
Long-duration bonds, including the 20Y, are highly sensitive to forward rate expectations and would benefit from a dovish pivot.
3. Disinflationary Trends
Core inflation metrics (e.g., Core PCE, Core CPI) are in year-over-year decline.
Key disinflationary forces:
Wage pressures have eased as labor markets normalize.
Housing costs, which lag in CPI data, are projected to fall further.
Supply chain normalization continues post-COVID.
These factors reduce the need for elevated long-term yields, especially with inflation expectations anchored.
4. Supply-Demand Dynamics Favor Treasuries
Despite large Treasury issuance, global demand remains strong:
Foreign buyers (e.g., Japan, EU) seek higher yields as their home rates remain low or negative.
U.S. institutions (pensions, insurance funds) are rebalancing into risk-free long bonds amid equity volatility.
A risk-off rotation or broader de-leveraging cycle would only accelerate this demand.
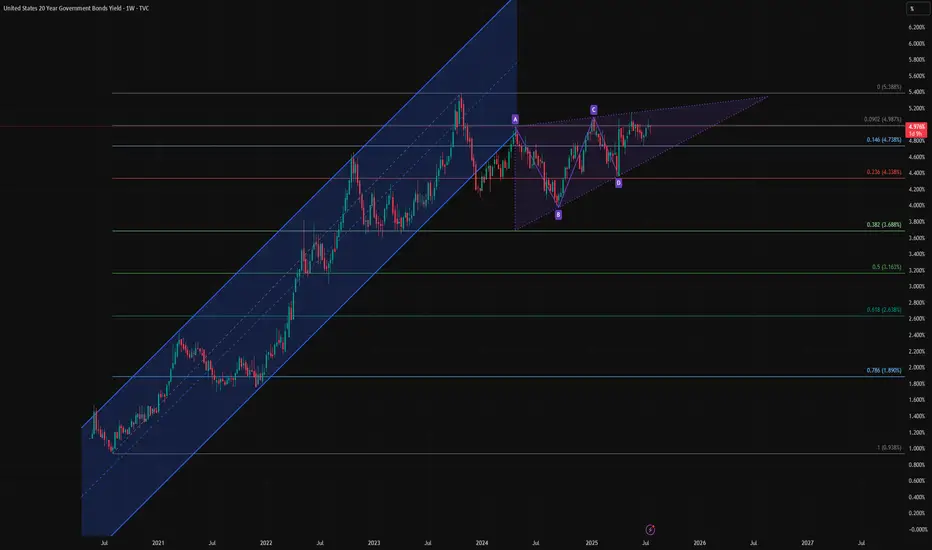
🔍 Technical Summary
Rising wedge pattern is nearing a potential breakdown — a bearish structure signaling exhaustion.
Price is failing to reclaim the previous uptrend channel, now acting as resistance.
A completed harmonic AB=CD pattern near recent highs suggests a mean-reverting move could be imminent.
Closest technical targets include:
4.33% (23.6% Fib)
3.68% (38.2% Fib)
Possibly even 3.16% (50% retracement) over the next 6–12 months if macro weakness persists.
📌 Bottom Line
The combination of:
Cooling inflation
A Fed pivot on the horizon
Rising recession risk
And technical exhaustion signals
Supports a bearish outlook for 20-year yields, meaning bond prices (especially long-duration instruments like TMF or TLT) could appreciate meaningfully from here.
TLT
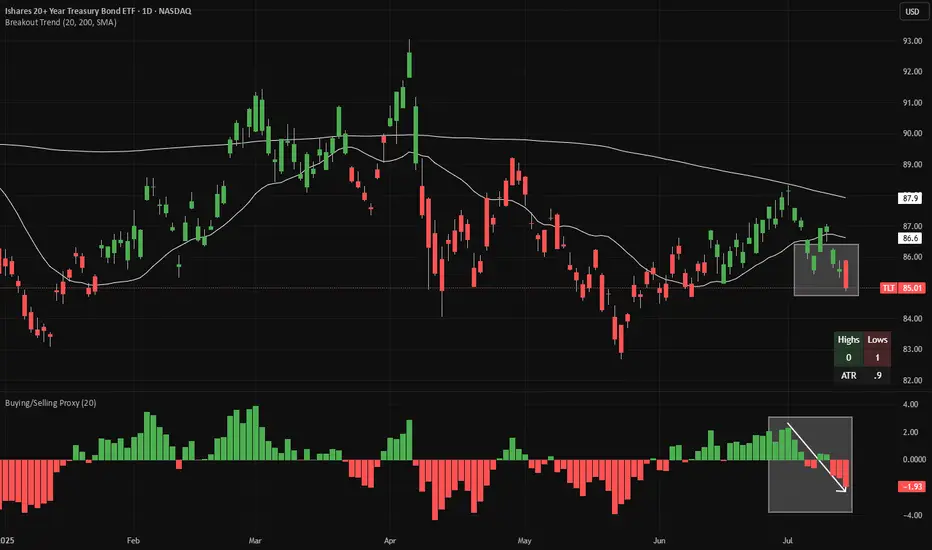
TLT short - warning signs from JapanTLT is making 20-day lows (red candles in the main chart), while continuing to make 20-week lows on a weekly chart (not shown). Meanwhile, looking at a proxy of net buying/selling (bottom panel), we have flipped from buying to selling.
Looking at Japanese bond yields, 10-year JGBs (JP10Y) just broke out of tight range. This is the third attempt to trade above ~1.59% recently, which we saw earlier today. As Japan's is one of the world's leading overseas investors, this is an obvious warning sign for bonds globally.
There is good risk/reward to short bonds here, with a stop-loss if the price closes at a 20-day high. If a 20-day high is made, the candles will change color from red to green.
Both indicators (Breakout Trend and Buying/Selling Proxy) are available for free on TradingView.
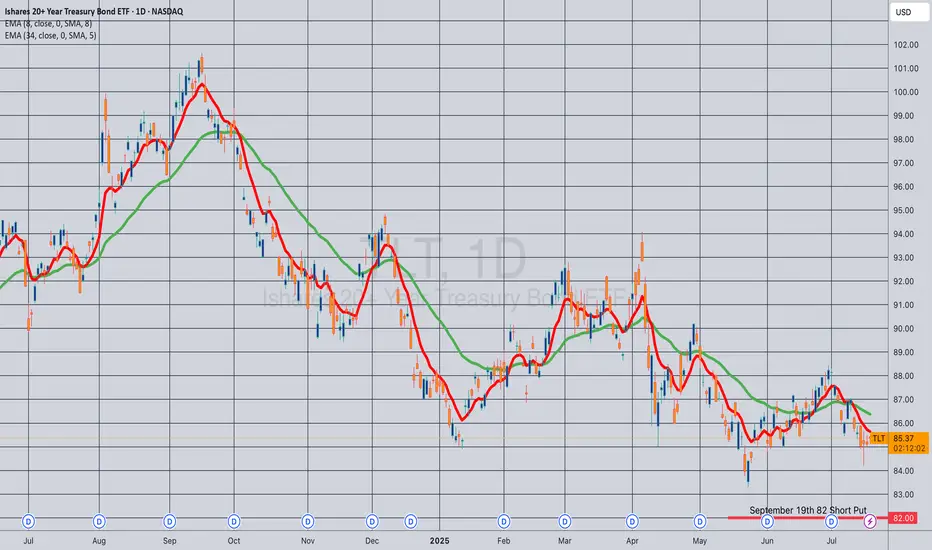
Opening (IRA): TLT September 19th 82 Short Put... for a .90 credit.
Comments: Adding to my position at strikes slightly better than what I currently have on ... .
Do we continue the wedge…Bonds have been hit hard and Crypto at Ath trend lines, do we need to finish the wedge
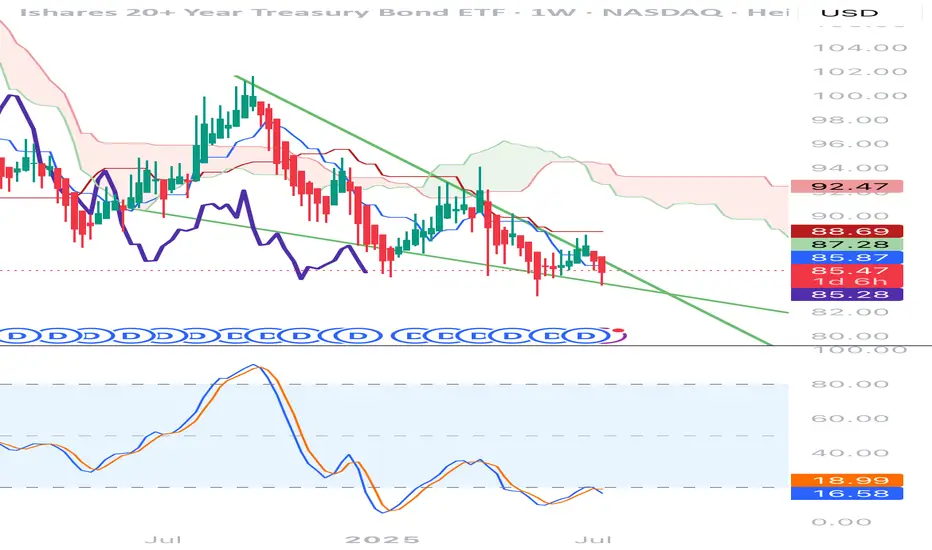
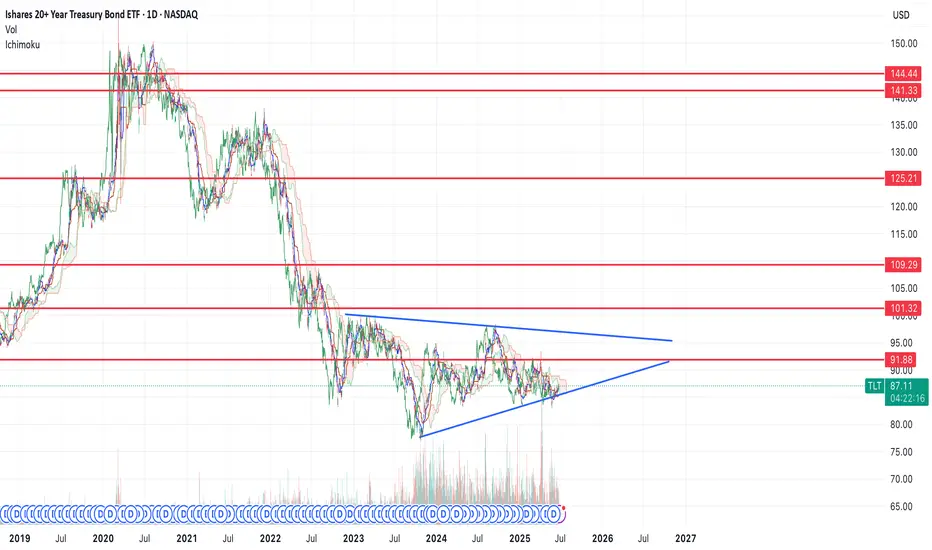
Bottom in for bonds, flight to safety trade coming soon $100+If we look at the chart of TLT, you can see that we're forming a bottoming reversal pattern.
We had a spike low down to $83 back to the middle of May and have now reclaimed the structure. I think that move marked the bottom.
I think it's very likely that bonds spike in the near future, if they can make it over the $92 resistance level, then I think price will see continuation and likely break the pattern finding the first resistance at that $101 level.
That said, I think this is the start of a larger move higher in bonds that will take us all the way up to the top resistance levels over the course of the next few years before the move is done and we start the long term trend in rates higher.
Opening (IRA): TLT Sept 19th 83 Short Put... for an .88 credit.
Comments: Camping out with a strike slightly below the 52-week low, where the options contract is paying a smidge more than 1% of the strike price in credit.
I don't really need more TLT, but wouldn't mind being assigned more at a lower price than the stock element of my covered calls.

How Will Uncle Sam Strike Back? – U.S. Treasuries on the Edge📉 How Will Uncle Sam Strike Back? – U.S. Treasuries on the Edge
After covering leveraged loans ( BKLN ), junk bonds ( HYG ), and investment-grade corporates ( LQD ), we now focus on the most important piece of the U.S. credit puzzle: Treasuries.
Specifically, the long end of the curve — tracked by TLT .
📊 What the Chart Shows
Left Panel (3D Chart)
• All-time highs in Feb 2020 at $179.80
• Long-term trendline going back to 2004
• Critical support was broken in 2022 — a structural breakdown
Right Panel (8H Chart)
• Clear descending channel since 2020
• Price has rejected from the channel top multiple times
• Recent bounces off the lower channel suggest a potential final flush
🧠 What Happened in 2022? (can't blame Trump for that...)
This wasn’t politics — it was policy.
• The Fed's fastest hiking cycle in decades
• Liquidity evaporated
• Long-duration bonds were abandoned
• The key trendline that had held for years was finally lost
That line — once support — is now resistance.
📐 My Technical Expectation
I expect one final slide before a reversal.
• Channel base sits at ~$76.32
• My projection targets $71.30 or even $68
• That would mark new all-time lows for TLT
🟡 After that? I expect a macro reversal , targeting:
• 🔼 $101 – mid-channel reversion
• 🔼 $112–115 – former support zone (2019–2022), now resistance
🔍 Macro Context
This chart isn’t just about price.
It reflects how markets are pricing confidence in U.S. debt .
And right now?
That confidence is shaky . With Trump turning 'orange' and taking it out against almost everyone else: China but also his allies(EU, Canada, Japan, etc )
🔄 Recap of the Series So Far:
• BKLN – record leveraged loan outflows
• HYG – junk bonds bounced at historical support
• LQD – investment grade bonds holding steady
• TLT – U.S. Treasuries under pressure, and possibly breaking down
📌 Next up?
🟧 CRYPTOCAP:BTC
Because when the world begins to question Treasuries , the search for alternative stores of value begins.
One Love,
The FXPROFESSOR 💙
ps. wait for the next posts...they might be epic!

$TLT breaking down? $80 target?TLT looks to be breaking down out of a bear flag.
We've already had multiple touches of the lower trend line and now it looks like price has broken through.
I think the most likely target is $79-80, but I've included multiple supports just incase we see a larger move than I'm expecting.
I'm looking to buy those levels should they hit as I think we'll see a longer term bullish move afterwards.

$IWM, small caps, not YET giving the "all clear"AMEX:IWM is the lone index still not in the clear 🚩 — backtesting its 200dma today and tagging the weekly mid-BB , just like in '22. Will it matter by week's end? If not, the bull is likely back across the board 🐂
This week's #CPI (Consumer Price Index) and #PPI (Producer Price Index) prints could significantly influence market direction across major indices — AMEX:SPY , NASDAQ:QQQ and AMEX:IWM — especially with rate cut expectations in flux. 🧵Here's how:
1. Hot CPI or PPI (above expectations):
AMEX:SPY : Likely to pull back as sticky inflation pressures broader S&P names, especially rate-sensitive sectors like real estate and utilities.
NASDAQ:QQQ : Could see sharper downside—tech stocks (many of which are high duration assets) are highly sensitive to interest rate expectations.
AMEX:IWM : Likely the hardest hit. Small caps suffer from tighter financial conditions and depend more on domestic borrowing costs.
🟥 Result: Bearish across the board, with small caps underperforming.
2. Cool CPI or PPI (below expectations):
AMEX:SPY : Broad lift, particularly in consumer discretionary and financials.
NASDAQ:QQQ : Strong rally—mega cap tech loves the prospect of lower yields.
AMEX:IWM : Outperforms if cooling inflation suggests easing ahead, since it's more leveraged to rate cycles and domestic growth.
🟩 Result: Bullish, with small caps possibly leading a relief rally.
3. In-line CPI/PPI :
Markets may stay choppy or consolidate, with AMEX:SPY and NASDAQ:QQQ more stable.
AMEX:IWM remains at risk of drifting lower unless there’s a strong dovish narrative from the Fed or other macro catalysts.
With small caps already lagging, this week’s inflation data could either validate its bearish divergence or spark a rotation rally if inflation
AMEX:SPY NASDAQ:QQQ TVC:VIX $ES_F $NQ_F $RTY_F TVC:TNX NASDAQ:TLT TVC:DXY #Tariffs #Stocks

S&P 500 - Key Levels and Measurements (Bonds vs Yields vs Homes)Happy Friday!!!
Starting with a BLANK chart, here are my key levels and measurements for the S&P 500
Earnings season is stable, more MAG 7 next week with AAPL, AMZN, META, MSFT
Trump and Company are softening the trade war narrative quickly and the market
is taking notice. Prices recovered nicely this week
5500 SPX is a key level for the bulls to push above - if done look for open space
melt-up into 5700-5800 resistance
If SPX rejects 5500 early next week we will be dealing with some more noise
and intermediate levels
4830 lows will be absolutely critical to maintaining a long-term bull market. You will
see why with this analysis.
Last piece is talking about bonds vs yields and the current housing market in the US
My belief is that yields stay sticky and home prices MUST drop to see any improvements
in affordability
Thanks for watching - have a great weekend!!!

Opening (IRA): TLT June 20th 79 Short Put... for a 1.61 credit.
Comments: High IVR. Starting to ladder out here, selling the 25 delta put ... .
Since I'm interested in acquiring more shares at 85 or below, I may let this run to expiry or approaching worthless (e.g., .05) ... . Can't believe it breaks 84.50 (which would be correspondent with a 5% yield on the 10-year T note), but you never know in this environment.

Opening (IRA): TLT May 16th 84 Short Put... for a 1.59 credit.
Comments: High IVR; back in range of 52-week lows. Working both ends of the stick in 20 year+ paper with a covered call on one end of the stick, short puts on the other ... .
Metrics:
Buying Power Effect: 82.41/contract
Max Profit: 1.59
ROC at Max: 1.93%
50% Max: .80
ROC at 50% Max: .96%
Since I want to potentially pick up additional shares at a lower price, I will run this to expiry or approaching worthless (e.g., .05).

The Bitcoin Trust Flow Cycles Model: What Comes Next📉 The Bitcoin Trust Flow Cycles Model: What Comes Next
Friends, if you’ve seen my last two posts, you already know we’re not talking about your average halving theory anymore. We're entering a new era of Bitcoin cycle analysis — and this model may change the way we look at macro rotation forever.
This is an update to The Bitcoin Trust Flow Cycles™ by FXPROFESSOR — a cyclical framework built around one question:
When trust flows in and out of traditional assets like Treasury bonds... what does Bitcoin do?
In this post, we zoom into the latest data: • TLT is testing key support again • Bitcoin is still rising — but in an inverted period • The next major reversion event may be approaching
I'll walk you through what happens when correlation flips , why these cycles compress over time, and how we could be approaching the next Bitcoin surge — not because of supply, but because of macro trust flow .
If you’ve been wondering what’s really moving the market... this might be the chart you’ve been missing.
One Love,
The FXPROFESSOR 💙

CREDIT CRISISWe are beginning to see evidence of a credit crisis starting. low demand for US bonds can trigger a currency crisis for the USD, higher rates will lead to refinancing company problems (especially with all the zombie companies that should have blown up over a decade ago.) and major economic depression-style job losses.
Currently, we are very early stages but things are moving at lightning speed on a macroeconomic level.
I know this is likely gibberish to most here pon trading view but it is of MASSIVE importance to your trading and investing.
CAUTION IS IN ORDER!!
Click boost, follow, and subscribe! I can help you navigate these crazy times.

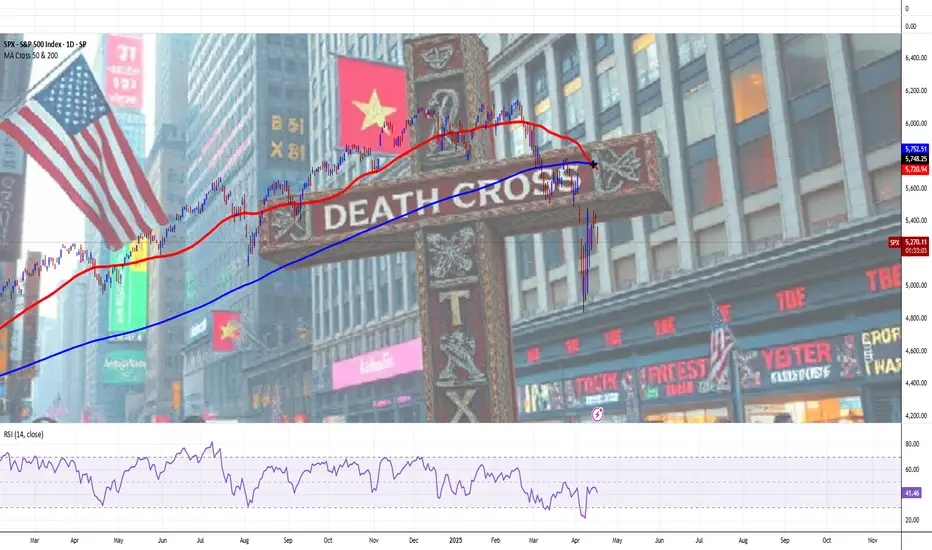
S&P 500 Index Goes 'Death Crossed' Again, Due To Unruly EconomyThe "Death Cross" is a technical chart pattern signaling potential bearish momentum in the US stock market, occurring when a short-term moving average (typically the 50-day) crosses below a long-term moving average (usually the 200-day).
Despite its foreboding name, historical data shows its implications are often less dire than perceived, serving as a coincident indicator of market weakness rather than a definitive predictor of collapse.
Historical Examples and Market Impact
The death cross gained notoriety for preceding major market downturns:
2000 Dot-Com Bubble: The Nasdaq Composite’s death cross in June 2000 coincided with the burst of the tech bubble, leading to a prolonged bear market.
2008 Financial Crisis: The S&P 500’s death cross in December 2007 foreshadowed the 2008 crash, with the index losing over 50% of its value by early 2009.
2020 COVID-19 Crash: The S&P 500, Dow Jones, and Nasdaq 100 all formed death crosses in March 2020 amid pandemic-driven panic, though markets rebounded sharply within months.
2022 Ukraine's War Crisis: The S&P 500, Dow Jones, and Nasdaq 100 all formed death crosses in March 2022 due to proinflationary surge on Ukraine's war and Arab-Israel conflict, leading to a prolonged bear market within next twelve months, up to March quarter in the year 2023.
These examples highlight the pattern’s association with extreme volatility, but its predictive power is inconsistent. For instance, the 2022 death cross in the S&P 500—its first in two years—occurred amid Fed rate hikes and geopolitical tensions, yet the market stabilized within weeks rather than entering a prolonged downturn.
Perspectives on Reliability and Use Cases
While the death cross reflects deteriorating short-term momentum, its utility depends on context:
Lagging Nature: As a lagging indicator, it confirms existing trends rather than forecasting new ones. The 50-day average crossing below the 200-day often occurs after prices have already declined.
False Signals: Post-2020 data shows the S&P 500 gained an average of 6.3% one year after a death cross, with Nasdaq Composite returns doubling typical averages six months post-cross.
Combined Analysis: Traders pair it with metrics like trading volume or MACD (Moving Average Convergence Divergence) to validate signals. Higher selling volume during a death cross strengthens its bearish case.
Strategic Implications for Investors
For market participants, the death cross serves as a cautionary tool rather than a standalone sell signal:
Short-Term Traders: May use it to hedge long positions or initiate short bets, particularly if corroborated by weakening fundamentals.
Long-Term Investors: Often treat it as a reminder to reassess portfolio diversification, especially during elevated valuations or macroeconomic uncertainty.
Contrarian Opportunities: Historical rebounds post-death cross—such as the 7.2% Nasdaq gain three months after the signal—suggest potential buying opportunities for risk-tolerant investors.
Fundamental Challenge
Stocks Extend Drop as Powell Sees Economy ‘Moving Away’ From Fed Goals
Powell sees economy ‘moving away’ from job, price goals due to Trump's tariff chainsaw.
Fed well positioned to wait for policy clarity. Strong jobs market depends on price stability, he adds.
Stocks extend declines, bonds rally as Fed chair speaks.
Conclusion
The "Death Cross" remains a contentious yet widely monitored pattern. Its dramatic name and association with past crises amplify its psychological impact, but empirical evidence underscores its role as one of many tools in technical analysis. Investors who contextualize it with broader market data—such as earnings trends, interest rates, and macroeconomic indicators—are better positioned to navigate its signals.
While it may foreshadow turbulence, its historical track record emphasizes resilience, with markets often recovering losses within months of the pattern’s appearance.
--
Best wishes,
Your Beloved @PandorraResearch Team 😎
// Think Big. Risk Less
Ishares 20+ Treasury Bond | TLT | Long in the $90sIshares 20+ Treasury Bond NASDAQ:TLT are particularly sensitive to interest rates: the price moves up when they are lowered and down when they rise. Locally, I'm witnessing banks lower their interest rates for CDs and shorten the duration for those with high-yielding returns. The general political rhetoric, especially due to the election cycle, is a push for the Federal Reserve to drop them. Now, despite the possible negative economic implications of lowering interest rates too soon if inflation is high, there is a good probability they may be lowered (even slightly) in 2024... perhaps September?
This analysis isn't to time the bottom perfectly, though. Instead, it's a probability assessment. Personally, TLT in the low $90s is in a long-term "buy-zone".
Target #1 = $104
Target #2 = $122
Target #3 = $170+ (very long-term view / economic crash... let's hope not, though)

iShares 20 Year Treasury Bond | TLT | Long in the $80sFor the patient, one of the "safest" investments is in long-term treasury bonds (specifically NASDAQ:TLT ). For those who may not understand why, bond prices move inversely to yields. If interest rates drop (which the Federal Reserve has stated is going to happen this year), NASDAQ:TLT will rise. If interest rates rise (like what happened in early 2022), NASDAQ:TLT will fall. But all information from the Federal Reserve points to interest rate cuts starting this year *or* in the near future.
As of April 1st, 2025, the dividend yield for NASDAQ:TLT is 4.52%. That interest rate beats the vast majority of savings accounts right now. I don't think we will see NASDAQ:TLT prices in the $80's longer than a year or two. A contrarian may argue "inflation is rising!", but the data continue to point to it actually stabilizing. Yes, prices are higher compared to 4-5 years ago for just about everything... but the higher prices are "stable". Tariffs may put a slight wrinkle in this stability in the near-term, but I think the economy is already slowing and the Federal Reserve will be pressured to start dropping interest rates sooner than later.
I believe a global economic bust is inevitable - but no one knows when. Anyone who says they can time it is a charlatan. If/when a global economic bust occurs, the Federal Reserve will drop interest rates (like what happened in 2020) to get the economy juiced up again. NASDAQ:TLT will double in price or go further.
My general point is I *believe* NASDAQ:TLT is nearing a low and any future declines (especially below $80) are personal opportunities for buy-and-hold. It's a solid hedge with a good dividend. Options don't give you that and timing events is a guessing game for every retail trader. So, as someone who tries to think beyond the "now", I am gathering shares, enjoying the dividend, and not touching them until a global economic bust occurs. Currently holding positions at $85, $86, $87, and $90.
Targets:
2027: $100.00
2028: $105.00
2029: $110.00
2030: $115.00
Bust (unknown timing): $170+

TLT Short Term OutlookHere we have TLT moving according to our previously published chart. We think TLT will move sideways, consolidating in the near future before finding direction. Although the outlook for TLT and the Bond Market is positive, in the near short term we may see a decline in the bonds market and choppy movements. We anticipate a zigzag move followed by a possible price retest of near $85 before bouncing back up.

TLT Analysis: Bonds in Turmoil Amid Tariff ChaosThis week, we've witnessed a dramatic shift as equities and U.S. government bonds cratered simultaneously. Trump, facing intense market backlash, notably reversed his aggressive tariff stance—forced by China's strategic response and market realities. At the start of the week, the yield on 10-year U.S. Treasuries stood at 4.00%, skyrocketing to 4.51% in just a matter of days—a massive jump by typical investor standards. This rapid rise significantly impacts mortgage rates, car loans, and credit card borrowing, reflecting broader financial stress.
The sharp rise in bond yields resembles the forced-selling reaction to Liz Truss and Kwasi Kwarteng's mini-budget crisis in 2022. Trump's tariff-induced inflation fears and notably weak demand in recent U.S. Treasury auctions further intensified bond selling pressure.
Technical Levels & Analysis for TLT
Hourly Chart
TLT has clearly broken crucial support levels, highlighting significant bearish momentum:
• Resistance Zone: $90.00 - $90.50
• Current Trading Zone: Approximately $88.50
• Support Zone: $86.50 - $87.00 (critical level to watch)
Daily Chart
The daily perspective confirms bearish sentiment with substantial price drops and increasing volatility:
• Major Resistance Area: $92.50 - $93.50 (strong overhead resistance where trapped longs may reside)
• Immediate Support Area: $86.50 - $87.00
Trade Ideas & Scenarios
Bearish Scenario (primary):
• Entry Trigger: A confirmed break below the immediate support at $86.50.
Profit Targets:
• Target 1: $85.00 (short-term follow-through)
• Target 2: $83.50 (potential deeper continuation)
• Stop Loss: Above $88.50, limiting risk in case of unexpected bullish reversal.
Bullish Scenario (counter-trend play):
• Entry Trigger: Strong recovery and hold above $89.00.
Profit Targets:
• Target 1: $90.50 (initial resistance)
• Target 2: $92.50 (secondary resistance level)
• Stop Loss: Below recent lows near $86.50 to tightly manage risk.
The rapid shifts in bond yields and tariffs are causing heightened market volatility. Investors must remain vigilant and maintain strict risk management. Watch these key TLT levels closely, especially amid ongoing tariff news and bond market reactions.

TLT - Monthly Targets (Long Term)Markets are currently tight squeezing due to Trumps terrifs etc, something has to give in, based on this chart:
- TLT has found a bid at .963 Fibonacci level @ $82.42 (EXTREME RETRACE)
- Dec 2, 2024 = the 369 ratio in time for $82.42 (time & price 📐)
NEXT TARGET PROJECTION IS 50% OF THE MAX TARGET ANGLE = ($121)
(BETWEEN 2025 - 2029)
MAX TARGET = $183 - $212
(BETWEEN 2025 - 2034)

Opening (IRA): TLT May 16th 96 Covered Calls... for a 92.13/contract debit.
Comments: Taking refuge in 20 Year + Paper until this market sorts itself out, targeting the strike that pays around 1% of the strike price in credit (the -96C paid 1.15).
Will generally look to roll the short call down at 50% max to the strike paying 1% of the strike price in credit if greater than 30 DTE remain; roll out at 50% to the next available monthly if <35 DTE remain.

Are bonds (TLT) about to fall?I've been thinking for the past few months that TLT would rally up to the 100 area. However, that move hasn't materialized and now I think there's a chance of yields rising and bonds falling. Over the past few weeks the chart has morphed more bearish.
It looks like something should set off the bond market this week and cause a lot of volatility in bonds.
I think there's potentially a chance we see the lower supports get hit before we see a relief rally.
Let's see how it plays out.

Nasdaq Bank Index 2025 Edition — Let's Make Sh#t Great Again.President Donald Trump's aggressive tariff policies, we at @PandorraResearch Team characterize as a term "Tariff Bazooka", have significantly destabilized the Nasdaq Bank Index NASDAQ:BANK , reflecting broader financial sector vulnerabilities and investor anxiety.
These tariffs, including a 25% levy on imports from Canada and Mexico, a 20% duty on Chinese goods, and proposed reciprocal tariffs, — have triggered cascading multi effects on banking stocks through several paths.
Market Volatility and Investor Flight
The Nasdaq Bank Index, which tracks major U.S. financial institutions, has been disproportionately impacted by tariff-driven uncertainty:
Sharp Equity Declines. Since Trump announced reciprocal tariffs in February 2025, the Nasdaq Composite NASDAQ:IXIC dropped over 10% from its December 2024 peak, erasing $1 trillion in tech-sector value. Banking stocks, sensitive to macroeconomic shifts, mirrored this downturn as investors fled equities for safer assets.
Risk-Off Sentiment. Bonds rallied as tariffs sparked fears of stagflation—a combination of stagnant growth and rising inflation—prompting a 30-basis-point drop in 10-year Treasury yields. This flight to safety squeezed bank profitability, as narrower yield curves reduce net interest margins.
Economic Contagion Mechanisms
Interest Rate Pressures.
Tariffs have raised input costs for businesses, contributing to inflationary pressures. The Federal Reserve now faces a dilemma: tolerate higher inflation or hike rates to curb it. Either scenario harms banks. Elevated rates could suppress loan demand and increase default risks, while delayed rate cuts prolong financial tightening.
Trade Retaliation and Sectoral Risks.
Canada, Mexico, and China have retaliated with tariffs on $155 billion (Canada) and unspecified billions (China, Mexico) of U.S. goods. For banks, this raises exposure to sectors like agriculture, manufacturing, and automotive - industries heavily reliant on cross-border trade. Loan defaults could surge if protected industries fail to offset higher costs.
Global Financial System Strain.
Trump’s tariffs risk fragmenting the rules-based trading system, undermining the stability that banks depend on for international transactions. The EU and other regions may retaliate by restricting U.S. financial services, directly impacting revenue streams for Wall Street firms.
Sector-Specific Impacts
Tech-Finance Nexus. Many Nasdaq-listed banks have significant exposure to tech firms, which face disrupted supply chains due to tariffs on Chinese components. This dual pressure — higher operational costs for clients and reduced tech-sector valuations — weakens banks’ asset quality.
Consumer Credit Risks. Tariffs on everyday goods (e.g., 25% on Mexican produce, 10% on Canadian energy) could elevate household expenses, straining consumer creditworthiness and increasing delinquency rates for retail banks.
Projected Outcomes
Economists estimate Trump’s tariffs could reduce U.S. GDP growth by 1.5 percentage points in 2025, with a stagflationary shock amplifying equity sell-offs. For the Nasdaq Bank Index, this implies prolonged volatility, compressed earnings, and potential credit rating downgrades as macroeconomic headwinds intensify.
Technical challenge
The main technical graph of Nasdaq Bank Index NASDAQ:BANK indicates on further Bearish trend in development, since major supports (nearly 5-month flat bottom and 52-weeks SMA) have been recently broken.
Conclusion
In conclusion, Trump’s tariff strategy has acted as a destabilizing force for financial markets, with the Nasdaq Bank Index serving as a barometer for sector-wide risks. By exacerbating economic uncertainty, inflation, and trade fragmentation, these policies have eroded investor confidence and heightened systemic vulnerabilities in the banking sector.
--
Best 'sh#t hits the fan' wishes,
@PandorraResearch Team 😎
