Bond Bulls Smell Blood: 20-Year Yields Likely to Fall🧩 Fundamental Bear Case for 20-Year Yields
1. Recession Risk and Slowing Growth
Leading economic indicators (e.g., ISM Manufacturing, Conference Board LEI) continue to suggest softening demand across key sectors.
A recession or significant slowdown would drive capital into long-duration Treasuries, causing yields to fall as bond prices rise.
Historically, 20-year yields fall 200–300bps from cycle peaks during recessions. With yields near 5%, there is ample downside room.
2. Federal Reserve Policy Pivot
The Fed’s hiking cycle appears to be at or near its terminal point. Rate cuts in 2025 are increasingly priced in, especially as inflation moderates.
If inflation continues to decelerate toward the Fed’s 2% target while growth slows, the Fed may be forced to ease sooner or more aggressively than expected.
Long-duration bonds, including the 20Y, are highly sensitive to forward rate expectations and would benefit from a dovish pivot.
3. Disinflationary Trends
Core inflation metrics (e.g., Core PCE, Core CPI) are in year-over-year decline.
Key disinflationary forces:
Wage pressures have eased as labor markets normalize.
Housing costs, which lag in CPI data, are projected to fall further.
Supply chain normalization continues post-COVID.
These factors reduce the need for elevated long-term yields, especially with inflation expectations anchored.
4. Supply-Demand Dynamics Favor Treasuries
Despite large Treasury issuance, global demand remains strong:
Foreign buyers (e.g., Japan, EU) seek higher yields as their home rates remain low or negative.
U.S. institutions (pensions, insurance funds) are rebalancing into risk-free long bonds amid equity volatility.
A risk-off rotation or broader de-leveraging cycle would only accelerate this demand.
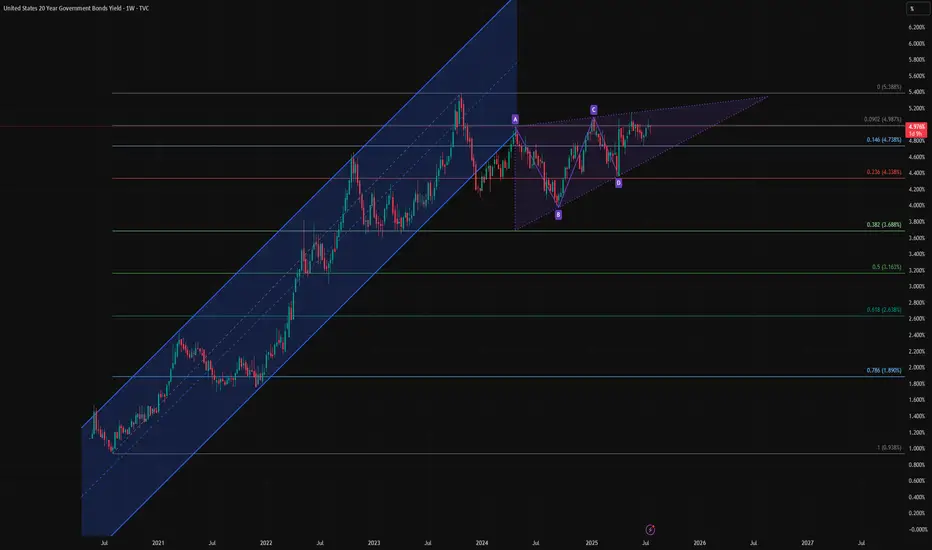
🔍 Technical Summary
Rising wedge pattern is nearing a potential breakdown — a bearish structure signaling exhaustion.
Price is failing to reclaim the previous uptrend channel, now acting as resistance.
A completed harmonic AB=CD pattern near recent highs suggests a mean-reverting move could be imminent.
Closest technical targets include:
4.33% (23.6% Fib)
3.68% (38.2% Fib)
Possibly even 3.16% (50% retracement) over the next 6–12 months if macro weakness persists.
📌 Bottom Line
The combination of:
Cooling inflation
A Fed pivot on the horizon
Rising recession risk
And technical exhaustion signals
Supports a bearish outlook for 20-year yields, meaning bond prices (especially long-duration instruments like TMF or TLT) could appreciate meaningfully from here.
TMF
Opening (IRA): TMF May 17th 39 Covered Call... for a 38.06 debit.
Comments: Along with TLT, one of the only red things on my ETF board. Doing a starter position here, selling the -75 delta call against shares to emulate the delta metrics of a 25 delta short put, but with the built-in defense of the short call.
Metrics:
Buying Power Effect/Break Even: 38.06/share
Max Profit: .94
ROC at Max: 2.47%
50% Max: .47
ROC at 50% Max: 1.24%
Will generally look to take profit at 50% max, add at intervals if I can get in at strikes/break evens better than what I currently have on, and/or roll out the short call at 50% max.

Opening (IRA): TMF May 16th 37 Covered Call... for a 36.05 debit.
Comments: Adding at strikes/break evens better than what I currently have on, selling the -75 delta call against shares to emulate the delta metrics of a 25 delta short put, but with the built-in defense of the short call.
Metrics:
Buying Power Effect/Break Even: 36.05/share
Max Profit: .95
ROC at Max: 2.64%
50% Max: .48
ROC at 50% Max: 1.32%
Will generally look to take profit at 50% max, look to add at intervals if I can get in at a break even better than what I currently have on, and/or roll out short call when that aspect hits 50% max.

Opening (IRA): TMF March 28th 36 Covered Call... for a 35.08 debit.
Comments: Selling the -75 delta call against shares on weakness to emulate the delta metrics of a 25 delta short put, but with the built-in defense of the short call.
Metrics:
Buying Power Effect/Break Even: 35.08
Max Profit: .92
ROC at Max: 2.62%
50% Max: .46
ROC at 50% Max: 1.31%
Will generally look to take profit at 50% max, add at intervals if I can get in at strikes/break evens better than what I currently have, and/or roll out the short call on approaching worthless if my take profit is not hit.

Opening (IRA): TMF March 21st 36 Covered Call... for a 34.85 debit.
Comments: Starter position. Selling the -75 delta call against shares to emulate the delta metrics of a 25 delta short put, but with the built-in defense of the short call.
Metrics:
Buying Power Effect/Break Even: 34.85
Max Profit: 1.15
ROC at Max: 3.30%
50% Max: .58
ROC at 50% Max: 1.65%
Will generally look to take profit at 50% max, add at intervals, assuming I can get in at strikes/break evens better than what I currently have on, and/or roll out the short call if my take profit is not hit.

Opening (IRA): TMF Feb 28th 35 Covered Call... for a 33.98 debit.
Comments: High IVR/IV at 40.7/44.2, which is no surprise, since this is a bullish 3 x leveraged 20 year paper exchange-traded fund. It does have a dividend that pays out quarterly in March, June, September, and December (annualized yield of 4.71%).
Selling the -75 delta call against shares to emulate the delta metrics of a 25 delta short put, but with the built-in defense of the short call. Using the February 28th expiry to keep things in that 45 DTE wheelhouse and will look to add at intervals, assuming I can get in at strikes/break evens better than what I currently have on.
Metrics:
Buying Power Effect/Break Even: 33.98/share
Max Profit: 1.02
ROC at Max: 3.00%
50% Max: .51
ROC at 50% Max: 1.50%
Will generally look to take profit at 50% max, roll in-profit short call out to reduce my break even.

$TLT long to 110 on February 20, 2025Everything is on the chart.
I am calling for TLT to rally from today's closing price of $86 to $110 by Thursday, February 20, 2025.
The Javier Milei Argentina experiment has been a huge success for Argentina, who is buddy buddy with the J's and Elon Musk, both of whom are buddy buddy with Trump.
At the time of this writing, $105 calls for 2/21/2025 are .05 each. If the target hits, they will be worth $5.0, for a total return of 10,000% (10X).
On the weekly chart, you can see the 200 week SMA coincides with my level on that date as well.
Feel free to share.

$TLT: Time for the bond market to wake up TLT at its trend line support, peak volumes, macd looks ready to curl up, last 3 times rsi was this low we saw a considerable bounce, plus a good cpi report on Thursday should provide the catalyst needed to cause a bounce in the bond markets.

TBT is a buy rate cuts likely are stalled LONGTBT is an inverse 20 year Treasury Bill ETF. At present, the Iran Israeli conflict threatens a
regional conflict to include the Red Sea and the Easter Mediterranean where oil tankers must
navigate to move oil from producer to consumer. Oil price escalation could go hand and hand
with geopolitical escalations. Oil and its derivatives are a primary driver of inflation in the
US. Inflation has been sticky and forcing the fed's ambitions to cut rate to be paused. The
Middle East escalation may make matters worse overall. Federal spending ( aid to Israel for
instance) is also a driver of inflation. The budget fight in DC is front and center. I see this
as good cause, to continue to take adds to my TBT position whenever I can find a dip worth
the discount as a further hedge against a correction in the equities markets which could come
on the horizon. Granted a dip of 2-3% from the ATHs is not much but when it hits 10% or more
and the VIX/UXXY continue to rise, there will be impetus in a hurry to hedge positions or close
them with more urgency. For for TBT, I believe that more is better.

IF the FED cuts, bonds will launch (20x Insurance Play Inside)Can't overrule the politicization of the FED and the rigging of the numbers. If CPI comes in 3.3 or lower the FED will cut rates.
I've also seen darkpool prints for TMF 3xTLT.
Here's an insurance play if the FED cuts rates: August 75 calls for TMF are .15. That's a return of 15-20x!! While waiting for the market to shake out.
Then I'd run into metals and miners...

TBT / TLT T Bill Inverse TreasuriesOn this daily chart of the ratio of TBT ( Treasury Bills Bearish ) to TLT ( the inverse Bullish)
over time. This serves to accentuate shifts in prices from factors affecting them both but
with opposite effects. Federal actions or even reports of economic data are some
of those factors.
This chart shows that about November 1st, TBT ad topped out and fell. They are inverses
of one another . What makes one go down will make the other go up and viceversa.
By February 1, TBT bottomed out and the ratio reversed. The cycle took 3 months.
On a lower time frame, cycling would be more frequent.
At present, it would appear to be time to sell TLT and / or buy TBT
What applies to the TBT /TLT ratio would also relate to TMV / TMF as a ratio.

TBT Inverse Treasuries ( Long Dates ) LONGTBT is shown here on a weekly chart. It transitioned froma downtrend into the present trend
up two years ago with the initiation of the rate hikes to cut down inflation by hitting its knees.
Inflation was the direct result of the money printing and stimulus as part of the federal
response to the complications of covid and lockdowns. Price is now ascending in a broadening
channel ( a megaphone pattern) reflecting increasing volatility as federal action or inaction
gets priced into buying decisions at treasury auctions. As for me, i will continue to build
a TBT position until it is obvious that the fed has launched an active agenda of rate cuts
which will fortify T-bill prices and make TLT the new runner.

TLT Treasuries Long breaks down under VWAP SHORTTLT on a 120 minute chart has continued its trend down since early December after a suddent
uptrend in November lasting for a two month until the end of 2023.
Inflation data is kicking the rate cut down the road of time.
Price has now fallen under the VWAP and all of the EMA lines including the EMA20.
Relative strength trending correlates with price . I conclude, TLT continues to be set up
SHORT or alternatively TBT LONG . I will take short trades at weekly highs on a 30-60
minute chart until signs of a reversal are seen on the chart.

FAZ Triple Leveraged Bearish Financial Sector LONGThe idea is on this FAZ 15 minute chart. This is a ply on the idea that a rate cut may get kicked
down the road and a rate increase may come into consideration as a result of the report
of "sticky inflation".

TLT- Are rate cuts postponed? LONGTLT has been in a broadening wedge and formed a falling wedge within the larger pattern.
Price bounced off the lower supoort trendline in the mid-morning of trading then rising
to break out of the falling wedge. I see this as an opportunity to take a long trade in TLT
and close out a TBT position at the same time. This reversal may be due to the value of
existing bonds with the implications of a rate cut postponed beyond June. The faster RSI line
has recovered to cross the 50 level lending further support to this long trade.

TMF long trade setup 3X Bullish TreasuriesTMF on the 4H chart is set up at the bottom descending support trendline of a symmetrical
triangle in the approach to the apex. Price appears ready to reach for the upper descending
resistance trend line and the Echo Indicator ( Lux Algo ) makes that forecast. Current
ambiguities in a rate cut soon upcoming will make values of Treasuries a complicated matter.
I am taking a long trade targeting 54 with a stop loss at 50 in consideration of the triangle
pattern. I have existing positions in TLT.

FAZ / FAS a demonstration of ratio-tradingHere on a daily chart the ratio of the Bearish Leveraged Financial ETF to its Bullish counterpart
is showing to be in a descending parallel channel. The chart is marked with comments about
trading considerations of these ratios at a given time. At present, the FAZ is undervalued
and should be bought. On the other hand, Bullish FAS, should be either sold if positions are
held.

TLT Long at VWAP Bounce T- Bills 20 yearsTLT on the 15 minute chart in the past two trading sessions consolidated and then fell into
a pullback to the support of the anchored mean VWAP. Relative volatility spiked and has
now contracted. I see this as a good entry to add to my TLT position having sold a good portion
of it three trading days ago when price showed topping wicks outside the fibonacci highest
band. This will be about $ 1.00 cheaper than before that sale and is part of a zig-zag
strategy for TLT overall.

TMV Triple Inverse Treasury Bill ETF LONGTMV on the 4H chart appears to be reversing a trend down since 12/28. YTD it is rising.
The reasonable target is the Fib 0.5 retracement at $40 while support for a stop loss
just below the POC line of the volume profile is $29.25. As such this is a 35% upside.
The RSI indicator shows the fast RSI rising and crossing over the slower RSI while the
relative volume indicator shows increasing volumes reacting to the price bottoming and
accumulation underway. I see this as a long trade set up while recognizing that fundamentals
such as interest rate adjustments and inflation data could impact the technicals.

US10Y - Is it a "sea change" or a strong buy for TLT and TMF ?In December 2022, Howard Marks told in an interview that a "sea change" is underway in markets.
When I have seen below charts of TVC:US10Y , I have remembered that interview:
(Unfortunately I needed to remove the graph due to lacking reputation points. Maybe you can view with //x/HZKlWa8U )
TVC:US10Y was in a downtrend in a channel since 1980 and this long lasting channel has been broken at April 2022, and upper line of the channel became support at July and August of 2022. So there are some signs that it's not a fake going out of channel like the one in 2020 March.
Does Howard Marks right by saying it's a "sea change" ?
And in this weekly chart of TVC:US10Y , we can see it has formed a new uptrend in a new channel:
(Maybe you can view the chart with /x/DHeM0t8W )
See how good it has used that upmoving support. Now, we are again hitting that support and if that support line is broken, it would be a "strong buy" for NASDAQ:TLT and AMEX:TMF .
Both graphs have given bullish divergence recently:
(Maybe you can view the charts with /x/2jGkJkCJ and /x/5NGqJ3Ze )
This week we will see if TVC:US10Y will break the channel and confirm the bullish divergence of TLT and TMF. If the support would been broken at TVC:US10Y , then 4.20 and 3.40 and 2.75 are the levels to watch for the bullish trend of NASDAQ:TLT and $AMEX:TMF.
In conclusion, if TVC:US10Y will break the channel this week, I'm long in NASDAQ:TLT and $AMEX:TMF.
If not, we will keep watching if Howard Marks was right and it's really a sea change.

Impulse correction ?? - TMF pump 🚀📣 Hello everyone!
I believe that in the next 3-5 months we can get a correction (growth - inverse chart) on TMF.
The US 20-year yield of 5.388% on October 23 could be the medium-term maximum, or we are already very close to it. To do this, it is necessary to observe more, since the trend on the same TMF chart has not yet been broken. Be careful and keep a close eye on this.
Target:
🎯 TP1 - $6.59
🎯 TP2 - $7.78
🎯 TP3 - 10$
Goodbye!

TBT- a bearish treasury ETF LONGTBT on the 30 minute time frame shows a trend up in an ascending parallel
channel now at the bottom of the channel where it could go up or breakdown
and go under the channel. The ZL MACD suggests some bullish divergence while
the dual TF RS indicator and the ADX oscillator are non-commital.
The immediate recent short term volume profile with a POC line above price
suggests a lot of trading above price and likely short sellers. A longer time
interval volume profile shows the POC line more than $1.00 below current price.
Price could easily gravitate in the direction of that price magnet.
Overall, I see a bias for a bearish move and will watch this to confirm. i will play
this with put options to leverge the amplitude of the move albeit at higher
risk.

TMV leverage inverse ETF for treasuries SHORTTMV on the one-hour chart tested two standard deviations above the mean VWAP in
both late May and early July it fell to one standard deviation below VWAP but then rose
sharply into beyond the two standard deviations line ( thick red ) ascending into a YTD high.
I believe that this is due to the recent federal debt creditworthiness downgrade.
The threatened rise of BRICS reserve currency and potentially adversely affects the
value of the dollar ( DXY) while supporting gold prices. I see this as a good continuation play
no matter the overextension of price. Both the dual MTF and the zero lag MACD however
suggest a pullback. The mass flow indicator does as well. As a result I will look at TMF
to go long trusting the indicators to give me a directional bias.
