𝗩𝗼𝗹. 𝗨𝗽𝗱𝗮𝘁𝗲: $VIX Weekly. Five-wave patternHas built a triangle (five-wave pattern) over the course of this year. If resistance ~32 continues to hold could see a pullback, which would be bullish for equities
$VXX $SPY $SPX $QQQ $GLD $TLT $TNX $DXY
TNX

TNX 10 YR Yield Needs to Cool Down 3.9%TNX 10 year yield ran too hot lately but will it cool down? I think we need to watch it at 3.9% if it has a retracement from there.

BTC: What to Watch Going into US FOMC Presser This WeekThe US Federal Reserve Open Committee (FOMC) meets Tuesday and Wednesday this week. The hawkish monetary policy that has been fostered by the FOMC has put pressure on risk assets for much of this year. The Federal Reserve, along with other central banks around the globe, have been attempting to tackle sticky inflation that has been running at high levels not seen in decades. Though some argue that inflation may have peaked, it remains sticky and well above central banks' targets, which in the US is 2%.
The Primary Chart above shows key levels to watch going into the FOMC presser. The downtrend line in blue, which is the zero line of the Fibonacci Channel, rejected price decisively on September 13, 2022. But with an important trendline such as this one, a retest of the line is not uncommon, similar to what occurred where BTC tested this line from March 28 to April 5, 2022 repeatedly before finally resuming the downtrend. This occurred at the end of BTC's powerful bear rally in March 2022 that coincided with equity indices' rally during that time.
The area of resistance that could be tested should price rally or whipsaw higher this week is between $19,900 and $21,416. The Primary Chart uses a yellow-colored ellipsis shape to capture the strong, dynamic resistance levels of this down trendline. The Fibonacci Channel also shows the parallel diagonal lines that run at Fibonacci proportions to this downtrend line, which also should be watched for price support in the coming weeks.
The Primary Chart also shows the key Fibonacci retracements of the entire summer rally. BTC has been holding just above its .786 retracement of the mid-June to mid-August 2022 rally. This level lies at $19,246, and price has made a couple attempts to break below it, each of which has failed, suggesting more sideways chop into the FOMC's meeting.
The .618 retracement of the summer rally is at $20,521, a level that should also be watched closely. BTC struggled to get above this level in June and July with two failed breakouts. Finally, after getting above this line, BTC began declining and fell back below it after its mid-August 2022 peak. BTC attempted one more rally above it in early September 2022, but this ended up as a failed breakout, another bearish signal along with the downtrend line.
In addition to the levels shown on the Primary Chart above, the Supplementary Chart below shows shorter-term Fibonacci levels that also may become relevant this week. Considering that this decline from September 13 to September 19, 2022, may be a completed wave 1 of some larger Elliott Wave structure, it becomes important to consider the retracements as places where the current corrective wave could reverse. These levels are $19,993, $20,526 (coinciding with the other .618 retracement level shown on the Primary Chart at $20,521), $21,058, and $21,815.
Supplementary Chart A: Fibonacci Retracements of September 13-19 decline
Given the impact interest rates—and tightening financial conditions—have had on risk assets, it may be prudent to also watch interest rates closely. For this purpose, see the 10-year yield chart below.
Supplementary Chart B: Current Uptrend in US 10-Year Yield (TNX) and Multi-Year High Reached
The 10-year yield has shown no signs of slowing down yet. It continues to push higher, holding its short-term upward trendline from around the start of August 2022 until the present. The longer-term uptrend line has remained in effect for 2.5 years since March 2020. Note also that the 8-day EMA has held as support along with the shorter-term steep upward trendline. Until this line breaks, it is unlikely that crypto assets and equities can make substantial progress toward reversing their current bearish trend structures.
For the curious, another chart showing the correlation coefficient between BTCUSD and TNX is shown in the final chart below. This shows that for most of 2022, the relationship between BTC and interest rates has been inverse. Many probably already have known this intuitively while reading news about increasing rates to combat inflation while simultaneously witnessing bear markets across most risk assets this year. This correlation coefficient has at times reached -.64 and -.68, showing fairly high levels of inverse correlation, which means that as yields push higher, BTC has fallen lower. This level has also dropped to lower levels of inverse correlation. Currently, the coefficient is at -.49.
Supplementary Chart C: Correlation Coefficient for BTCUSD and TNX (Weekly Chart)
________________________________________
Please note that this technical-analysis viewpoint is short-term in nature . This is not a trade recommendation but a technical-analysis overview and commentary with levels to watch for this week. Also note that countertrend trading, e.g., trading a rally in a bear market, is tricky and challenging even for the most experienced traders. Countertrend trades are lower probability trades as well.
This technical-analysis viewpoint could change at a moment's notice should price move beyond a level of invalidation. Further, proper risk-management techniques are vital to trading success.
Author's Comment: Thank you for reviewing this post and considering its charts and analysis. The author welcomes comments, discussion and debate (respectfully presented) in the comment section. Shared charts are especially helpful to support any opposing or alternative view. This article is intended to present an unbiased, technical view of the security or tradable risk asset discussed.
DISCLAIMER: This post contains commentary published solely for educational and informational purposes. This post's content (and any content available through links in this post) and its views do not constitute financial advice or an investment or trading recommendation, and they do not account for readers' personal financial circumstances, or their investing or trading objectives, time frame, and risk tolerance. Readers should perform their own due diligence, and consult a qualified financial adviser or other investment / financial professional before entering any trade, investment or other transaction.
BITSTAMP:BTCUSD
CME:BTC1!
BINANCE:BTCUSDT

$TNX still showing weakness but should be HIGHER!Another weak day for $TNX
This should be higher BUT why not?!
Serious negative divergence too
#FED & worldwide #CentralBanks
have made commitment to buy debt
OR
Maybe 75bps won't make it for whatever reason?
Hmmm

$TNX showing strength but it's being fought$TNX is NOT backing down, so far
Doesn't make sense for it to stay where it was
3.46 is way low for 75bps, UNLESS...
The monthly is worrisome
Granted we have couple weeks left but chances of it selling off are minimal
We're looking @ a trend break
Let's c what #FEDs do

This is where the recession level is. #Gold #GC #TLT #TNGold once again in history will probably tell us if we are going in full recession mode (ala 2008) or not. 1670-1680 been defended fiercely four times in the last 30 months, markets are going to see how much fear is there one more time .. heading into FED September 20th FOMC meeting.
A strong daily close under that level would be the open door to something bigger than what we have experienced in the last nine month.
Gold here as the sum of overall 10Y Yields, TLT, TN futures market directions. EUR and Yen of course all dependent on them.

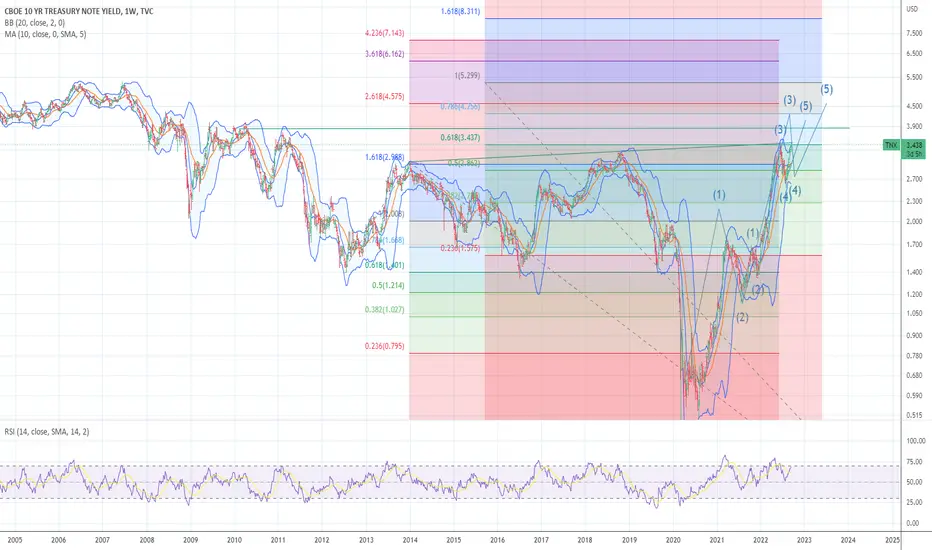
HOW HIGH WILL RATES GO WITH 8 % INFLATION NEXT STOP 3.99/4.25 The chart posted is now updated to reflect ew count and fib projections . the spread between the two to reach 2 % inflation is now in the area of a 5.25 target in the 10 % . this would most likely be seen in march 2023 the final low in the sp 500. . we still have not seen the panic in my work this is due oct 4th to the 20 th So the fractal is very much intact
SPY SPX ES / Traders Flip the ScriptHigher lows are required to provide the Flip into Higher Markets off of the Lows
at the 390.85 Level.
394 is backtesting Support
399.50 is the initial Resistance.
Powell Speaks at 9:10 AM EST after - 8:30 AM EST to provide both Initial and
Continuing Jobless Claims.
Chicago Fed President Charles Evans speaks @ Noon, followed by Consumer
Credit @ 3 PM EST.
"We're committed to maintaining our Policy"
Note - the Markets prefer stable to lower Rates, of late... this has not been
present. Should Powell provide Happy Color and TNX begins to move lower.
Powell's soothing IF there is to be such 399.50 squeeze comes into the Trade.
The Counter-Trend can morph into a further Squeeze and Meltup.
_______________________________________________________________________
Fed Vice Chair Lael Brainard spoke yesterday providing some Flip Syde to the
Tape - covering all the bases with a positive Traders uptake.
Large Traders took advantage off the recent lows and began bidding SPX for
the squeeze while Retail began to follow their thesis of Lower Lows and a retest
of the Lows - AAII reached nearly 51%.
________________________________________________________________________
X Sectors in the S&P staged a large relief rally with the exception being XLE for
obvious reasons as Crude and Oil Majors were hammered lower. Crude ended the
day down 5%+ while the DX was lower on EU Rate Decision front runs.
We are one week away from VIX Roll beginning and it appears there is an early
retreat for Time to M2/V2 aka October.
The VIX Floor remains 20.50 / 28 the pivot for Higher.
VVIX in decline creates a gush of the potential onrush of VX Bids - 93.58 is the Pivot.
Bills, Notes, and Bonds saw a slight retreat, even TLT saw the 20 Year Yield provide
reprieve - coming off the 3.75s for 20 Year Yields (Implied).
DX can pull back to 108.50.
________________________________________________________________________
Market Internals during this shortened week, Wednesday was simply more Positive
then Tuesday was Negative.
NYSE TICKs were sporadic and inconsistent Tuesday and Wednesday firmed the Tick.
Buying activity was not purely Sellers on Coverbuys, there was newer organic buying.
A positive for the Buyers (Bulls) which may digest ahead of Friday's Expiry or simply
explode higher on the cross of 399.50, Bulls do not want to lose 394.00 - and the
Trendline will need to provide extreme support.
Apple's big event... a sleeper IMHO. New Camera - Wide Angle. Price Points that will
reduce their continuing Cult of Buyers. Marginal users are simply moving to Android and
away from the Apple Ecosystem. They are discovering a better Value proposition for
their needs - Apple's Global Market Share continues to decline markedly.
Apple needs to see 160.25 - 156.50 as the Breakup Level.
Calls remain in Balance for Friday @ 51.7%
________________________________________________________________________
Let's see how Powell presents this morning, he will drive the week end finish.
Good Luck and Trade Safe.

SPY / SPX / ES - Shortened Week AheadAugust did not end well for Buyers. Rate Creep across the curve applied pronounced pressure.
RISK OFF is in trade across all Sectors within the X Complex.
TNX from a Rate perspective - Rate instability and lower rates?
At present, No. Bond VX is kicking up. It is however not damaging Banks as of yet, Financials are hanging
on... slightly.
Will the VIX Spike to 38 to 41? The ES would need to collapse to and through 3600, SPY clearly to new lows.
VVIX is seeing the out-of-control setup - Few Puts in SPY, Few participants in VIX Calls due to IV.
Prices sit at the most Pivotal area. Volimes are the main takeaway. Cumulative NYSE TICK took us
sideways into the Close. Is the selling slowing down... that will depend on whether we see compression
this week within a trading range.
Friday was a Trending Day. Can Buyers Create Balance here? It will require a SOH on the SELL SIDE.
Market Internals need to HOLD. Look below and fail is open as well.
11 of the past 19 September's ended up with 8 ending Down. The past 20 years have been highly volatile
and I find it a generational approach more relevant than the overall historical as HFT/ALGO Trading has
become dominant with increased Volatility - It's my approach this September.
Alladin will be extremely busy this Month - chalking up further gains for Blackrock. The Quarterly close
will provide important answers to a Trend in decline at present. It is somewhat overstretched on OSCs,
but Summation Indexes have more work to do. This can provide ever-increasing Volatility as we see the
VIX Curve pricing in expanding VX for several months.
VIX - % Contango
SEP M1 @ 3.90%
OCT M2 @ 1.80%
NOV M3 @ 0.37%
DEC M4 @ 3.30%
JAN M5 @ 0.25%
FEB M6 @ 0.82%
MAR @ Par with FEB
_________________________________________________________________________________________
Year to Date - August opened the Dunk Tank once Powell delivered his May FSR Objective affirmation
for Asset Prices and Interest Rate Forward Guidance.
Winners:
Energy + 30.10 %
Utilities + 5.64 %
Losers:
Consumer Non-Cyclical -6.55 %
Financial -10.81 %
Transportation -15.08 %
Basic Materials -15.26 %
Technology -31.79 %
Healthcare -26.92 %
Consumer Discretionary -26.06 %
Services -21.44 %
Capital Goods -20.45 %
Retail -18.52 %
A very brutal 2022 into the month of September - where Monthly, Weekly, and Daily timeframes are
within poor Structure.
August SPY Monthly provided a very nasty inverted Hammer. Sellers stepped up in spades at the Highs
and Sold to the opening Print, and through the Opening Print - to close on lows.
September's opening print did not hold the lower Body Bar on Friday - a poor close to the week with
options settlement into the Cash Session.
Buyers were non-responsive at best. Sellers sold through on increasing volume for the 3rd consecutive
day.
September's big events are ahead - the 13th CPI. Powell will provide color commentary on the 21st.
_________________________________________________________________________________________
Last Month's Price action served to expand the range for Major Indices.
Monthly timeframes continue to hold Lower Highs, not a good look from the June Lows at present.
The 379.92 Level is the .382 and Pivotal for the Month of September, it is presently the initial implied
Lower Range for the SPY on the confirmed break and closing below the Trend Line Support.
SPY 50% resides at 349.12 - the opening to a larger and lower low - into the Gap Fill @ 338.50.
Obviously larger targets below on increased panic and further Selling.
Price is currently sitting on top of what was prior support.
_________________________________________________________________________________________
I have cautioned for some time, Rates were a distraction too far larger issues within the Global Economy.
Repeatedly.
There are 3 legs to this stool.
Forward EPS, which remains incredibly high based upon earnings projections and their required adjustment
too far lower expectations. These have been partially priced in after Powell dropped the Hammer. There is
more work to do there.
QT remains a recycling operation - in through the out door with the appearance of an aggressive FED - while
advancing CBDC via FED NOW/FED DIRECT at an increasing pace for Rollout. This and 41067 won't bode well
for Crypto IMHO. Simply adding to the avalanche of impending exits which can be triggered by any panic in
trade.
_________________________________________________________________________________________
After large declines for all Major Indices... we've never seen a real Flush down panic, not one.
This is a once in 100 years Bear Market and it will be difficult to navigate as the Algorithms are growing
increasingly predatory.
Be careful out there, reduce Size and be on guard for increasing VX in September.
Bearish Sentiments @ AAII are rising to 50.6% again. Stop runs on trailers and catching traders offsides
should be anticipated.
We will see if the breakdown hammers this lower or price can manage to consolidate in a larger range
this week - expanding to the downside but providing outsized squeezes based on the Gamma / Delta.
_________________________________________________________________________________________
A Break of 388.96 has the potential and higher probability of creating a massive flush down and panic move to the downside.
Price is currently sitting on top of DOM Support or what many refer to as a Volume Node, I'm old, Depth of Market (DOM) is my preferred nomenclature.
3 Weeks of selling favors the Sellers - expected moves will produce lower Highs in Trend. Daily DT is another large Lower Low.
The Daily TF is the confluence with the Trendline @ 390.85 - BREAKING THIS will get nasty.
Buyers will absolutely need to defend early this Week, 399.50 may limit the upside in the Range.
379 to 399.50 is the Larger Range this week.
408.25 breaks a Potential Bear Flag.
Sector Support appears to be a Risk OFF in ALL Sectors.
HYG will provide leading indications as will XLF - breakdowns here would be very NEGATIVE.
Can Buyers consolidate here... we will see.
Take care and be cautious - trade Safe, Lower highs in the XLK will provide entry into the Trend.

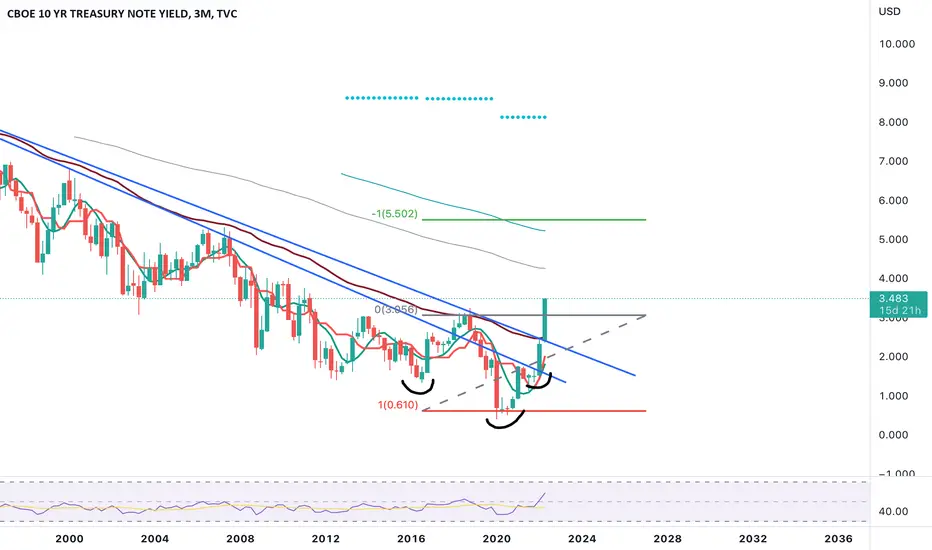
𝟭𝟬-𝘆𝗲𝗮𝗿 𝗨𝗽𝗱𝗮𝘁𝗲: $TNX Monthly. Breakout40+ year trend-line resistance broken, backtested and now the 10-year appears to be heading for 5%
$TLT $ZN_F $ZB_F $TYX $DXY $ES_F $SPY $VIX $QQQ #Tech #Bonds #Rates #Trading 📈

DXY's delayed reaction to yieldsI had this confusing idea and I will show it to you with this confusing chart.
1. First we define the blue vertical lines. These are the drawn on the date of the peak of yield.
( Even though yields drop, dollar continues to grow. Like a delayed reaction. Unsurprisingly, yields lead DXY growth. )
2. Then we draw fib retracements, with 1 being the DXY value at the time of yields peaking. And 0 being the bottom of the DXY jump. The peak of DXY is conveniently at 1.618. (or maybe I conveniently drew the chart such that 1.618 appears every time, to further validate myself)
3. When yields return to "normal levels" (red vertical lines), DXY dives.
The location of the red vertical lines, as well as what is defined as "normal yield level" are defined by the arbitrary target of 1.618 I put.
IF yields have already peaked, and if my theory is correct, DXY will reach 120, and when yields return to where they were. Even if the price target is inaccurate, the fact that DXY continues to grow after yields peak, cannot be ignored.

10 yr yield to see NEW HIGHS target is now moved from 3.55 3.85 /4.00 in the ten year yield That still is not going to be The TOP .As we enter fall production of gasoline slows to produce heating oil causing inflation cycle to pop effecting start of more issues . I want you ALL to understand what a BEAR MARKET looks like MONEY VELOCITY peaked in SEPT 6 2021 .
Short tradeBearish running triangle about to close wave E?
Could overshoot the A-C line if last week's momentum carries over.
RSI (divergence up to the 6hr) gives confluence for correction, if only halfway to the TP margin.

2 / 10 Spread - Bills : NotesIf this does not concern traders.
An unrelenting Dump on the head of Safety.
Pristine Collateral on the Shallow end of the cesspool?
Absolutely not.
This is a very real horror show.
________________________________________________
Depression.
Generational.

The Four Quadrants of the Economic CycleUse this as tailwinds for your trading and investments to spot the capital inflows when the time comes.
I would say we are likely in the inflationary bust stage (1) coming out of the disinflationary boom stage (4) for the last decade and beyond.
I would dare say the Inflationary bust stage is next (2) as the central banks try to kill inflation by raising rates and destroying asset prices.
To fix the economic damage they would have to eventually change their monetary policy which would then bring us into an inflationary boom (3)
The cycle repeats over and over but I'm positioning for the Inflationary boom stage (3) as I believe this stage will last many years.

10 yr yield BOTTOMED today look for 3.64/3.83 new highs ahead AS the ASSET BUBBLE DEFLATES one by one .ALL of the items as stated in the dec forecast 2021 are unfolding . As I stated 2022 20% plus decline plus unemployment will reach its target as well of 6.1/ 6.3 by year end
10 Year Note Yield / 10 Year NoteIt's been 234 Years since the 10-Year Bond Note deteriorated to this extent.
The United States Treasury's formation was a Year away - 1789.
9 States had ratified the US Constitution.
In order to pay for expenditures during the Revolution, Congress had only
two options: print more money or obtain loans to fund the budget deficit.
Congress became far more dependent on the printing of money, which led
to hyperinflation.
Congress lacked the authority to levy taxes - doing so would have risked
alienating an American public that had gone to war with the British over
the issue of taxation without representation for the Crown.
________________________________________________________________
The first 6 Months of 2022 have been a disaster for Bonds.
Unfortunately, it is simply just beginning.
At present, the "Disinflation Wave" is in the trade as the Media / Wall Street
ups the narrative and continues to bang the Commodity Rollover as evidence.
Typically (although we do not use History as a Guide as this is the largest
Bear Market in History, it is unprecedented as we have noted for months)
we see an 8 to 13 Month mismatch cycle for "Dis-Inflation".
Although Demand Destruction is being accelerated in Capital Stock losses,
people eat, drink, drive... consume material things required for their very
existence.
_________________________________________________________________
The most recent 4-week, 8-week, 13-week, 2year, 5-year, and 7-year auctions
were a significant failure at a time when the FED reportedly reduced their
balance sheet by $21B after a retracement for several weeks off the May 25th
outsized and front-run dump of $51B.
Meanwhile, Reverse Repurchase pools continue to swell to new all-time highs,
most recently $2.34T - earning 1.55% and safely out of perceived harm's way.
Depression concerns are clearly intensifying.
2 Year Bond Futures continue to Invert intra-day.
M1 / M2 / M3 continue to flee to the Big Lots Pool.
_________________________________________________________________
Negative GDP reinforces the Demand Destruction - Consumers will out how
Inflation peaks... Central Banks claim to want Positive Real Rates.
Consumers are rolling over, demand destruction is seeing far broader participation
as Savings / Investment / Incomes decline at the highest ROC's in decades.
This would require an outside Fed Fund Futures move, one that appears
improbable for the near term.
I'd like Ashley Trevort Twins - Seems improbable as well.
The difference is, that the odds favor my wish. The Bond Market will retrace in
select points on the Yield Curve, but ultimately the Negative real rate to
Inflation will find its Afterburner.
_________________________________________________________________
Entities are not going to step up, this is clear.
The ticking insolvency bomb fuse was lit in early 2021...
How long is that fuse?
Not long.
Equities remain the Capital stock to destroy, Housing / Alt Coins / Metals ... etal
are not long for this environment.
In order for Global Central Banks to meet their stated objectives... they'll need to
become far more aggressive.
Will they...

How long could deflation last? What about bonds?As most commodities are currently collapsing, it is very hard to keep believe that inflation is going to go higher from here. June could be the first month with a negative MoM CPI print, but it probably won't be the last. As deflation is taking inflation's seat, bonds have been looking attractive for some time. Essentially we got a blow of top in yields (capitulation bottom in bonds), and now bonds are rallying. It's totally normal as bonds took out the lows, and are now showing major strength at a time where the dollar is strong, while commodities, stocks and real estate looking weak.
The truth is that there is no escape from a major global recession. Commodities could fall a lot more until Central banks reverse course. There is too much debt and the only way to get out is by printing, while all the rate hikes will only eventually result in a crash. It's just that rate hikes have a delayed effect and most investors haven't realized what is coming yet.
Is the inflation story over? I don't think so. We are just in a very a nasty recession, that could lead to a deflationary collapse. Essentially a liquidity crunch that would cause investors to capitulate, and then force the Fed to step in to save the system. There is no way the Fed will hike rates more than 0.5-1% from here, and there is no way the Fed won't be forced to cut rates and resume QE by June 2023. The bond market reversing like this is an indication that the Fed is about to make a mistake by raising rates once or twice in the next few months, as bond yields are already coming down.
It's interesting that bond yields rose more than in 2018 before they reversed and fell below the Fed Funds Rate (FFR), yet FFR is currently 0.75% lower than when the Fed paused in 2018. Could easily see FFR getting down to 0 in the next 12-24 months as the financial system faces collapse yet again, but I don't see bond yields going as low as they did during Covid.
What I see is long duration bonds going up to the key breakdown zone, around 130-135 on TLT or bond yields going up to 2.4-2.6% before moving higher again. Essentially I do see a major deflationary episode ahead, I do believe bonds can go up, I don't believe the Fed will ahead of the problem and that there isn't much they can do. However at the same time I don't believe that the inflation story is over, as I do see higher inflation coming once we are done with this episode. Why? Because a lot of production of stuff will go offline, while governments print a ton of money to save the system. Less goods, more money... No way inflation won't happen again. The debt bubble is popping and long term this is inflationary.
So far we've seen bonds divergence from their long term trends, first with a blow off top, and then with a rapid decline that swept the lows. Could we get back into the main trend? It's possible, but I don't think so. All I see is a similar retest to what we go in 2021, where bonds broke down and then retested the breakdown level before going lower. TLT will fill the gap and then decide where it wants to go. Definitely wouldn't be surprised if bonds chopped in a certain area for a while, but ultimately I think we are going lower. Of course we could go lower even during a deflationary period, as everyone is liquidating whatever they can. If people need dollars, they will sell anything for them, including dollars. At the moment bonds are still very attractive, yet this doesn't mean that if people need cash they will hesitate to sell them.

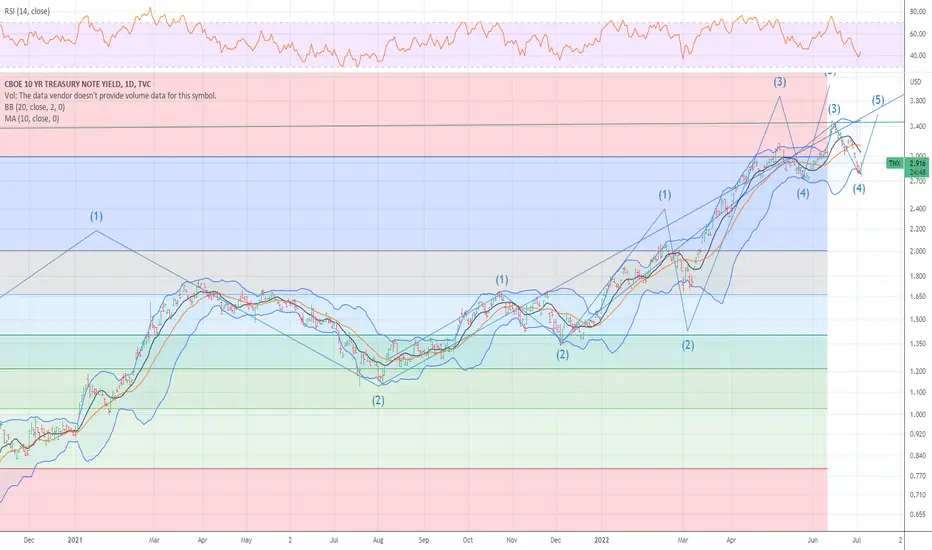
TNX-The chart you should be following very, very closely!!!I posted about TNX at the end of March and warned that we were in unchartered territory. At that time, TNX had bullishly crossed the monthly cloud which was something it had not done during my lifetime nor probably most traders lifetimes.
We are just about to quarter's end (June 30th) and you can see a clear breakout on an Inverse H&S is occurring. I see nothing but tailwinds for this chart within the next 2 weeks so I don't see how we don't close the quarter above 3.056. The measured move implies a target on TNX of 5.502 with the ability to "wick" above to 6%. Debt is becoming more & more expensive by the quarter and it's all happening very, very quickly.
In addition, have a look at the quarterly charts of Wheat, Rice, Soy, Corn & Oil...all of them look to be either breaking out on the quarter or they are just bullish AF.
Inflation, as it relates to what is most essential in life, has not peaked...
VIX trendVIX consolidating and making higher highs. Looks like a spike is brewing, as it just has been a slow grind up. Watching for a break and hold above 35, which would bring pain in equity markets.

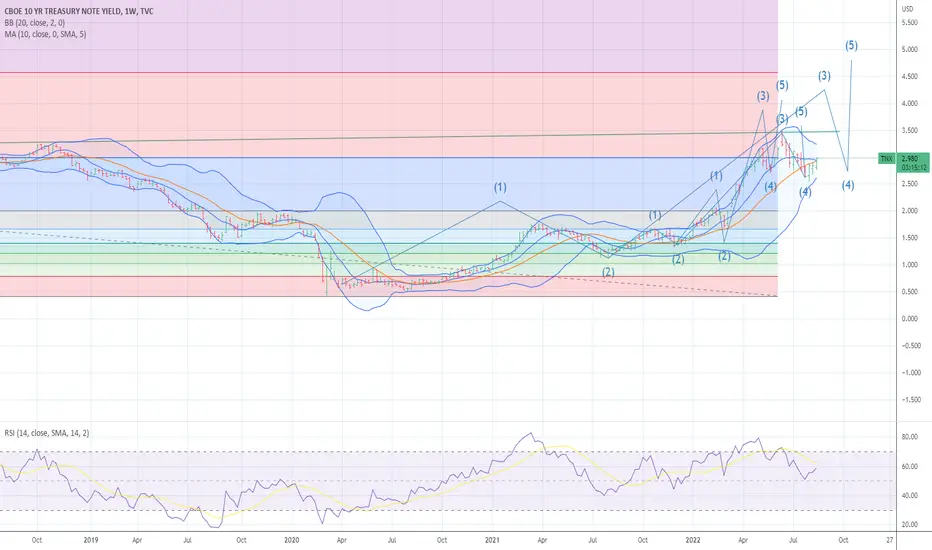
US10Y making H&S topping pattern with long weekly hammer?US10Y TNX may be topping out. It is both a measure of economic activity & inflation expectation. So is the economy starting to slow down or is inflation slowing down shortterm? It will take years for inflation to come down. If the FED can pull inflation down to at least 4% in a soft landing, it will already be a big success. Stagflation (rising inflation in a slowing economy) is still a big risk, which may take years to recover. A hard landing & aggressive rate hikes may be devastating for stocks but the economy may recover faster. More pain more gain.
A topping TNX will be good for TLT bonds & growth stocks. Next supports are 3% & the H&S neck at 2.7%. A measured move for H&S may take TNX to the yellow 2% upper pivot zone, retesting the blue wedge or maybe to retest the big red downchannel from 1981.
Not trading advice

10 yr yield to TARGET 3.56/3.62 PEAK THE CHART POSTED is that of the 10 yr yield today we hit the Trend line and this could be it or have one last pop into the 50% target . before coming back into 2.80/2.90

#TNX #US10Y 10 year yield at a top?So the 10 year yield has run hard on interest rate hike expectations.
However, as can be seen from the chart, the yield is currently about 93% above its 50 month moving average, the highest it has ever been...by far.
Using the TD indicator one can also see that the yields are potentially topping this month.
As can be seen from the Stochastic and RSI below, both are at major tops.
The yields and DXY priced in a more hawkish FED the last couple of days since we got the higher than expected CPI reading on 10 June.
Chances are that the FED will not be able to continue with higher interest rate hikes as this will crash the market.
So, the yields and DXY might have been running based on expectations but might revert quite a bit on actual release of FED interest rate decisions tomorrow.
