Gold: final pullback or bull trap?On the 1H chart, gold (GOLD) is forming a bullish flag after a sharp decline, which may just be a corrective move within a broader downtrend. The price is now approaching the key resistance zone around $3313–$3317 - this area holds the POC, broken trendline, and the 0.705–0.79 Fibonacci retracement from the last drop. This is the decision-making zone.
If bulls fail to push above it, we expect a move down toward $3268 - the next strong support and potential buy zone, also confirmed by Fibonacci and local demand. Stochastic divergence and slowing volume suggest a possible rebound from that level. However, if the price breaks and holds above $3317, this would indicate a local trend reversal, with targets at $3333 and $3374.
Watch the $3317 zone closely - bulls have yet to prove this is more than just a bounce.
Today

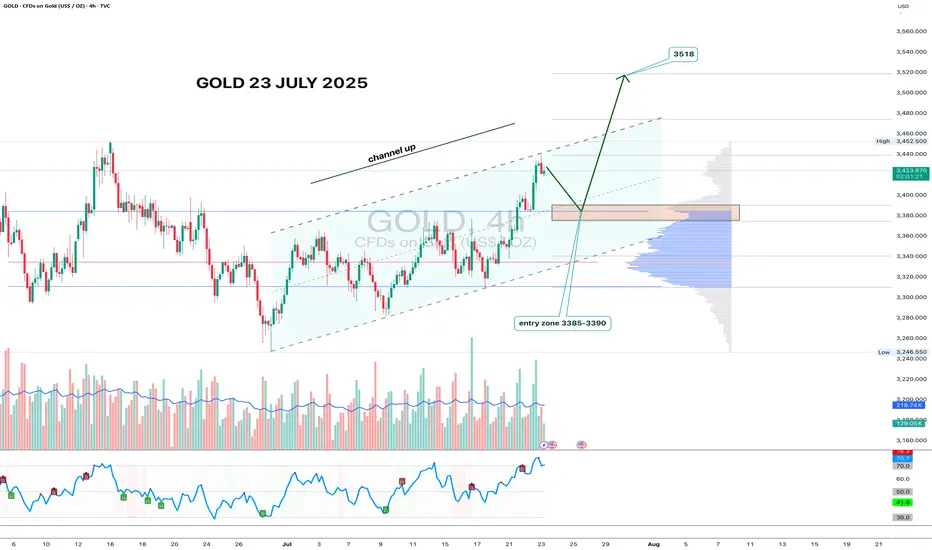
Gold 4H - channel breakout, looking for 3518 nextGold has formed a clean ascending channel on the 4H chart, broke out above resistance, and is now pulling back into the 3385–3390 zone. This area aligns with volume clusters - a perfect entry zone for bulls waiting on the sidelines.
If price holds this zone and prints a reversal candle with volume, the upside target remains at 3518 - the 1.618 Fibonacci extension and historical resistance. Volume increased during the breakout move, confirming interest. RSI still has room to go higher, supporting the bullish continuation.
Fundamentally, gold remains a safe-haven asset amid geopolitical tension, USD weakness, and potential Fed easing. Central bank accumulation further supports the bullish case.
Tactical setup:
— Entry zone: 3385–3390
— Trigger: candle confirmation + volume
— Target: 3518
— Invalidation: break below 3360 without buyer volume
If the plan plays out — gold might shine bright while bears squint in disbelief.
Gold 22 July 2025 updateGood afternoon, update to last week's post of 21 July on gold, which worked yesterday, new zone to buy, the chart shows everything in detail, so today with the message "brevity is the sister of talent"
#GOLD
BUY LIMIT ZONE 3365-3370
🎯 TP1: 3385
🎯 TP2: 3400
🎯 TP3: 3412
🎯 TP3: 3428
⛔️ Stop loss: 3355
Regards, Totoshka™

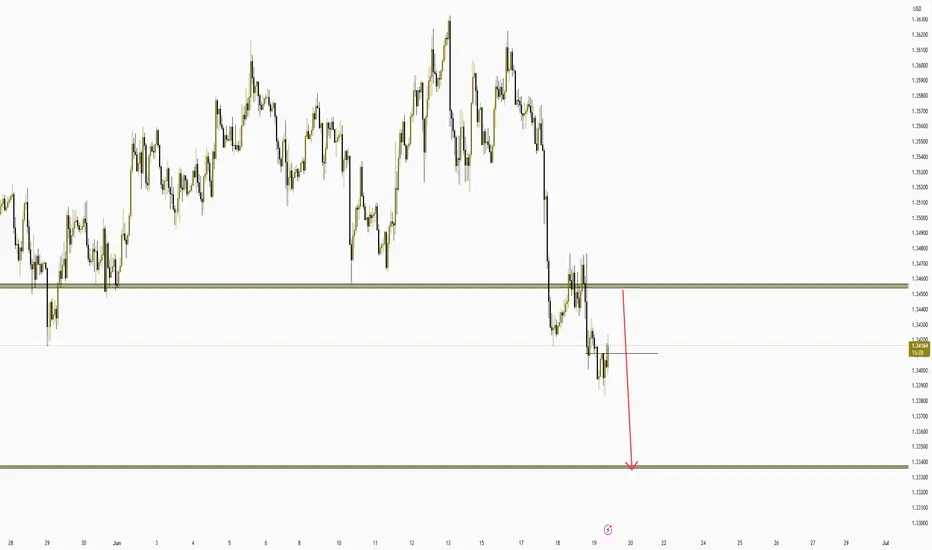
GBPUSD SHORTThe GBP/USD pair has been showing signs of exhaustion after a recent rally, and I'm looking for a potential pullback to enter a short position.
While GBP/USD has shown resilience, the technical and fundamental setup suggests a potential short opportunity on a pullback. Confirmation through price action (e.g., bearish engulfing patterns, break of structure) will be crucial before entering.
BTC to $116K before midnight!Bullish Pennant on Bitcoin 6H chart taking Bitcoin to $116,000.
This is only technical analysis and without the anticipation of May 22!

GOLD (XAUUSD, 1H) Double Bottom & Continuation to Lower FibsOn the 1-hour chart, gold attempted to form a double bottom structure, which initially showed bullish potential. However, the price action quickly reversed near resistance, failing to sustain above key EMAs and trendline zones. This invalidates the reversal attempt and reaffirms the current bearish structure within the descending channel.
The price is now trading back below broken support and heading towards deeper Fibonacci retracement levels, with visible supply pressure and repeated failure to hold any bullish breakout. Volume has shifted lower on rallies, confirming weak buyer commitment.
Downside targets (Fibonacci structure):
– $3251 – 0.382 retracement
– $3221 – 0.618 retracement (primary structural support)
– $3165 – 0.786 extension zone (final support before breakdown scenario)
The descending wedge remains valid. Unless the market reclaims $3305–$3334 with strong confirmation, the corrective leg toward the lower support zones is likely to continue. A clean break below $3220 would open the door for a move toward the $3160s.
The failed double bottom setup confirms bearish continuation. Structure, volume, and trendlines all align with a move lower. Watch for reactions at $3221 and $3165 as critical levels.

15 April Nifty50 trading zone #15 April Nifty50 trading zone
#Nifty50 #Toady #TCS #NIFTYBANK #options
99% working trading plan
👉Gap up open 22910 above & 15m hold after positive trade target 23020, 23180
👉Gap up open 22910 below 15 m not break upside after nigetive trade target 22690 ,22492
👉Gap down open 22690 above 15m hold after positive trade target 22910, 23020
👉Gap down open 22690 below 15 m not break upside after nigetive trade target 22492, 22330
💫big gapdown open 22492 above hold 1st positive trade view
💫big Gapup opening 22022 below nigetive trade view
📌 Trade plan for education purpose I'm not responsible your trade
More education following me

11 April Nifty50 trading zone update 22918 above positive trade veiw
22828 below nigetive trade view
22788 strong support
22988 strong resistance

11 April Nifty50 trading zone #Nifty50
99% working trading plan
👉Gap up open 22660 above & 15m hold after positive trade target 22818, 23118
👉Gap up open 22660 below 15 m not break upside after nigetive trade target 22492
👉Gap down open 22492 above 15m hold after positive trade target 22658, 22810 , 23118
👉Gap down open 22492 below 15 m not break upside after nigetive trade target 22372
💫big gapdown open 22372 above hold 1st positive trade view
💫big Gapup opening 22818 below nigetive trade view
📌For education purpose I'm not responsible your trade
More education following me

Nightly $SPX / $SPY Predictions for 1.23.2024🔮
📅 Thu Jan 23
🗓️ Day 4
📍 WEF Annual Meetings
⏰ 8:30am
📊 Unemployment Claims: 221K (prev: 217K)
⏰ 11:00am
🎙️ President Trump Speaks
🛢️ Crude Oil Inventories: -0.1M (prev: -2.0M)
💡 Market Insights:
📈 GAP ABOVE HPZ:
If we gap up once more, we will break all-time highs. This will be met by a big decline to juice liquidity.
📊 OPEN WITHIN EEZ:
Only resistance left, looking for a small pop up into the weekly zone to get a drop back down into the HCZ and HEL.
📉 GAP BELOW HCZ:
We will likely get a small bounce, hold, and chop down.
#trading #stock #stockmarket #today #daytrading #swingtrading #charting #investing

"A Strong Setup for Bitcoin's Surge to $110K NEXTBitcoin is trading around $96,000, with strong indicators pointing toward a potential surge to $110K. The cryptocurrency’s recent price action has captivated market watchers, as it consolidates within a narrow range below the $110,000 threshold.
Analysts view this consolidation phase, between $95,000 and $98,000, as a necessary breather following a major rally. It provides the market with time to stabilize before its next potential breakout.
**Consolidation or the calm before the storm?**
On the daily chart, Bitcoin’s reduced volatility highlights market indecision. Yet, technical indicators suggest a bullish undercurrent. The moving averages reveal a golden cross pattern, with the 50-day moving average staying well above the 200-day average—a strong signal of sustained bullish momentum.
With the stage set for a decisive move, Bitcoin’s next steps could determine its trajectory toward the $110K mark.
LINK ON BIO FOR ALL INFO

OVER BTC PLANBitcoin's trajectory seems to be holding steady, defying expectations of a significant drop. Rather than falling drastically, it appears poised to consolidate within a stable range, likely centered around the $90K mark. Although a push beyond the $100K threshold may not be imminent, its current position reflects resilience, indicating that BTC might remain within this middle ground as the market seeks its next major catalyst..

BTCUSD Outlook - Heading to 65K Before a Correction?GM crypto bro's, back to this harsh reality. The morning starts with the Fear and Greed Index sitting at 50 in the neutral zone, while the stoch RSI remains in the overbought area.
Today's BTC price action seems reluctant to correct for now, maybe preferring to hit the 65K - 66K range first, considering the Fear and Greed Index hasn't entered the greed zone yet. Usually, there's a higher probability of correction when the market is in greed.
But let’s see how the crypto market mood plays out today. Keep in mind, the market is dynamic—don’t get FOMO. Be cautious of potential corrections because anything can happen. Always manage your risk. That’s it for today’s crypto update, this is Akki signing off. One chart, one love. Have a nice day!

BTCUSD Weekend Outlook - Small Correction Before the Pump?GM crypto bro's, happy weekend! This Sunday morning, the Fear and Greed Index is still chilling in the neutral zone at 52, while the stoch RSI remains in the overbought zone.
Looking at today’s price action, there’s potential for BTC to experience a small correction, maybe down to the 61K - 60K range, before continuing its pump towards our target of 65K - 66K.
Keep in mind, the market is dynamic—don’t get FOMO. Be cautious of potential corrections because anything can happen. Always manage your risk. That’s it for today’s crypto update, this is Akki signing off. One chart, one love. Have a nice day!

BTC Reaches 60K! Is the Pump Over, or Will We See 62K Next?GM crypto bro’s, this morning's fear and greed index is in the fear zone at 45, while Stoch RSI remains in its overbought area.
BTC saw a significant pump up to 60K, likely due to strong cutrate rumors, but that doesn't mean the potential for a correction to 55K has disappeared. However, the probability of hitting 61K - 62K is increasing.
The market is dynamic, don't FOMO, stay safe, keep calm. Always remember that in the crypto market, anything can happen. Always maintain your risk, and as always, that's the crypto update for today. I’m Akki, one chart, and have a nice day.

BTCUSD: Potential Drop to 55K After Reaching 57KGM crypto bro's, this morning BTC dropped back to the 57K range as I mentioned in yesterday's market update. The Fear and Greed Index also dipped further into the fear zone, dropping to 33 from yesterday’s 39.
The stoch RSI is beginning to move out of the overbought area, and based on today’s price action, there’s another possibility of BTC continuing its decline to the 55K range.
Remember, the market is dynamic. Don’t be FOMO, stay safe, keep calm, and always remember that anything can happen in the crypto market. Always maintain your risk. And as always, that’s the crypto update for today. It’s Akki, signing off with one chart, and have a nice day.

BTCUSD: Revisiting 58K, Eyes Still on 61K - 62KGM crypto bro's, this morning the Fear and Greed Index is back in the fear zone, while the stoch RSI seems tired of being overbought and may be dropping towards the oversold area.
Looks like BTC is not in the mood to hit 61K - 62K this morning and is just hanging out around the 58K range again 🗿. Based on today’s price action, there’s a possibility of a drop back to around 57K, but the potential pump to 61K - 62K is still our target for now.
Remember, the market is dynamic. Don’t be FOMO, stay safe, keep calm, and always remember that anything can happen in the crypto market. Always maintain your risk. And as always, that’s the crypto update for today. It’s Akki, signing off with one chart, and have a nice day.

BTC Eyes 55K, Red Zone in Sight?GM crypto bro's, it seems the happy weekend is still far away 🗿 with BTC still at risk of another drop. This morning, the Fear and Greed Index is at 29 (Fear), finally moving up a bit after two days in Extreme Fear territory. The Stochastic RSI remains in the oversold area, but a slight uptick might begin tomorrow.
From a price action perspective, BTC might test the nearest level at 55K. However, if it fails to break through, there’s a high chance of a deeper drop. The closest possible red zone is 50K - 48K, and if that breaks too, next station: BTC 44K 💀.
Always hope for the best but prepare for the worst. Let's hope BTC doesn’t dump to 44K 🗿. As always, maintain your risk. That's it for today's crypto update. This is Akki, signing off with one chart. Have a nice day!

BTC Dumps to 56K - Extreme Fear in the Market!GM crypto bro's! This morning, BTC has dumped again to 56K. The Fear and Greed Index is in the extreme fear zone at 22, and it looks like the Stochastic RSI won't be leaving the oversold area anytime soon.
That's why I always remind you to stay cautious in this highly volatile crypto market, because anything can happen. Based on the current price action, the probability of dropping below 54K seems low, as mentioned in the market update on 02/09/2024.
But remember, this is just my personal analysis and only a probability. As always, maintain your risk management, and that's all for today's crypto update. This is Akki, signing off with one chart. Have a nice day!

Bearish Start to the Month, 55K in Sight?GM crypto bro's! Happy Sunday! We’ve finally made it to a new month. 😊 This morning, the Fear and Greed Index is at 26 (fear), and the Stochastic RSI is still hovering in the oversold area, similar to yesterday.
Today's monthly candle closed bearish with a long wick down to 48K. As for BTC price action this morning, it still leans bearish, with a 60% probability of visiting the 55K area. However, an instant pump could still surprise us!
Always remember, the market is dynamic; don’t get FOMO, stay safe, stay calm. Remember, anything is possible in the crypto market right now. Anything can happen. Manage your risks, and that’s it for today's crypto update. This is Akki, signing off with one chart. Have a great day!

intradaysignal 50 % chance to winmarket do some correction that basis i publish this idea all over trend is down of gold and if you selling on high definitely its easy for you core PCE index data release at 6:00 PM indian time .

BTC Possible Long Setup ➖ Symmetrical Triangle#BTC Long Setup ➖ Symmetrical Triangle
guys you know i goes based on the Chart Information and the Chart can Change fast.
in this Case we see BTC creating the Symmetrical Triangle and it breaks out.
2 Scenarios can be happen now:
Scenario 1:
we have seen very often that at the first breakout often trades to its fake breakout. this does not always have to be the case as we can assume that BTC has a breakout and has just made a successful retest of the trendline.
Scenario 2:
If BTC breaks out from here and after this successful breakout with a retest, we will soon see a new ALL TIME HIGH.
My targets are based on the Fibonacci levels where I have also given you a Psychological Short AREA.
📈 Entry NOW: 69662
🛑 SL: 68100
🎯 Target 1: 72264.3
🎯 Target 2: 75616.3
🎯 Target 3: 81051.9
🎯 Target 4: 86623.4
Cheers
