TONUSDT Breaks Out of Bearish Grip! Is a Bullish Rally?🔎 1. Key Pattern: Descending Trendline Breakout + Reaccumulation Zone
After months of downward pressure, TONUSDT has successfully broken above a dominant descending trendline that has been acting as resistance since December 2024.
✅ This breakout occurred with a strong bullish candle and aligns perfectly with a significant historical resistance zone (around $3.00–$3.12).
📌 The area also overlaps with the Fibonacci retracement levels (0.5–0.618) — a zone where trend reversals often occur.
This indicates that the move isn't just noise — it might be the start of a mid-term bullish trend.
---
🧱 2. Consolidation Box = Reaccumulation Zone
TONUSDT spent nearly 4 months ranging sideways between $2.80 and $3.20, forming a clear reaccumulation range.
🔁 This kind of price action often precedes a strong breakout, as smart money accumulates before the next leg up.
🟨 This box now acts as a critical demand/support zone for any potential pullbacks.
---
📏 3. Key Levels to Watch (Support & Resistance)
✅ Bullish Targets (Resistance Levels):
🔹 $3.5404 → Immediate resistance
🔹 $4.0492 → Major resistance to break
🔹 $4.6460
🔹 $5.1961
🔹 $5.9429
🔹 $6.9065
🔹 Local High: $7.2311
🔻 Support Levels:
🔸 $3.1248 – $3.0099 → Key Fibonacci support (0.5–0.618)
🔸 $2.8000 → Bottom of reaccumulation range
🔸 $2.3290 → Major support (also the cycle low)
---
📈 Bullish Scenario (Primary Bias)
If price holds above the key zone at $3.00–$3.12, we could see:
A move towards $3.54 USDT
Breakout above $3.54 opens the door to $4.05 → $4.64 → $5.19 and beyond
A clear structure of higher highs and higher lows confirms trend reversal
Momentum remains strong as long as price respects the breakout zone.
---
📉 Bearish Scenario (Alternative Case to Watch)
If price fails to hold above $3.00 and breaks back below $2.80:
This would suggest a false breakout
Momentum may shift bearish again
Price could revisit the $2.32 support, negating the bullish setup
A return to sideways or even downtrend structure is possible
---
🧩 Strategic Conclusion
TONUSDT has broken out of a key descending trendline and reclaimed a strong structural zone, indicating early signs of a bullish cycle.
📊 Key Levels to Monitor Closely:
Support (validation zone): $3.00–$3.12
Immediate resistance: $3.54
Mid-term targets: $4.05 → $5.19 and higher
> As long as TON stays above the golden zone (Fibonacci 0.5–0.618), bulls have the upper hand.
---
📘 Pro Tips for Traders:
Watch for volume confirmation during retests
Be patient for pullback entries or breakout confirmations
Manage risk — don’t FOMO blindly
#TONUSDT #TONCOIN #CryptoBreakout #AltcoinAnalysis #TechnicalAnalysis #CryptoTrading #TON #Reaccumulation #BreakoutSetup #FibonacciSupport #BullishReversal #TONBullish
TON

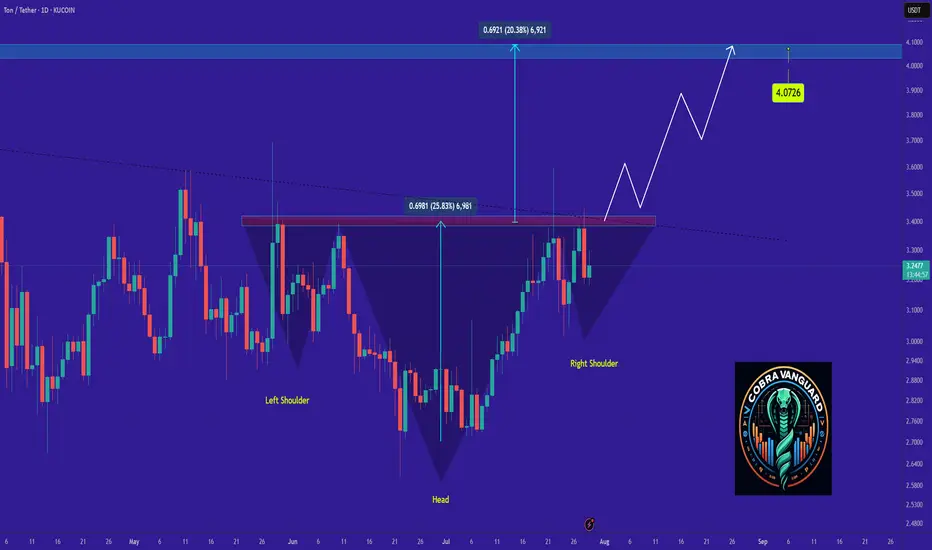
we shall see a good amount of increase in TON price !It seems the price is forming a head and shoulders pattern, which, if correct, suggests a good price increase in the coming days. However, we should wait for the pattern to fully complete.
Best regards CobraVanguard.💚
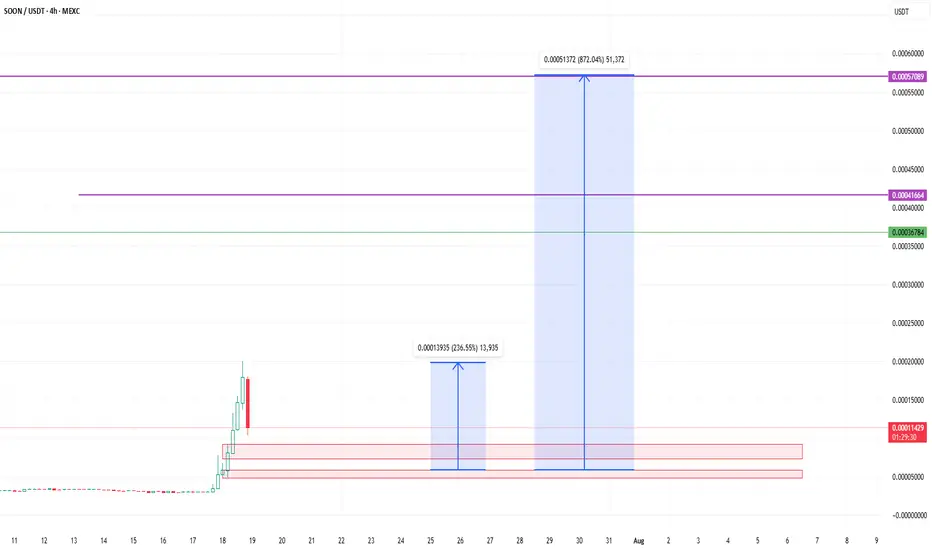
MR SOON GO TO THE MOON with huge commiunity and holder MR soon token is the Best meme for buy noow and a few wait foor a BIG pump so just buy and wait for pump and dont wory be happpy !
MR SOON GO TO THE MOON with huge commiunity and holder
now i am waiting for a very very very BIG PUMP my freind
#TON Update #5 – July 27, 2025#TON Update #5 – July 27, 2025
TON has moved below its last impulsive wave, initiating a bearish phase on the 4-hour chart. The presence of long wicks may be a sign of significant trapped positions, likely indicating that whales have already closed out their trades in this zone.
Based on the 4-hour chart, Ton’s bearish shift and the following correction point to a new target at the $2.88 level. Keep in mind this analysis applies only to the 4-hour timeframe, not the daily.
You should consider the timeframe in which you're trading. As long as TON does not break above the $3.60 level and close a candle with a new high, it will remain bearish on the 4-hour chart. Therefore, I do not recommend any trades on TON at the moment.

TON/USDT - Bullish Channel in H4 (27.07.2025)The TON/USDT pair on the H4 timeframe presents a Potential Buying Opportunity due to a recent Formation of a Bullish Channel Pattern. This suggests a shift in momentum towards the upside and a higher likelihood of further advances in the coming Days.
Possible Long Trade:
Entry: Consider Entering A Long Position around Trendline Of The Pattern.
Target Levels:
1st Resistance – 3.770
2nd Resistance – 3.989
🎁 Please hit the like button and
🎁 Leave a comment to support for My Post !
Your likes and comments are incredibly motivating and will encourage me to share more analysis with you.
Best Regards, KABHI_TA_TRADING
Thank you.

TONUSD TONUSDT TONCOIN mid- to long-termIn my view, we are still in the accumulation phase. The current price action and reactions at key levels suggest ongoing accumulation.
🔻 Bearish Scenarios:
In the short term, a retest of the lower boundary of the accumulation zone (purple box) is possible if the market weakens.
The worst-case scenario would be a move down to the lower green support zone, which has historically triggered strong bullish reactions. This is a critical demand area.
🔼 Bullish Scenarios:
A confirmed breakout and hold above the white line (within the purple box) would signal strength and a potential move higher.
We would then likely see a retest of the upper boundary of the accumulation zone.
A breakout and consolidation above the yellow line would open the door for a move toward the wider yellow channel, which could act as a final target zone
🚨 High-Risk Zone:
The yellow channel might represent the final phase of the current move.
From there, we could see either a sharp correction
Or, if trend strength and macro conditions allow, a continuation towards a new ATH (purple line).
📌 📌 📌 :
All marked lines and zones represent key support and resistance levels.
Price reaction at these areas will be crucial for decision-making.
As always, risk management and trend confirmation are essential.

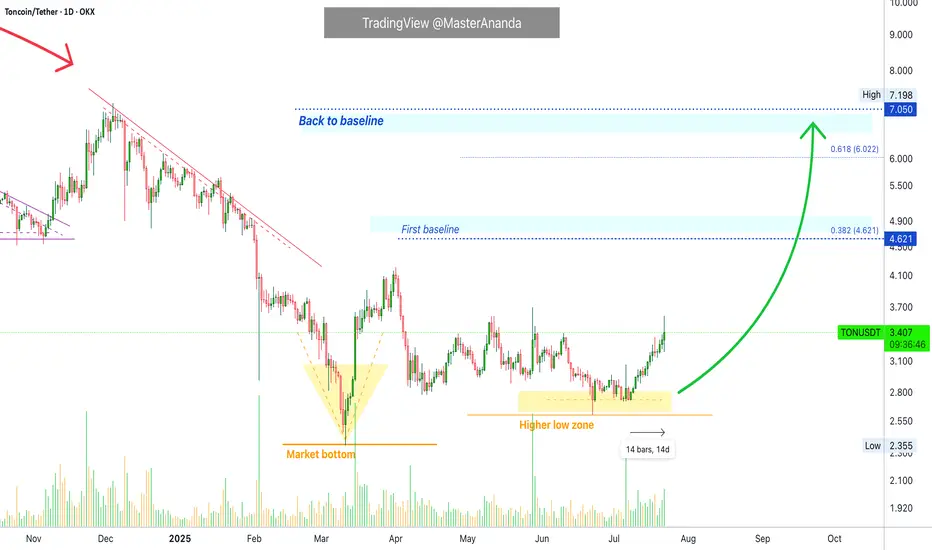
Toncoin Update · A Closer Look · Major Move in the MakingConsider this, Toncoin has been growing steadily for fourteen days straight. The growth is slow, steady and patterned, but it keeps on happening. Notice no strong sudden jump but still, straight up. This is how the bottom is missed.
At times, we buy and we are waiting for a sudden jump but this almost never happens. The way it works, in a bull market, we get a long drawn out build-up of bullish momentum. After weeks, or sometimes even months, of prices slowly rising, then we get the sudden jump. This is to say that we are getting close.
Toncoin will continue in this pattern for days, can be weeks or even months; but at one point, there will be a major advance producing such amazing growth. Consider Bitcoin Cash on the daily timeframe for an example.
There is one more thing we need to do but I will leave this for a different publication. We need to consider the true all-time high potential.
As you might be aware, we've been looking together at "conservative" and "easy" targets for the next high and bullish wave, we are leaving this approach behind. Now it is wise for us to consider 'true' potential, 'optimistic' and 'real' targets, the highest possible, etc. So we are going to be looking at how far up Toncoin can go in the coming years and months.
Your support is highly appreciated.
The action now indicates that a major move is in the cards for this pair. If you want to catch one of those waves where you see +100% or +200% within weeks, you can sit on your TON tokens, this will be it.
It is going to happen but keep in mind that patience is key.
After you buy you hold, wait long and the market takes care of the rest. The wait is worth it when you consider the amazing profits and results that can be achieved. You deserve the best.
Keep going; keep in insisting; keep trying, keep learning, keep pushing, keep growing. We are going to achieve our goals. If you stay around long enough, the market will give you exactly what you want.
Money? peace of mind? More time to do the things you like?
Not having to leave your home to work? It is possible with Crypto.
Thanks a lot for your support.
Namaste.
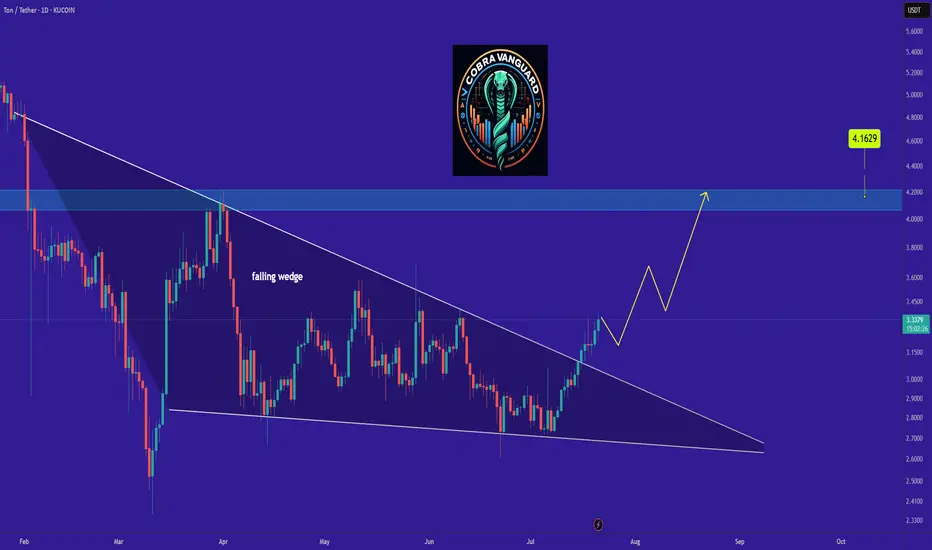
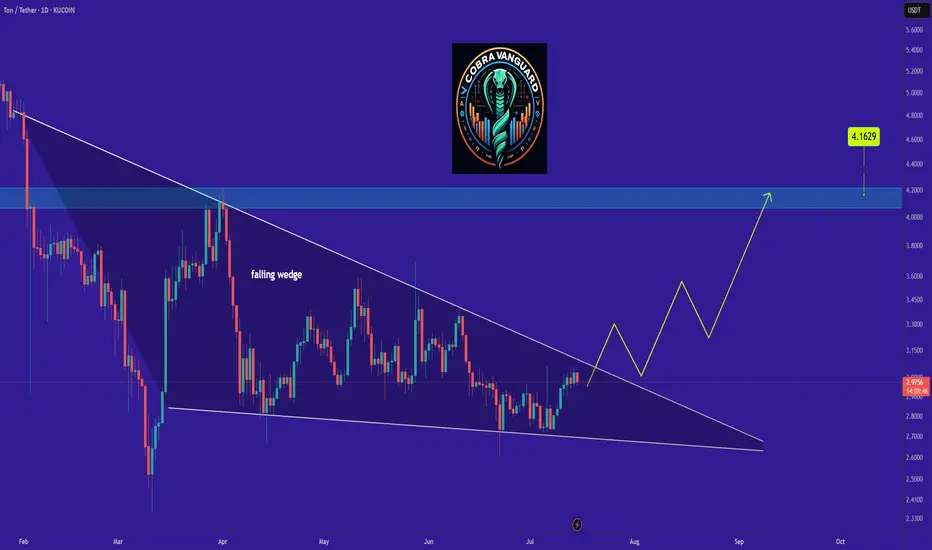
TON - Time to buy again! (Update)The price has broken the wedge pattern, which means it can easily reach its previous high or even go higher.
Best regards CobraVanguard.💚
PREVIOUS ANALYSIS
#TON Update #4 – July 18, 2025#TON Update #4 – July 18, 2025
Toncoin (TON) has completed its correction following the last impulsive move and is now pushing upward again. Technically, the next major target sits around the $3.35 level.
However, before reaching that level, TON faces a resistance at $3.27 — a level that has been tested multiple times in the past and may cause a temporary pullback.
On the TON/BTC pair, the price still hasn’t broken above the 200 MA band, which remains a limiting factor for bullish momentum.
For short-term traders:
Entry: $3.17
Target: $3.27
Potential Gain: 3%
This setup may offer a quick profit opportunity, but caution is advised.

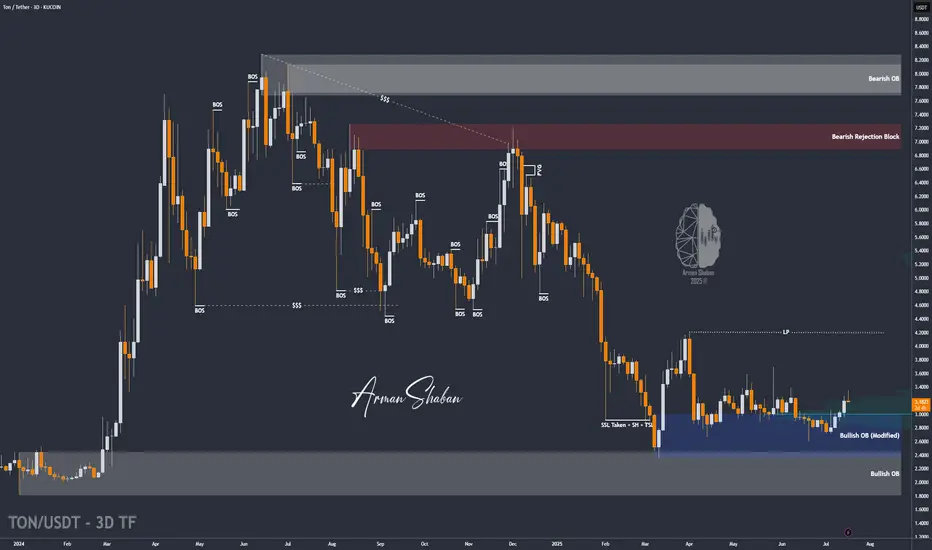
TON/USDT | Another Bullish Move Ahead? (READ THE CAPTION)By analyzing the Toncoin chart on the 3-day timeframe, we can see that, as per yesterday’s analysis, the price climbed to $3.36 before facing a slight correction — which is perfectly normal since every strong bullish trend needs a healthy pullback. The $3.05–$3.20 zone could serve as a good accumulation area for buyers, and we may soon witness another impressive rally from Toncoin! Based on the previous analysis, the next targets are $3.63, $4.20, and $4.68.
Please support me with your likes and comments to motivate me to share more analysis with you and share your opinion about the possible trend of this chart with me !
Best Regards , Arman Shaban
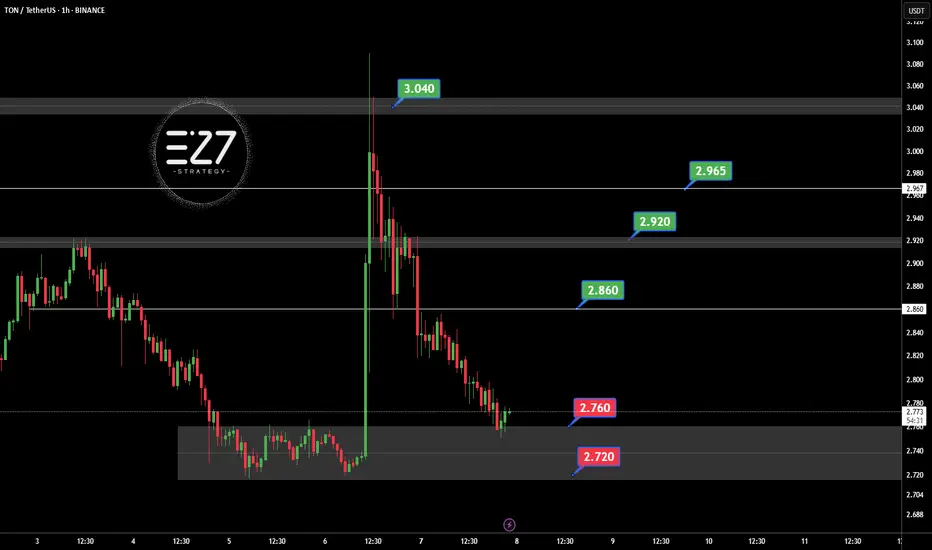
TONUSDT Following the official denial by UAE authorities regarding the possibility of obtaining a golden visa through staking OKX:TONUSDT , the bullish momentum driven by that rumor has faded. Selling pressure has increased, and TON is now consolidating within the key support zone of 2.720 to 2.760 USDT. If this support breaks, further downside is likely. However, if the price holds and reclaims the 2.860 USDT resistance, it could trigger a recovery toward 2.920 and 2.965 USDT. For now, the market sentiment remains bearish with a corrective bias.
Key Points:
UAE officially denied TON-based golden visa claims, weakening sentiment.
Current support zone: 2.720–2.760 USDT.
Key resistance: 2.860 USDT, then 2.920 USDT.
Break below 2.720 = further decline.
Break above 2.860 = potential bullish reversal.
⚠️ Please Control Risk Management in trades.
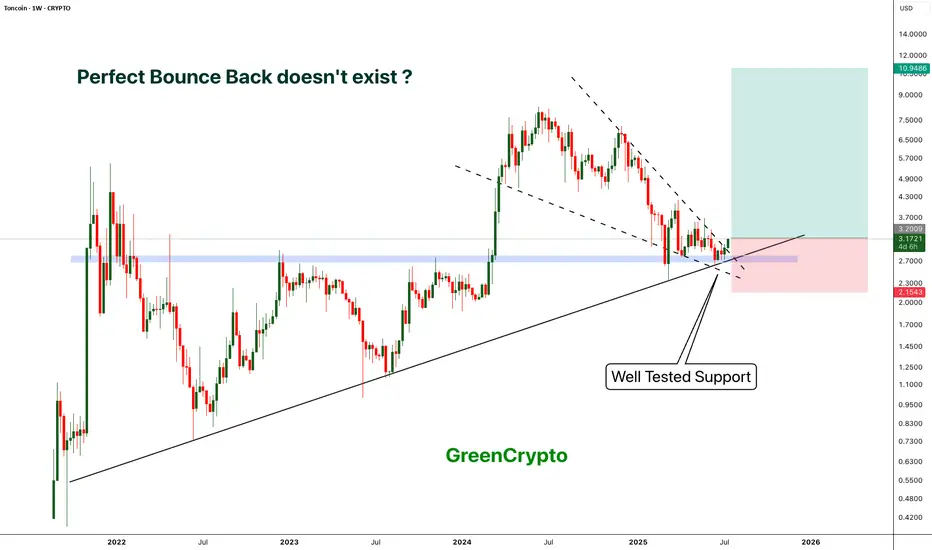
TON - Locked and Loaded for a perfect Reversal- TON is reversing perfectly from its long tested support
- On weekly chart we have clear bounce back and perfect candle.
- This is an excellent opportunity to enter
Entry Price: 3.17
Stop Loss: 2.15
TP1: 4.0796
TP2: 5.2629
TP3: 6.8383
TP4: 8.3298
TP5: 11.0191
Stay tuned for more updates.
Cheers
GreenCrypto
DeGRAM | TONUSD held the demand zone📊 Technical Analysis
● Price has just printed a third higher-low inside the green $2.60-2.75 demand zone and on the long-term purple trend line, forming a tight falling-wedge that is squeezing against $2.90 resistance.
● A 16 h close above $2.90 completes the wedge and opens the grey mid-channel target at $3.25; the pattern’s 1 : 1 swing and descending magenta resistance intersect at $3.77, offering follow-through scope.
💡 Fundamental Analysis
● Telegram’s plan to roll out the Ton-powered wallet to its global user base, alongside a new $115 M TON ecosystem fund, is expected to boost real-world demand and developer activity.
✨ Summary
Long $2.70-2.90; breakout > $2.90 aims for $3.25 → $3.77. Invalidate on a 16 h close below $2.58.
-------------------
Share your opinion in the comments and support the idea with a like. Thanks for your support!

Toncoin Update v2.0 · How To Trade For Maximum ProfitsI am keeping the same chart drawings for simplicity. We continue to move forward on Toncoin and this is one of the trio we track and trade: Notcoin, Toncoin & Dogs.
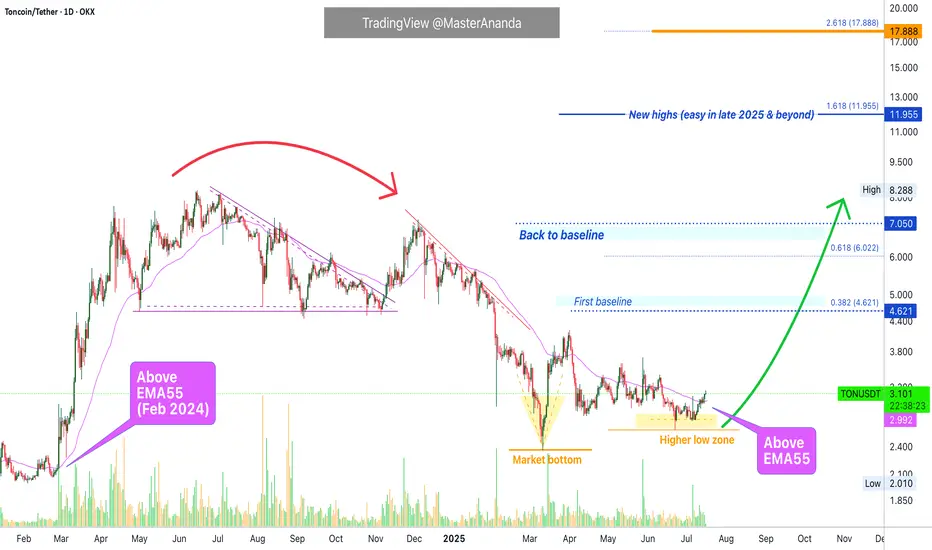
Daily TONUSDT is now trading above EMA55. When this happened back in February 2024 Toncoin produced its biggest advance ever. The same is likely to repeat multiplied by ten.
(I just updated the targets for your convenience. $12 & $18 have been added to the chart.)
» July 2024 TONUSDT moves daily above EMA55.
» EMA89 is now sitting at $3.10. This resistance level is also about to be conquered. This simply means that the bullish bias is fully confirmed.
» MA200 is still a bit further away but once TONUSDT moves above this level, currently at $3.59, we can expect long-term growth. That is, six months or more. Can be 8, 9, 12, 14, 16, etc. Just beyond six.
"Toncoin will move straight up," this is just a way of saying things. There will always be some days red, some days green, some red some green but the trend, tendency and bias is bullish.
When you see prices rising and you start to enjoying higher profits do not be scared by sudden drops. These are shakeouts and only meant to scare you. Hold strong.
Toncoin can turn red 2 days, 3 days, even 6 days or 9 days and still remain 100% bullish and as soon as the retrace ends you will get additional growth.
It is all fine and great in the Crypto market.
Thanks a lot for your continued support.
Namaste.
Today's signal is TONHello friends
Given the price growth after reaching resistance, it has entered a correction, which provides a good opportunity to buy in stages and with capital management and move to the specified targets.
*Trade safely with us*

TON It will grow soon...So if you pay attention to the TON chart you can see that the price has formed a Ascending wedge which means it is expected to price move as equal as the measured price movement.( AB=CD )
NOTE: wait for break of the WEDGE .
Best regards CobraVanguard.💚
TradeCityPro | TON Eyes Breakout After Support Zone Rebound👋 Welcome to TradeCity Pro!
In this analysis, I want to review the TON coin for you — one of the popular coins owned by Telegram, currently ranked 20 on CoinMarketCap with a market cap of 7.51 billion dollars.
📅 Daily timeframe
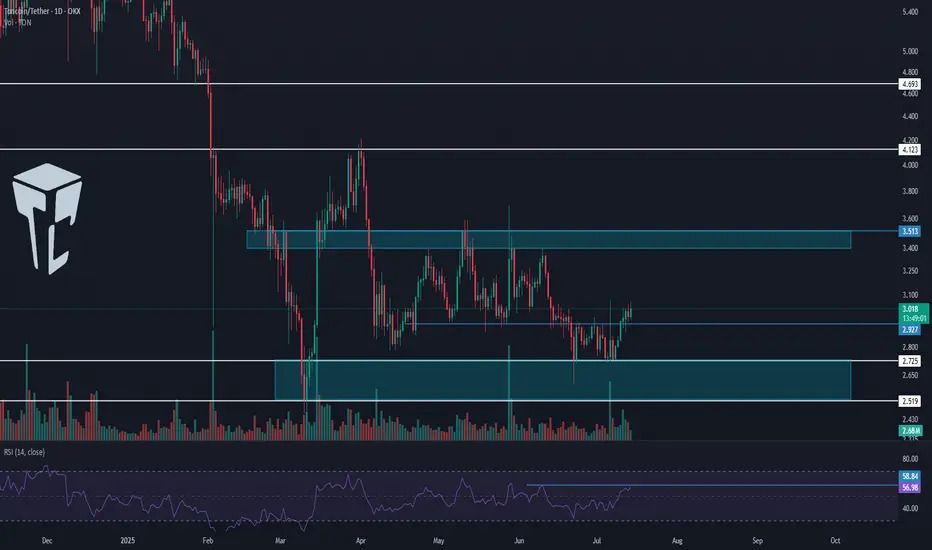
In the daily timeframe, unlike other coins that have already broken their highs and are moving upward, this coin hasn’t yet reached its top and has just been supported from the bottom of its range box.
✔️ A Maker Buyer zone has formed between the 2.725 and 2.519 levels, which is the main support zone for this coin, and the price has been supported from this area and is now moving upward.
📈 The trigger confirming this support was the 2.927 level, and after this trigger got activated and the price consolidated, it seems the main bullish leg has now started, and the price can move toward the top of the box.
✨ If you already have a long position on this coin, I recommend holding it — especially if you have other open positions — because this move has just started, and if an uptrend forms, your entry is at a great level.
⭐ The first zone where I might take partial profits is the 3.513 top, which is a Maker Seller zone and may cause a pullback.
💥 On the other hand, if you don’t have an open position yet, the first long trigger is the break of 3.513. This level is the top of the box, and breaking it confirms the beginning of a bullish trend.
🔍 The RSI trigger and the entry of bullish momentum into the market is the break of 58.84 on this oscillator. Volume so far is well aligned with price, and if this buying volume continues to rise, we can expect sharp bullish moves from this coin.
📝 Final Thoughts
This analysis reflects our opinions and is not financial advice.
Share your thoughts in the comments, and don’t forget to share this analysis with your friends! ❤️
Toncion Update: Never Again Below $3.00 · New All-Time High NextToncoin already closed five consecutive days green as it prepares for a major advance. The last time this happened was in early April and this produced a nice jump. The difference now is that in April the market was coming out of a downtrend and the low was a major low. In June the market was in a retrace and the low is a higher low. Much difference. The next advance is very close, already here, and will produce the highest prices in more than a year, since June 2024 and of course, it will go beyond for sure, a new all-time high.
This is the last time you will see Toncoin trading at low prices before the major 2025 bull market cycle and wave. There is no limit to the upside, it is possible that in just a few days from now Toncoin will move away from $3 and never trade at this price again. That is, you will never be able to buy TON for $3.00, the price will be much higher. Do you remember Litecoin when it traded at 3 cents? What about Bitcoin at $3,000? What about Ethereum at $100? Well, Toncoin is no different. It will grow so much and so strong that we will be happy that we decided to be 100% Crypto. Risk vs reward. We accept the risk and for this reason we can enjoy an amazing reward.
Namaste.

TON – Just a Trade, Probably Out at $6.30📈💼 TON – Just a Trade, Probably Out at $6.30 🎯📊
Welcome back to the Altcoin Series, this time with a closer look at Toncoin (TON) — and yes, it’s just a trade.
Later in the cycle I’ll be divorcing altcoins, but not yet. I’m still bullish. I see setups, I take them. I don’t marry charts — I extract from them.
🔍 What’s the Setup?
TON is at a retest of long-term trendline support, with multiple prior accumulation zones marked on the chart. We’ve just bounced from $2.81, right above the golden pocket area, and we have a clear map higher — but it’s a trade, not a love letter.
🔑 Key Levels
🔹 Entry zone: $2.81–$2.95 (golden pocket & trendline bounce)
🔹 Next levels to watch:
$3.74
$5.52
Likely exit zone: $6.35
🔺 Fib extension shows potential up to $8.49+, but I’m keeping it tight
🛑 Invalidation: Close below $2.81 = back to cash
🧠 The Trader’s Mindset
TON is moving with the narrative — it’s been strong, it’s caught attention, and it’s holding key levels. But I’m not here to believe in the story.
✅ It’s a structural bounce
✅ The risk is clear
✅ The target is clean
🚫 No emotion, no narrative, just levels
This isn’t marriage. It’s business.
🧩 What’s New in Tron?
Tron is picking up momentum, driven by multiple on-chain and institutional signals:
📈 Whale accumulation & on-chain strength — large holders have been accumulating, while withdrawals suggest long-term conviction
🤝 Strategic partnership with Binance Alpha — a roadmap to DeFi expansion and increased liquidity
🧩 Growing stablecoin & DeFi footprint — over $80B USDT on Tron, 6B+ transactions and $15B TVL
🏛️ Coming U.S. debut via a Nasdaq reverse merger — enhanced credibility and U.S. exposure, paused SEC probe, Trump-linked momentum
The Verge
Tron is evolving—from a memecoin playground to a player ready for institutional-level infrastructure.
One Love,
The FXPROFESSOR 💙
Disclosure: I am happy to be part of the Trade Nation's Influencer program and receive a monthly fee for using their TradingView charts in my analysis. Awesome broker, where the trader really comes first! 🌟🤝📈

#TON Update #3 – July 7, 2025🟣 #TON Update #3 – July 7, 2025
After the recent news-driven spike on TON, I mentioned that I wasn’t looking to buy into the rally. In fact, I warned that a correction was likely. One thing I always keep in mind:
Do not buy what's already pumping.
Right now, TON is going through that correction. As long as it doesn’t break below the 2.720 zone , I believe it could continue forming a mild upward structure.
As shown on the chart, I’ve marked a potential long setup near 2.755 . That’s not a signal to buy as soon as price touches it, it’s a level I’ll reassess if reached. Only if price reacts strongly there would I consider entering.
Until then, TON is not in a favorable area for either long or short entries. I’m just watching for now.

#TON Update #4 – July 8, 2025🟡 #TON Update #4 – July 8, 2025
Tonecoin has reached the area we previously marked as a potential entry zone. We’re now seeing early signs of a bounce from that level.
For this reason, I'm considering entering a trade here, with a risk-to-reward ratio of approximately 2.63.
▫️ Entry: 2.754
▫️ TP1: 2.850 (50%)
▫️ TP2: 2.910 (50%)
▫️ Stop: 2.694
❗️ I do not recommend moving the stop loss. Stick to the plan. This trade will be actively monitored and updated if necessary.

Did you hit a TON?TON yesterday moved due to a golden visa news - That said after the news came of UAE denying golden visa claim it fell, That move was not for that I guess, See the pas of it, If market stays like that, you would see it touch the springs!

Toncoin Bullish Breakout Confirmed —8X Lev. PossibleLook at the volume today, it is the highest since late May. This high volume coupled with a big bullish candle confirms two things: 1) The higher low is in and 2) the next bullish wave starts now.
There is no other way things can develop. The chart is the market. The chart reveals everything you need to know. Toncoin's chart is revealing buying pressure right now, after a higher low. Now that the higher low is confirmed this means the bullish wave we have been expecting is underway.
This is the last chance. A great opportunity. This chart setup can be approached with leverage, easily with 5X. Can be more just as it can be less. Make sure to plan ahead.
Aim high —A new all-time high
Do not sell after 100% growth, the market will grow much more. Here there is an easy target open with 222%, this level should be achieved mid-term. Long-term, expect maximum growth.
The altcoins market will be growing straight up, month after month after month.
This is just a friendly reminder. Get back in the market.
Buy and hold.
Thanks a lot for your continued support.
Namaste.
