TonCoin- Eliminate the useless, keep the essential.
- imo Toncoin looks bottomed, but remember, crypto moves fast, if BTC dips, altcoins usually follow harder.
- That said, for now, I don’t see altcoins dropping further; they sound to be not far from a rock bottom.
------------------------------------------------------------------
Simple Trade Strategy :
------------------------------------------------------------------
- Buy now around 3$
- Keep some juice to DCA more around 2.30$
------------------------------------------------------------------
TP : 5.50$
SL : 1.95$
------------------------------------------------------------------
Play Wisely !
Happy Tr4Ding !
Toncoin

Toncoin Gets Ready For $17 & $22 (Elliott Wave Theory)There is a classic ABC (Zig-zag) correction on the chart based on Elliot Wave Theory. The correction is perfect in size and proportions and comes out of a perfect 12345 bullish impulse. The end of the correction signals the start of a new bullish phase.
The dynamics here are the exact same we just looked at with AAVEUSDT. After the correction reaches its end, there is some sideways (consolidation), this sideways then produces slow and steady growth and finally a strong price advance.
In 2023, there were almost three months of sideways action after the low was in before the first advance got started. Then another period of sideways preceding the major bullish climax. This is standard price dynamics and we should experience something similar in the coming months.
Patience is key. But the market looks good now for accumulation in anticipation of a major bullish wave that will end in a bull-run. Targets can easily hit $11, $17, $22 and beyond.
Namaste.

Ready for TON?4 hour looks extremely bullish but to the extend where it follows the red line, Play for both! Pay for the nPoC and to touch the vPoC as well! Aim for the blue lines on the shorts!

Be careful with Toncoin !!!Now that the price is at the bottom of the wedge, it can raise the price to the top of the wedge.
Give me some energy !!
✨We spend hours finding potential opportunities and writing useful ideas, we would be happy if you support us.
Best regards CobraVanguard.💚
_ _ _ _ __ _ _ _ _ _ _ _ _ _ _ _ _ _ _ _ _ _ _ _ _ _ _ _ _ _ _ _
✅Thank you, and for more ideas, hit ❤️Like❤️ and 🌟Follow🌟!
⚠️Things can change...
The markets are always changing and even with all these signals, the market changes tend to be strong and fast!!

TON at a very bottomAfter the rejection from the descending triangle we had, now $3 is going to be the last/strong support and I'm expecting another push to about $19 in next few weeks or months

TON - Time to buy again!The price has formed a Triangle on the 4h time frame, and if it breaks out, it can drive the price up to around $4.3.
Give me some energy !!
✨We spend hours finding potential opportunities and writing useful ideas, we would be happy if you support us.
Best regards CobraVanguard.💚
_ _ _ _ __ _ _ _ _ _ _ _ _ _ _ _ _ _ _ _ _ _ _ _ _ _ _ _ _ _ _ _
✅Thank you, and for more ideas, hit ❤️Like❤️ and 🌟Follow🌟!
⚠️Things can change...
The markets are always changing and even with all these signals, the market changes tend to be strong and fast!!

TON is following a bearish scenario 12H TFTON has entered a bearish structure after losing the flip zone. If a pullback to the flip zone occurs, it could present a good opportunity for sell/short positions.
A daily candle closing above the invalidation level will invalidate this analysis.
Do not enter the position without capital management and stop setting
Comment if you have any questions
thank you
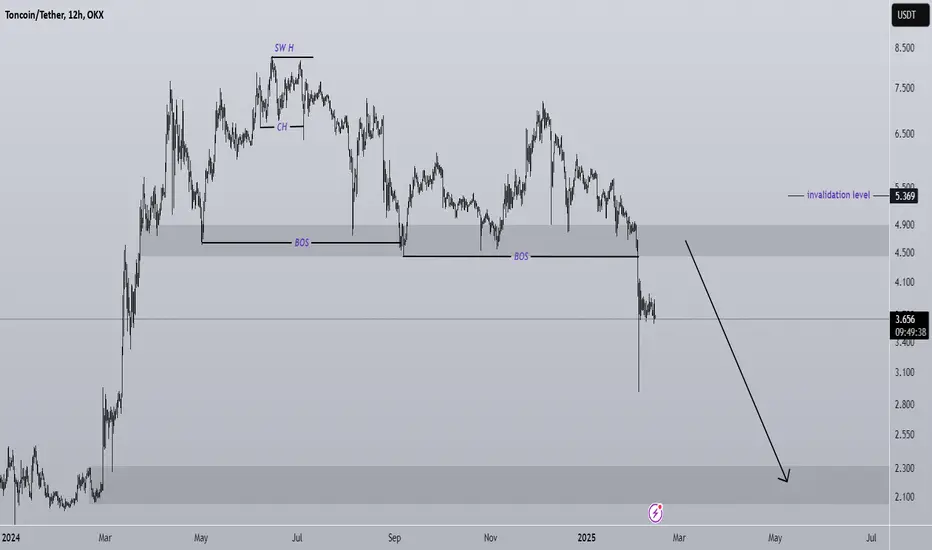
The bearish scenario for TON has been activatedThis analysis is an update of the analysis you see in the "Related publications" section
We were counting on the flip zone for the continuation of the uptrend, but this zone was strongly broken.
We are not biased toward any analysis; we simply share what the chart shows us and always strive to reduce our errors and find the correct market direction.
If a pullback toward the flip zone occurs, we can look for sell/short positions.
The best zone for buying and investing is the green area. There is a liquidity pool at the bottom of the chart, which is expected to be swept in the coming weeks.
The closure of a daily candle below the invalidation level will invalidate this analysis.
For risk management, please don't forget stop loss and capital management
Comment if you have any questions
Thank You

TON (telegram coin): a dejavuhello guys!
I published my reasons for an upward movement before:
Let's dig into the history of this coin and analyze what happened before and after forming this candle!

TON (telegram coin): is ready for an upward hello guys!
let's analyze TON!
Ton formed a head and shoulders pattern and broke the neckline!
The target of this pattern has already been achieved!
and the last candle touched the flip area too!
so there is no debt to a lower level for this coin! it is ready for an upward movement!

TONUSD Be ready for $12.00 this Summer.It has been almost 5 months (September 12, see chart below) since the last time we analyzed Toncoin (TONUSD) and made our bearish call:
As you can see, it successfully hit our 3.50 Target and the 0.618 Fibonacci level. With that being a direct contact with the bottom (Higher Lows trend-line) of the 1-year Channel Up, while the 1D RSI got oversold (<30.00), we expect the new Bullish Leg to start.
All previous oversold RSI hits (with the exception of Aug 05 2024) have been bottoms and with +300% being a standard rise within this pattern, we expect to see $12.000 as the next High.
-------------------------------------------------------------------------------
** Please LIKE 👍, FOLLOW ✅, SHARE 🙌 and COMMENT ✍ if you enjoy this idea! Also share your ideas and charts in the comments section below! This is best way to keep it relevant, support us, keep the content here free and allow the idea to reach as many people as possible. **
-------------------------------------------------------------------------------
💸💸💸💸💸💸
👇 👇 👇 👇 👇 👇

TON/USDT: How to Act in the Market When Panic Takes Over?Crypto Panic or Manipulation? A Deep Market Breakdown
🔥 Hello everyone, this is Ronin!
The last two trading days have been a real test for investors and traders in the cryptocurrency market. 📉 We witnessed a massive wave of liquidations, which literally crashed altcoins. Looking at the numbers:
Most assets dropped by 10–30%.
Some coins lost 50% of their value.
The total crypto market capitalization shrank by more than 10% in just a few days.
We haven’t seen a crash like this in a long time. 📉💥
What Are Analysts Saying?
According to most experts, the main reason for this decline was the new trade sanctions imposed by Donald Trump against Canada and Mexico. These sanctions allegedly led to an overall deterioration of the economic climate, causing capital to flow out of risk assets, including cryptocurrencies.
But is that really the case?
My Perspective: What Really Happened?
I can’t say with 100% certainty, but my decade of experience tells me otherwise. What we saw over the weekend was nothing more than crypto panic and large-scale market manipulation.
🔹 Why do I believe this?
The sanctions have no direct or indirect impact on the crypto market.
The key factor was the psychological state of market participants.
Friday was extremely positive: the Fear and Greed Index was in the "greed" zone, and ETF funds recorded record capital inflows.
The Fed left interest rates unchanged, which the market viewed more positively than negatively.
However, by the weekend, we saw massive sell-offs. The logic is simple: big players took advantage of the news cycle to wipe out market liquidity. 💸
The Hardest Hit: TON
💎 TON (The Open Network) is one of the most promising blockchain projects, closely tied to the Telegram ecosystem.
And here’s the question: Is there any real reason for TON to be this undervalued?
❌ The answer is a definite NO!
For comparison:
Even when Telegram’s founder, Pavel Durov, was arrested in France, the risks for the project were much higher, yet the price never dropped below $4.
However, on Sunday night, the price plummeted to $3 – with no real fundamental reason behind it.
📌 If that’s not manipulation, then what is?
What Do the Stats Say?
📊 More than $2 billion in liquidations occurred in a single trading day.
💥 This was one of the largest liquidation events in the history of the crypto market.
If you check CoinGlass, you’ll see a massive imbalance in liquidations between buyers and sellers. Big players literally wiped out everyone who was leveraged long.
What’s Next? Where Is the Market Headed?
As the saying goes: "Buy when everyone is selling, and sell when everyone is buying."
Right now:
✅ Everyone is selling.
✅ The market is in panic mode.
✅ Big players have wiped out overleveraged long positions.
What should you do in this situation? 🤔
Personally, my average entry on TON is $5. I bought 40,000 tokens, and yes – the drawdown is significant.
I had the temptation to close my position, wait for the bottom, and re-enter, but then I remembered one of the golden rules of the market:
💡 If everyone is selling, it’s time to buy!
So not only did I NOT close my position, but I increased it.
Conclusion: What to Expect Next?
📌 This was an artificial correction – a manipulation aimed at liquidating overloaded positions.
📌 The coming days will show a recovery, especially if volumes begin to rise.
📌 Market psychology is a key factor. When the market is in panic mode, big players are accumulating assets at low prices.
I will continue to publish updates on my TON position and other cryptocurrencies. If you’re interested in my strategy for recovering from this deep drawdown, follow my profile on TradingView.
🚀 In upcoming articles, we’ll analyze other coins and provide a microeconomic breakdown of projects in similar situations.
This has been Ronin – stay tuned for updates! There's a lot more to come. 🎯

TONUSDT ANALYSISHere's my view and understanding of TONUSDT.
It's following the Trendlines drawn perfectly until now.
If breaks the Resisting Trendline, One can consider adding quantities at retest.
Or else Wait.

Skyrexio | Toncoin TON Will Dump Before Huge Pump!Hello, Skyrexians!
Today we will take a look at the most hyped crypto of 2023. Now it looks like everybody forgot about BINANCE:TONUSDT because asset is in boring flat for 9 months. In our opinion price is about to start moving and we will see nice entry point soon for the potential insane growth.
Let's take a look at the weekly time frame. Here we can see the clear 5 waves cycle and now the wave 4 is in terminal phase. Target for the wave 4 is 0.38 Fibonacci level. If in this area Bullish/Bearish Reversal Bar Indicator will flash the green dot it's going to be strong sign to enter the trade for the wave 5. Wave 5 can easily break $10. We will update this idea when wave 4 is going to be finished.
Best regards,
Skyrexio Team
___________________________________________________________
Please, boost this article and subscribe our page if you like analysis!

TON/USDT : Get Ready for the next Bullish Mov (READ THE CAPTION)By analyzing the #TONCOIN daily chart, we can see that the price is currently trading within the $4.90 demand zone. If the price stabilizes above $4.20, we can anticipate the start of the next bullish wave for this promising cryptocurrency! The mid-term targets for TONCOIN are $5.30, $6.10, and $6.50, respectively.
Please support me with your likes and comments to motivate me to share more analysis with you and share your opinion about the possible trend of this chart with me !
Best Regards , Arman Shaban


TONS's situation+next targets and expected movements.The price is within an ascending wedge and this can be a bullish signal for TON. However, we need to wait for this wedge to be broken and then wait for the price to rise. Currently, the price can be bearish because more funds have been injected into Bitcoin to allow BTC to find more stability in the coming days.
Give me some energy !!
✨We spend hours finding potential opportunities and writing useful ideas, we would be happy if you support us.
Best regards CobraVanguard.💚
_ _ _ _ __ _ _ _ _ _ _ _ _ _ _ _ _ _ _ _ _ _ _ _ _ _ _ _ _ _ _ _
✅Thank you, and for more ideas, hit ❤️Like❤️ and 🌟Follow🌟!
⚠️Things can change...
The markets are always changing and even with all these signals, the market changes tend to be strong and fast!!

TON is stil Super Bullish (1D)This analysis is an update of the analysis you see in the "Related publications" section
Following the previous analysis, which is still valid, TON remains bullish.
Based on the signs observed from TON, it appears to be in a re-accumulation phase on the daily timeframe.
Whenever the price approaches the green zone, it is considered a good buying and holding opportunity toward the targets shown on the chart.
A daily candle closing below the invalidation level would invalidate this analysis.
For risk management, please don't forget stop loss and capital management
Comment if you have any questions
Thank You

#TON/USDT Ready to go higher#TON
The price is moving in a descending channel on the 1-hour frame and sticking to it well
We have a bounce from the lower limit of the descending channel, this support is at 5.10
We have a downtrend on the RSI indicator that is about to break, which supports the rise
We have a trend to stabilize above the moving average 100
Entry price 5.13
First target 5.27
Second target 5.40
Third target 5.58

TONUSDT: Breakout Ahead or Deeper Plunge?Yello, Paradisers! Could #TONUSDT be on the verge of a breakout or heading deeper into bearish territory? Read this before you trade!
💎#TONUSDT is currently trading within a falling wedge formation, which hints at a potential bullish reversal. The price recently tested a critical demand zone at $5.124, a level that has historically served as strong demand. A liquidity sweep below the wedge's lower boundary suggests that sellers might be losing momentum. However, for a bullish outlook to be validated, we still need confirmation of buyer strength stepping in to trigger a rebound.
💎On the upside, the descending resistance of the wedge has proven to be a persistent obstacle, rejecting multiple previous breakout attempts. A decisive breakout above this resistance could propel the price toward the next major resistance at $6.085. If #TON clears this level with strong momentum, the rally could potentially extend further into the $6.859–$6.974 zone, where stronger resistance is expected to emerge.
💎On the downside, if the demand zone at $5.124 fails to hold, the price could dip into the strong support area near $4.652. A breakdown below this level would invalidate the falling wedge pattern, exposing the price to further bearish pressure and potentially driving it down to $4.221.
Strive for consistency, not quick profits. Treat the market as a businessman, not a gambler. This is the only way you’ll make it far in your crypto trading journey. Be a PRO!
MyCryptoParadise
iFeel the success🌴

BULLISH TRIANGLE BREAKOUTOn H4 Timeframe bulls are incredibly dominant on Toncoin as a result of uptrend, on the other hand of the triangle, the breakout completely confirms the buy signal from 5.59
Follow for more ideas, Don't forget to boost this idea if you found it helpful

Be careful with TONCOIN !!!The price is within a wedge and also the price is at an important point. If it can break the wedge resistance, the price may go up to 5.7. We just have to wait for the wedge to break.
Give me some energy !!
✨We spend hours finding potential opportunities and writing useful ideas, we would be happy if you support us.
Best regards CobraVanguard.💚
_ _ _ _ __ _ _ _ _ _ _ _ _ _ _ _ _ _ _ _ _ _ _ _ _ _ _ _ _ _ _ _
✅Thank you, and for more ideas, hit ❤️Like❤️ and 🌟Follow🌟!
⚠️Things can change...
The markets are always changing and even with all these signals, the market changes tend to be strong and fast!!

35% TON PumpSignal:
📥 Entry Point: Between 4.950 and 5.180
🔴 Stop Loss: 4.650
📈 Targets:
5.642
6.006
6.342
6.750
Overall Trend Analysis:
📉 Current Trend: Bearish with a potential reversal from the buy zone.
🟡 Moving Average (MA): Price is below the MA, indicating selling pressure continues.
📊 Note: If the price stabilizes in the buy zone, there’s a high probability of reaching the mentioned targets.
⚠️ Warning: If the stop loss is breached, the bearish trend may strengthen, invalidating the setup.
