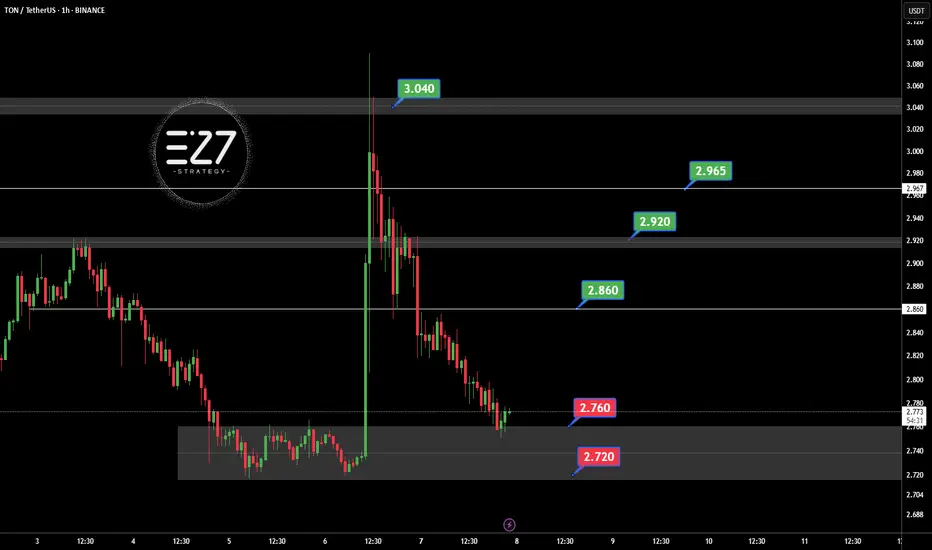
TONUSDT Following the official denial by UAE authorities regarding the possibility of obtaining a golden visa through staking OKX:TONUSDT , the bullish momentum driven by that rumor has faded. Selling pressure has increased, and TON is now consolidating within the key support zone of 2.720 to 2.760 USDT. If this support breaks, further downside is likely. However, if the price holds and reclaims the 2.860 USDT resistance, it could trigger a recovery toward 2.920 and 2.965 USDT. For now, the market sentiment remains bearish with a corrective bias.
Key Points:
UAE officially denied TON-based golden visa claims, weakening sentiment.
Current support zone: 2.720–2.760 USDT.
Key resistance: 2.860 USDT, then 2.920 USDT.
Break below 2.720 = further decline.
Break above 2.860 = potential bullish reversal.
⚠️ Please Control Risk Management in trades.
TONCOINUSD
Today's signal is TONHello friends
Given the price growth after reaching resistance, it has entered a correction, which provides a good opportunity to buy in stages and with capital management and move to the specified targets.
*Trade safely with us*

TONUSDT On the @TONUSDT chart, price is currently making a corrective move after reacting to the key support at 2.800. It may rise toward the 3.230 resistance and potentially break higher with a pullback to continue upward. However, if the 2.800 support fails, a deeper drop could follow. ⚠️📉
Resistances:
• 3.230 💥
• 3.371 🔼
• 3.656 🔼
• 3.948 🚀
Supports:
• 2.910 🛡️
• 2.800 🔻
⚠️Contorl Risk management for trades.

LIVE TRADEHello friends
Given the ascending channel that has formed, we can open positions with capital and risk management to move towards the specified goals.
*Trade safely with us*

#TON/USDT#TON
The price is moving within a descending channel on the 1-hour frame, adhering well to it, and is heading for a strong breakout and retest.
We are experiencing a rebound from the lower boundary of the descending channel, which is support at 3.20.
We are experiencing a downtrend on the RSI indicator, which is about to break and retest, supporting the upward trend.
We are looking for stability above the 100 Moving Average.
Entry price: 3.30
First target: 3.41
Second target: 3.53
Third target: 3.69

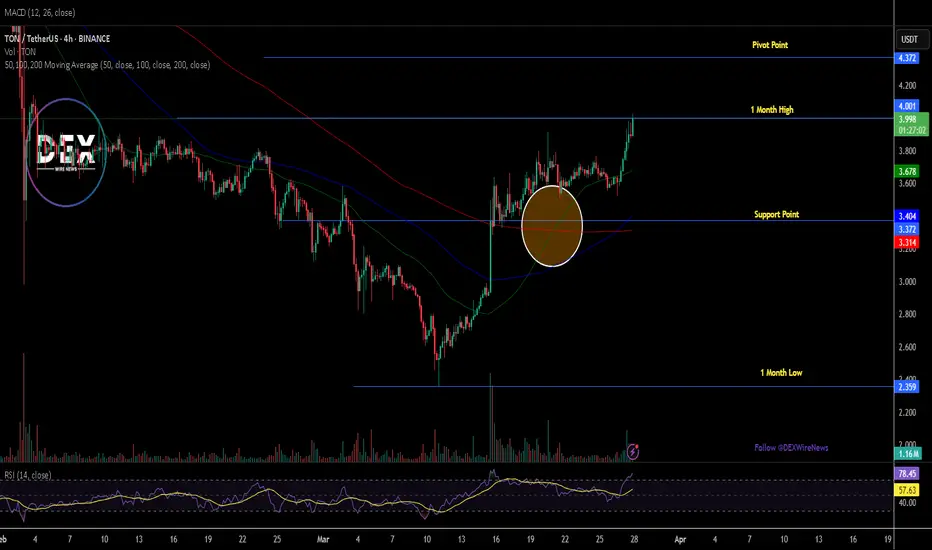
TONCOINCRYPTOCAP:TON In the 4-hour timeframe, key support and resistance zones have been identified based on significant highs and lows. The primary resistance area is at $4.070, while the main support level is at $2.860. A descending trendline has been drawn, and the price trading below the 200-period moving average suggests continued bearish momentum in this time horizon. However, if the near-term resistance at $3.590 is broken, a potential upward movement towards the primary resistance at $4.070 could occur. Conversely, a break below the immediate support at $3.000 might lead to a price decrease towards the main support level at $2.860. To confirm bullish or bearish scenarios, monitoring for valid breakouts of these levels along with volume analysis and other technical tools is essential.

#TON/USDT#TON
The price is moving within a descending channel on the 1-hour frame, adhering well to it, and is heading towards a strong breakout and retest.
We are experiencing a rebound from the lower boundary of the descending channel, which is support at 2.97.
We are experiencing a downtrend on the RSI indicator, which is about to break and retest, supporting the upward trend.
We are looking for stability above the 100 Moving Average.
Entry price: 3.02
First target: 3.05
Second target: 3.15
Third target: 3.22

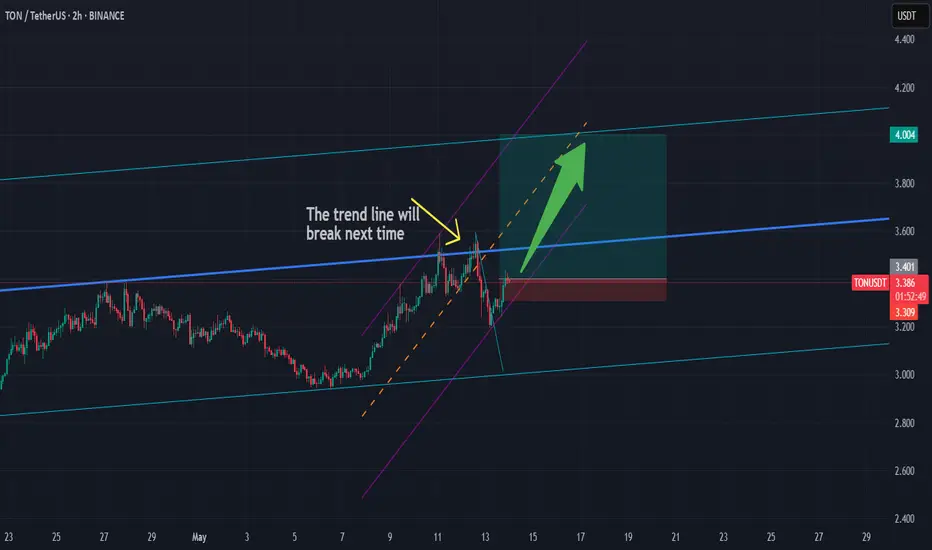
Long TON/USDTThe trend line touch two times and in the next time will break,
We are in the parallel channel and go up,
First target is 4$ soon.
Good Luck..
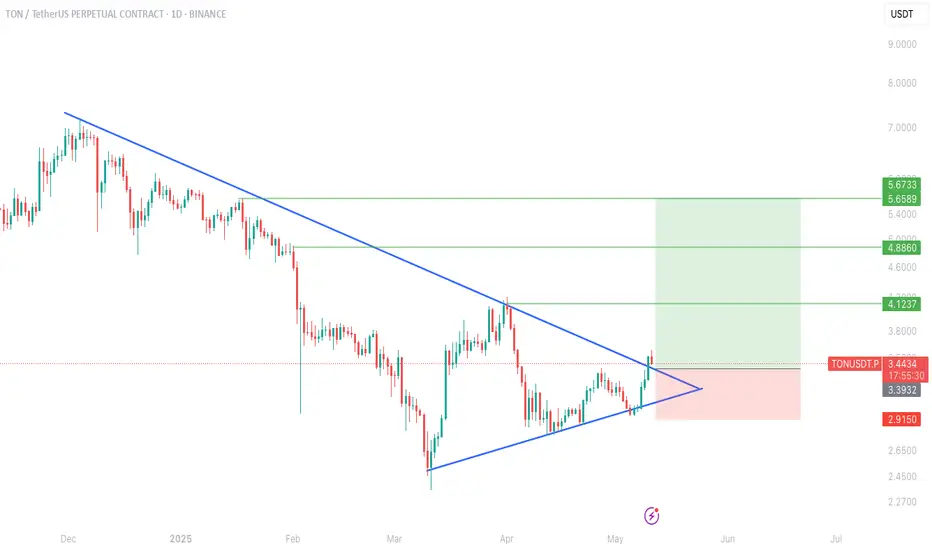
TON breakout alert!!CRYPTOCAP:TON chart Update!
TON has officially broken out of a multi-month symmetrical triangle on the daily chart, signaling a potential trend reversal after a long downtrend.
📈 Clean breakout above descending resistance
🔼 Entry triggered around $3.44
🎯 Targets ahead:
TP1: $4.12
TP2: $4.88
TP3: $5.67
As long as the price stays above the breakout zone, bulls are in control. A successful retest could offer another great entry!
If you find this analysis helpful, please hit the like button to support my content! Share your thoughts in the comments, and feel free to request any specific chart analysis you’d like to see.
Happy Trading!!
TON Bullish📉 TON/USDT 4H Analysis:
After breaking below the key support at 3.729, TON saw a sharp drop toward 2.849, where it found a strong bullish reaction. A short-term bullish correction is currently underway, but resistance at 3.3–3.4 and the 200 EMA may limit further upside. If TON fails to break through, it could retest 2.849 or drop to the 2.505 demand zone. For a true bullish reversal, a confirmed breakout and consolidation above 3.729 is essential.

#TON/USDT#TON
The price is moving within a descending channel on the 1-hour frame and is expected to continue lower.
We have a trend to stabilize below the 100 moving average once again.
We have a downtrend on the RSI indicator, supporting the upward move with a breakout.
We have a resistance area at the upper limit of the channel at 3.73.
Entry price: 3.69
First target: 3.60
Second target: 3.515
Third target: 3.40

Is a TON Pump Coming?Is a TON Pump Coming? 🚀
TON, the blockchain developed by Telegram’s team, has gained significant attention due to its low transaction fees and strong connection with Telegram. Recent increases in liquidity and demand indicate growing investor interest in this cryptocurrency.
🔹 Technical Analysis:
TON is currently in a short-term uptrend, with $4 acting as a key resistance level. A confirmed breakout above this level could push the price towards $7. However, failure to break this resistance may lead to a price correction toward lower support levels.
🔹 Potential Risks:
A significant portion of TON tokens is held by whales, which could lead to high volatility. Additionally, its unlimited supply poses long-term inflation risks if not managed properly.
🔹 Growth Catalysts:
Recent positive news, such as Telegram’s potential partnership with AI (Grok) and the release of key updates, could drive further demand. If TON sustains its momentum and breaks key resistance levels, it may enter a stronger bullish phase.
📌 Conclusion:
While TON has strong fundamentals and market interest, its long-term stability depends on supply management and investor behavior. Entry at key levels with proper risk management is essential for those looking to trade or invest. 🚀

TON Claims $4 Pivot Amidst A Golden Cross PatternThe price of CRYPTOCAP:TON spiked 9% today reclaiming the $4 price pivot with further growth set to occur amidst a "Golden Cross" pattern.
The Open Network ( CRYPTOCAP:TON ) is a revolutionary blockchain platform designed to handle millions of transactions per second. It uses a unique multi-blockchain architecture with dynamic sharding and instant messaging between chains.
The system aims to make blockchain technology accessible to everyday users through integration with messaging apps and user-friendly services. TON has become one of the fastest-growing blockchain ecosystems, with numerous decentralized applications and services being built on its infrastructure.
As of the time of writing, CRYPTOCAP:TON is up 9% trading within overbought regions as hinted by the RSI at 78.78 with growing momentum and the appearance of a golden cross pattern, a breakout to $6 is feasible.
For TON, a breakout above the 1-month high pivot could cement a move to the $6 region. Similarly, in the case of a cool-off, given the RSI is overbought, the 38.2% Fibonacci level is acting as support for $TON.
Toncoin Price Live Data
The live Toncoin price today is $3.96 USD with a 24-hour trading volume of $285,169,930 USD. Toncoin is up 8.27% in the last 24 hours. The current CoinMarketCap ranking is #12, with a live market cap of $9,833,721,005 USD. It has a circulating supply of 2,484,304,181 TON coins and the max. supply is not available.
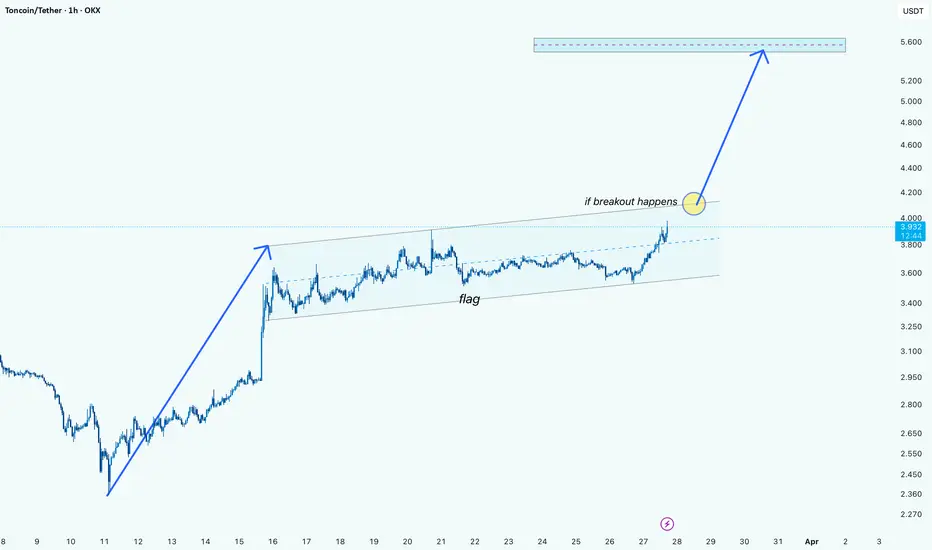
Toncoin Bullish Flag Breakout in Sight?Hello guys!
ton seems like a potential coin for getting it!
The chart shows Toncoin forming a bullish flag pattern after a strong upward move. The price is testing the upper boundary of the flag, indicating a potential breakout. If the breakout confirms, the price could rally towards the $5.60 target. Traders should watch for increased volume and a clean break above resistance to validate the move. Failure to break out could result in consolidation within the channel.
TONCOIN BUY !!!hello friends
Considering the heavy fall that we had, the price was able to maintain itself and with the specified support, we are going for the specified goals, of course, with risk and capital management...
*Trade safely with us*

Toncoin TON price will surprise everyone💎If you look closely at the OKX:TONUSDT chart, you can see/think that the last six months have seen a global trend reversal pattern - Head and Shoulders.
But! This pattern will be confirmed after the price of CRYPTOCAP:TON is firmly fixed below $4.50. Then the target is $2.30-2.50.
However, this is all very obvious, trite, and not interesting)
We want this idea to become prophetic and Legendary, so we hope for the beginning of a hypercycle of #Toncoin price growth with an ultimate goal of $93
_____________________
Did you like our analysis? Leave a comment, like, and follow to get more

TONUSDT TONUSDT Signal 🚀
🔹 Entry: Wait for a complete pullback (Confirm support) 3.154
🔹 Targets:
🎯 3.489 (First resistance)
🎯 3.869 (Key breakout level)
🎯 4.478 (Major resistance)
🎯 4.731 (Final target)
🔹 Stop Loss: 2.731 (Below key support)
🔹 Risk Management: Control your risk before entering

TonCoin- Eliminate the useless, keep the essential.
- imo Toncoin looks bottomed, but remember, crypto moves fast, if BTC dips, altcoins usually follow harder.
- That said, for now, I don’t see altcoins dropping further; they sound to be not far from a rock bottom.
------------------------------------------------------------------
Simple Trade Strategy :
------------------------------------------------------------------
- Buy now around 3$
- Keep some juice to DCA more around 2.30$
------------------------------------------------------------------
TP : 5.50$
SL : 1.95$
------------------------------------------------------------------
Play Wisely !
Happy Tr4Ding !

TON (telegram coin): a dejavuhello guys!
I published my reasons for an upward movement before:
Let's dig into the history of this coin and analyze what happened before and after forming this candle!

Skyrexio | Toncoin TON Will Dump Before Huge Pump!Hello, Skyrexians!
Today we will take a look at the most hyped crypto of 2023. Now it looks like everybody forgot about BINANCE:TONUSDT because asset is in boring flat for 9 months. In our opinion price is about to start moving and we will see nice entry point soon for the potential insane growth.
Let's take a look at the weekly time frame. Here we can see the clear 5 waves cycle and now the wave 4 is in terminal phase. Target for the wave 4 is 0.38 Fibonacci level. If in this area Bullish/Bearish Reversal Bar Indicator will flash the green dot it's going to be strong sign to enter the trade for the wave 5. Wave 5 can easily break $10. We will update this idea when wave 4 is going to be finished.
Best regards,
Skyrexio Team
___________________________________________________________
Please, boost this article and subscribe our page if you like analysis!

BULLISH TRIANGLE BREAKOUTOn H4 Timeframe bulls are incredibly dominant on Toncoin as a result of uptrend, on the other hand of the triangle, the breakout completely confirms the buy signal from 5.59
Follow for more ideas, Don't forget to boost this idea if you found it helpful

35% TON PumpSignal:
📥 Entry Point: Between 4.950 and 5.180
🔴 Stop Loss: 4.650
📈 Targets:
5.642
6.006
6.342
6.750
Overall Trend Analysis:
📉 Current Trend: Bearish with a potential reversal from the buy zone.
🟡 Moving Average (MA): Price is below the MA, indicating selling pressure continues.
📊 Note: If the price stabilizes in the buy zone, there’s a high probability of reaching the mentioned targets.
⚠️ Warning: If the stop loss is breached, the bearish trend may strengthen, invalidating the setup.

TON, sellers are showing their weakness, it's a good time to buyTON, sellers are showing their weakness, it's a good time to buy
Three times sellers tried to sell the price lower, and the movement each time became smaller, the last movement with no volume showed the complete powerlessness of sellers, and gives a good entry point to buy. I'm going in with a potential of 1:4
🚀 Trade with the professionals of THS - Wave Theory!
🔹 All trades are based on wave analysis.
🔹 Fixed stop loss and take profit for risk management.
🔹 100% automation: copy trades through CopyFX service.
🔹 Reliability and transparency: the results are confirmed by the market.
📈 Don't miss the chance to earn steadily!
👉 Connect to CopyFX with THS and start copying profitable trades right now!
💡 Details on our channel and in the app!
