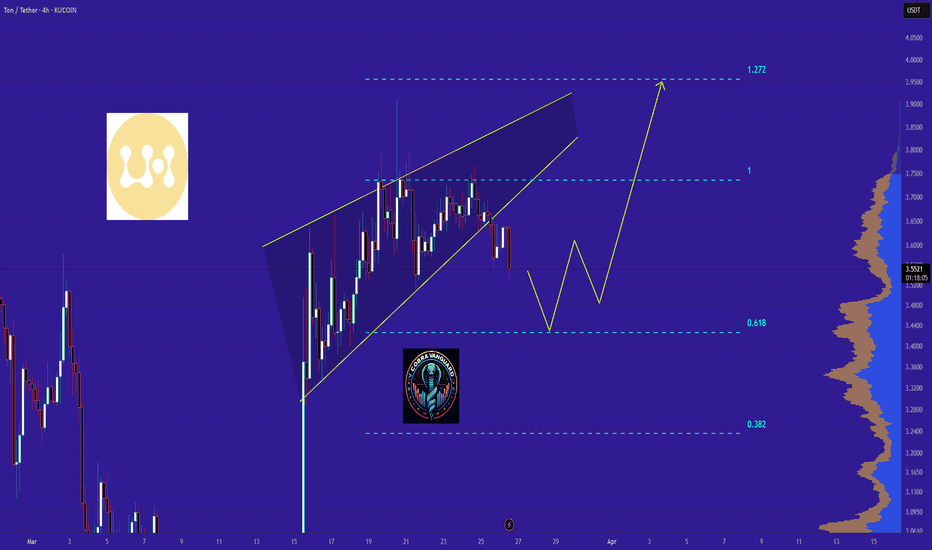
TON Ready for PUMP or what ?The price will correct to the 0.618 level and then rise to 4 dollars.
Give me some energy !!
✨We spend hours finding potential opportunities and writing useful ideas, we would be happy if you support us.
Best regards CobraVanguard.💚
_ _ _ _ __ _ _ _ _ _ _ _ _ _ _ _ _ _ _ _ _ _ _ _ _ _ _ _ _ _ _ _
✅Thank you, and for more ideas, hit ❤️Like❤️ and 🌟Follow🌟!
⚠️Things can change...
The markets are always changing and even with all these signals, the market changes tend to be strong and fast!!
TONUSDC
TON road map !!!If the price can break through this important resistance, it can easily reach the desired targets.
Give me some energy !!
✨We spend hours finding potential opportunities and writing useful ideas, we would be happy if you support us.
Best regards CobraVanguard.💚
_ _ _ _ __ _ _ _ _ _ _ _ _ _ _ _ _ _ _ _ _ _ _ _ _ _ _ _ _ _ _ _
✅Thank you, and for more ideas, hit ❤️Like❤️ and 🌟Follow🌟!
⚠️Things can change...
The markets are always changing and even with all these signals, the market changes tend to be strong and fast!!
TONUSDT: A Fresh StartAfter a challenging period with two unsuccessful short positions, I’m now entering a new phase with a long position in TONUSDT. Here’s why I see this as a promising opportunity.
Market Context: The Oversold Thesis
We seem to be back at the point where all indicators are flagging TON as oversold. This creates a potential entry point for a rebound. The market activity surrounding TRUMP coin might be partly responsible for this situation.
It seems that many traders are scrambling to buy TRUMP coin on Solana, selling off other assets—potentially including TON—in the process. While this aggressive push toward TRUMP coin has driven its market cap to an astonishing $8 billion, I’m not convinced this is a sustainable strategy. Such a frenzy often leaves room for other undervalued assets like TON to shine.
Why TON Looks Promising
Despite the wild market dynamics of yesterday, TON stands out with promising indicators signaling potential for growth. Its oversold conditions combined with strong fundamentals provide a compelling case for a rebound.
Position Details: Turning to Longs
After the pain of two short positions, it’s refreshing to find an opportunity to go long. TONUSDT offers a chance to recalibrate and capitalize on market mispricing caused by speculative hype elsewhere.
While the crypto market remains volatile and unpredictable, this position feels like a calculated risk backed by data and market context.
Duration:
This is a short-term trade.
Target:
The goal is to achieve 100% profit. The entry is made on Binance with 25x leverage, using a $30 margin, resulting in a total position size of ±$700.
Risk:
This trade is classified as medium risk in crypto.
TON - Time to long ASAPIf you’re looking for a potential entry point, the current setup presents a compelling case to heavily long. Let’s break down the technical and fundamental factors that suggest an upward reversal could be imminent:
Fundamentally Strong Asset
The foundation of any trade starts with the fundamentals. This asset has strong underlying value, making it more likely to recover after recent volatility. It’s crucial to align technical indicators with the strength of the asset’s intrinsic value.
Significant Drop Within 3 Days
A sharp decline over the last three days indicates potential overselling. Rapid price drops often bring assets into undervalued territory, creating an opportunity for a strong bounce, especially when combined with key support levels.
Triple-Tested Support Line
The price has tested the same support level three times, which strengthens the credibility of this level as a firm floor. Repeated tests without a breakdown often signal a potential reversal, as sellers struggle to push the price lower.
Outside Bollinger Bands
The current price is trading outside the lower Bollinger Band, a classic sign that the asset is oversold. This indicates that bearish momentum could be exhausting, and a mean reversion back to the center of the bands is likely.
Below All Moving Averages (MAs)
The price is sitting below all major Moving Averages (e.g., 50 MA, 100 MA, 200 MA). While this may seem bearish at first, it also shows the asset is in an extreme position, making it ripe for a snapback rally when momentum shifts.
MACD and RSI Signaling a Turnaround
Both MACD and RSI are signaling potential bullish momentum:
MACD: Shows signs of convergence or a potential crossover, often a precursor to upward momentum.
RSI: In oversold territory, suggesting the asset is undervalued and due for a recovery.
Too many factors are saying that we should be bullish.
Time term > could be short and long depending on your needs. You can enter as investor into TON ecosystem too, so in case bad trade you can just DCA.
Target > to get 100%
Entered with Binance x25 leverage
Margin 30$
Total size 770$
Risk: Medium in case you are ready to make DCA


