LIVE TRADEHello friends
Given the ascending channel that has formed, we can open positions with capital and risk management to move towards the specified goals.
*Trade safely with us*
Tonusdt

TON It will grow soon...Currently, TON is forming an ascending triangle, indicating a potential price increase. It is anticipated that the price could rise, aligning with the projected price movement (AB=CD).
However, it is crucial to wait for the triangle to break before taking any action.
Give me some energy !!
✨We spend hours finding potential opportunities and writing useful ideas, we would be happy if you support us.
Best regards CobraVanguard.💚
_ _ _ _ __ _ _ _ _ _ _ _ _ _ _ _ _ _ _ _ _ _ _ _ _ _ _ _ _ _ _ _
✅Thank you, and for more ideas, hit ❤️Like❤️ and 🌟Follow🌟!
⚠️Things can change...
The markets are always changing and even with all these signals, the market changes tend to be strong and fast!!

TON Looks Ready to Collapse — Is This the Start of a Bull Trap?Yello Paradisers! what if TON is about to reverse hard—are you positioned correctly, or will you be caught chasing the wrong move?
💎TONUSDT is showing clear bearish signs that can’t be ignored. The price has broken down from an ascending channel—a classic early signal of weakness. But that’s not all. This breakdown happened right at the resistance zone, and it’s backed by a clear bearish divergence on momentum indicators. Adding to the conviction, there’s a 1H Fair Value Gap (FVG) sitting right in that same region, which often acts as a magnet for price before continuation to the downside.
💎This confluence significantly increases the probability of a bearish move in the short term. So, what’s the plan?
💎For risk-averse (safe) traders, the optimal approach is to wait for a pullback and retest of the broken structure. This allows for a cleaner entry and a much better risk-to-reward (RR) ratio. For the aggressive players, there’s potential to enter with reduced size from the current level, understanding that it carries more risk without confirmation.
💎However, if the price manages to break out and closes candle above the resistance zone, this entire bearish setup becomes invalidated. In that case, the smart play is to stay patient and wait for a more favorable structure or price action to develop.
🎖If you want to be consistently profitable, you need to be extremely patient and always wait only for the best, highest probability trading opportunities.
MyCryptoParadise
iFeel the success🌴

Toncoin Major Advance Now! New All-Time High Incoming (PP: 200%)Toncoin entered its current price range in February, four months ago. After some shaking, this project has been sideways and four months sideways is a very long time when it comes to Crypto, there is good news of course.
When the drop happened in March a bottom pattern was confirmed. A bottom means the bearish trend ends and the market prepares to change.
Just a few days ago, TONUSDT produced really high volume, signaling the start of a new uptrend, higher highs and higher lows.
This post is a friendly reminder just to let you know that Toncoin is about to go up and it will de so really strong.
The signals are in. Consolidation has been strong. The action is happening above support.
An advance now will be strong first, then fast, then slow followed by additional growth. I mean, the bullish action won't stop at $5.51 nor $10 ($9.92), it will continue growing, growth long-term. We are set to experience a new all-time high, the strongest bullish action in the history of Toncoin, it is starting now.
Thank you for reading.
Namaste.

TONCOIN Hits First Target with 27% Gain – More Upside Ahead?By examining the #TONCOIN chart on the 3-day timeframe, we can see that after the last analysis, the price successfully hit the $3.64 target and has gained a total of 27%. Following this rise, the price entered a corrective phase and is currently trading around $3.15. The analysis remains valid, and I still expect further upside from this cryptocurrency. The expected return is around 20% in the short term, 40% to 55% in the medium term, and 110% in the long term.
Please support me with your likes and comments to motivate me to share more analysis with you and share your opinion about the possible trend of this chart with me !
Best Regards , Arman Shaban

TON/USDT – Ready for the Next Move?🚀 Trade Setup Details:
🕯 #TON/USDT 🔼 Buy | Long 🔼
⌛️ TimeFrame: 1H
--------------------
🛡 Risk Management:
🛡 If Your Account Balance: $1000
🛡 If Your Loss-Limit: 1%
🛡 Then Your Signal Margin: $990.1
--------------------
☄️ En1: 3.082 (Amount: $99)
☄️ En2: 3.073 (Amount: $346.54)
☄️ En3: 3.066 (Amount: $445.55)
☄️ En4: 3.06 (Amount: $99)
--------------------
☄️ If All Entries Are Activated, Then:
☄️ Average.En: 3.074 ($990.1)
--------------------
☑️ TP1: 3.104 (+0.98%) (RR:0.97)
☑️ TP2: 3.12 (+1.5%) (RR:1.49)
☑️ TP3: 3.141 (+2.18%) (RR:2.16)
☑️ TP4: 3.168 (+3.06%) (RR:3.03)
☑️ TP5: 3.198 (+4.03%) (RR:3.99)
☑️ TP6: Open 🔝
--------------------
❌ SL: 3.043 (-1.01%) (-$10)
--------------------
💯 Maximum.Lev: 54X
⌛️ Trading Type: Swing Trading
‼️ Signal Risk: ⚠️ High-Risk! ⚠️
🔎 Technical Analysis Breakdown:
This technical analysis is based on Price Action, Elliott waves, SMC (Smart Money Concepts), and ICT (Inner Circle Trader) concepts. All entry points, Target Points, and Stop Losses are calculated using professional mathematical formulas. As a result, you can have an optimal trade setup based on great risk management.
📊 Sentiment & Market Context:
Toncoin (TON) shows strong bullish momentum against USDT, supported by growing investor confidence and positive market sentiment. After a period of consolidation, the pair is setting up for a potential breakout as technical indicators align with rising demand.
The Toncoin ecosystem, backed by the Telegram Open Network, is gaining traction due to its scalability, speed, and integration potential with Telegram’s massive user base. This real-world utility and adoption fuel bullish sentiment, making TON a top contender in the altcoin space.
⚠️ Disclaimer:
Trading involves significant risk, and past performance does not guarantee future results. This analysis is for informational purposes only and should not be considered financial advice. Always conduct your research and trade responsibly.
💡 Stay Updated:
Like this technical analysis? Follow me for more in-depth insights, technical setups, and market updates. Let's trade smarter together!

TONUSDT 1D AnalysisTON ~ 1D Analysis
#TON Buy back gradually from here with a short term target of at least 15%+, Long term target $8
TON/USDT on Fire: Bullish Momentum Builds Toward Major Targets!By examining the #TONCOIN chart on the 3-day timeframe, we can see that after correcting down to $3, the price has started pumping again and is showing strong bullish momentum. So far, it has gained over 15%, and I expect this uptrend to continue! The next targets are $3.64, $4.20, and $4.66. The expected return is around 20% in the short term, 40% to 55% in the medium term, and 110% in the long term. Support this analysis and stay tuned for more updates, my friends!
Please support me with your likes and comments to motivate me to share more analysis with you and share your opinion about the possible trend of this chart with me !
Best Regards , Arman Shaban

TONUSDT Forming Falling Wedge TONUSDT is currently forming a classic falling wedge pattern—a historically bullish setup that often precedes major price breakouts. The recent breakout from the wedge accompanied by a significant surge in volume indicates a shift in market sentiment. This pattern suggests the end of a downtrend and the beginning of a new bullish wave. Such formations often result in strong upward price action once the resistance trendline is broken with volume confirmation.
Market participants have shown renewed interest in TON, with price currently stabilizing above a previous key resistance level, now potentially acting as support. This shift aligns with the historical behavior of wedge breakouts, where the asset consolidates briefly before continuing its climb. The current structure and momentum signal a potential 90% to 100% price appreciation, especially as investors recognize the strength of the breakout and the fundamental developments behind the project.
The volume profile further supports this bullish thesis. An increase in buying pressure at the breakout level reinforces the conviction that a trend reversal is in play. If TON maintains its bullish structure, the next major resistance zones could be tested, offering traders and long-term holders a strong opportunity to capitalize on this technical shift.
With rising investor interest and a textbook bullish pattern breakout, TONUSDT is a crypto pair to watch closely. The breakout from the falling wedge combined with solid volume growth and increasing sentiment across crypto communities signals that a new uptrend could be underway.
✅ Show your support by hitting the like button and
✅ Leaving a comment below! (What is You opinion about this Coin)
Your feedback and engagement keep me inspired to share more insightful market analysis with you!

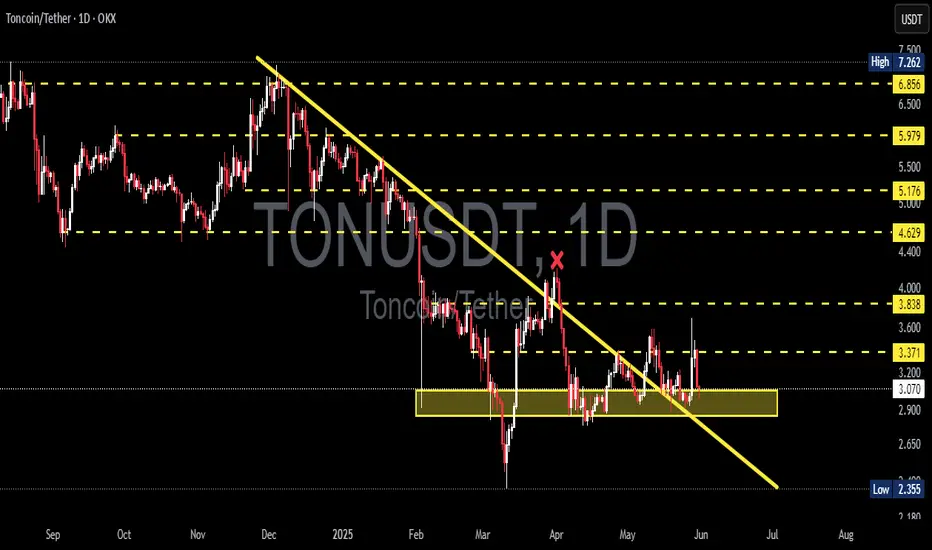
$TON Breakout Loading CRYPTO:TONUSD is at the apex of a symmetrical triangle, a breakout is imminent.
A daily close above $3.3095 could trigger a strong move toward $4.2128, $5.6017, and $7.2199 (+120%).
Watch closely. High risk-to-reward setup loading.
DYRO, NFA

#TON/USDT#TON
The price is moving within a descending channel on the 1-hour frame, adhering well to it, and is heading for a strong breakout and retest.
We are experiencing a rebound from the lower boundary of the descending channel, which is support at 3.20.
We are experiencing a downtrend on the RSI indicator, which is about to break and retest, supporting the upward trend.
We are looking for stability above the 100 Moving Average.
Entry price: 3.30
First target: 3.41
Second target: 3.53
Third target: 3.69

TONCOINCRYPTOCAP:TON In the 4-hour timeframe, key support and resistance zones have been identified based on significant highs and lows. The primary resistance area is at $4.070, while the main support level is at $2.860. A descending trendline has been drawn, and the price trading below the 200-period moving average suggests continued bearish momentum in this time horizon. However, if the near-term resistance at $3.590 is broken, a potential upward movement towards the primary resistance at $4.070 could occur. Conversely, a break below the immediate support at $3.000 might lead to a price decrease towards the main support level at $2.860. To confirm bullish or bearish scenarios, monitoring for valid breakouts of these levels along with volume analysis and other technical tools is essential.

Toncoin 5X Lev. Full PREMIUM Trade-Numbers (PP: 1480%)This chart setup with leverage originally came to my attention around 15-April. Seeing the same market conditions now after some consolidation and a small higher low makes the setup stronger.
This is an easy one. I think it has a good chance of success and the timing is about right.
Just make sure your position is safe (low leverage) and you should do fine.
Full trade-numbers below:
_____
LONG TONUSDT
Leverage: 5X
Entry levels:
1) $3.10
2) $2.85
3) $2.65
Targets:
1) $3.23
2) $3.75
3) $4.28
4) $4.62
5) $5.32
6) $6.01
7) $7.01
8) $8.28
9) $9.68
10) $10.5
11) $11.9
Stop-loss:
Close weekly below $2.50
Potential profits: 1480%
Capital allocation: 4%
_____
Leveraged trading can be a lot about position managing and capital allocation, if you are going for those very small and short-term swings. If you are looking for long-term trade setups like I do, timing and entry prices are king. The top priority.
I think both are excellent here but you know anything goes. While I like a high accuracy/hit rate, the market is not without risk and anything can happen at any time. Not all trades are won but it can be good this time.
With the right capital allocation, mindset and planning, you can't go wrong.
As the market turns bullish, as soon as the up-move starts, you have secured an awesome position.
Thanks a lot for your continued support.
Namaste.

TON on DailyFollowing an important distribution of TON, I have noticed how in the last period it is in a sideways phase, which could herald a Wyckoff accumulation.
Below I have made the relevant changes and included tickers so that you too can view them.
As always, you can copy and follow my setup.
Be careful out there.
Happy trading.

#TON/USDT#TON
The price is moving within a descending channel on the 1-hour frame, adhering well to it, and is heading towards a strong breakout and retest.
We are experiencing a rebound from the lower boundary of the descending channel, which is support at 2.97.
We are experiencing a downtrend on the RSI indicator, which is about to break and retest, supporting the upward trend.
We are looking for stability above the 100 Moving Average.
Entry price: 3.02
First target: 3.05
Second target: 3.15
Third target: 3.22

Interesting moment for try to Sell TON. Interesting moment for try to Sell TON. The 3.35 the local horizontal level. The current point can be local low. The logically we can try to take the long from current price with stop by previous low. But I have small idea that this point local low point will not formed and we still move to down. It is why I put the stop around 3.35 level, because it is first long goal if price move to up. Will see...

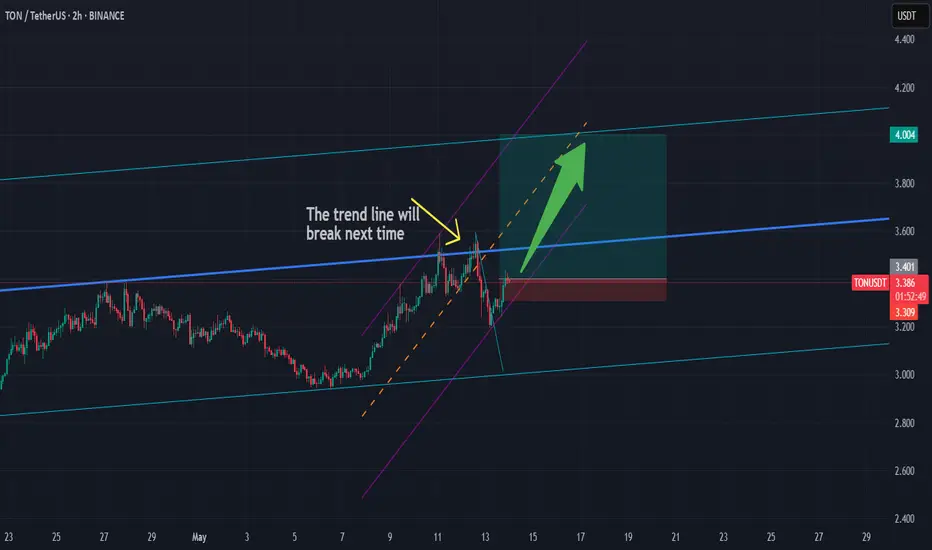
Long TON/USDTThe trend line touch two times and in the next time will break,
We are in the parallel channel and go up,
First target is 4$ soon.
Good Luck..
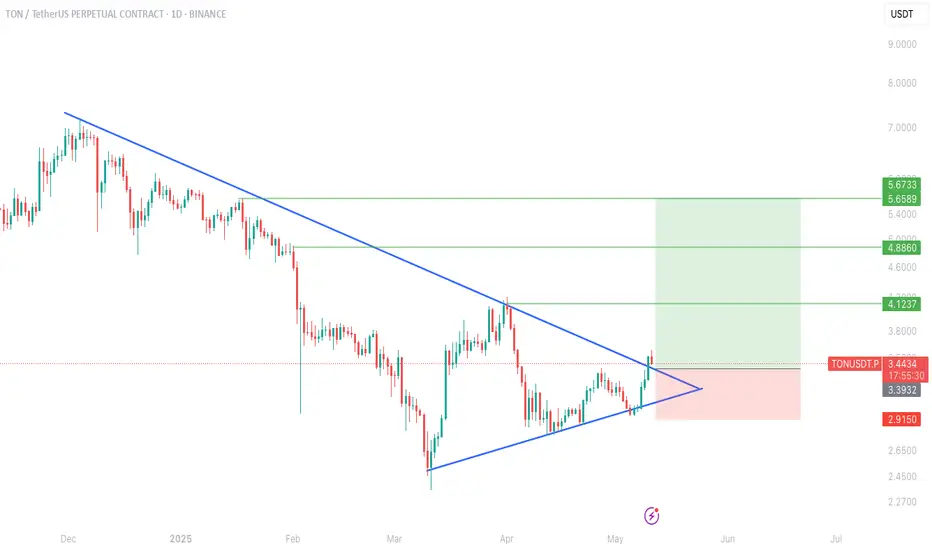
TON breakout alert!!CRYPTOCAP:TON chart Update!
TON has officially broken out of a multi-month symmetrical triangle on the daily chart, signaling a potential trend reversal after a long downtrend.
📈 Clean breakout above descending resistance
🔼 Entry triggered around $3.44
🎯 Targets ahead:
TP1: $4.12
TP2: $4.88
TP3: $5.67
As long as the price stays above the breakout zone, bulls are in control. A successful retest could offer another great entry!
If you find this analysis helpful, please hit the like button to support my content! Share your thoughts in the comments, and feel free to request any specific chart analysis you’d like to see.
Happy Trading!!
TON Bullish📉 TON/USDT 4H Analysis:
After breaking below the key support at 3.729, TON saw a sharp drop toward 2.849, where it found a strong bullish reaction. A short-term bullish correction is currently underway, but resistance at 3.3–3.4 and the 200 EMA may limit further upside. If TON fails to break through, it could retest 2.849 or drop to the 2.505 demand zone. For a true bullish reversal, a confirmed breakout and consolidation above 3.729 is essential.

Toncoin: Still Early But Bullish (PP: 253% & 429%)Believe it or not, it is till early for Toncoin and this is good news for buyers. It is still early but very bullish.
The low here happened 10-March 2025, which means that buyers were present in April and ended up supporting the project and not letting it produce a lower low. This reveals how strong this pair will grow in this bullish cycle.
The current weekly candle is trading above the two previous weeks open and close. This little simple signal reveals that the continuation of the initial bullish reaction when the low was hit is about to happen, or you could, it is the start of the next bullish wave.
The main target I am showing here is $11.95 for a nice 253% profits but there is more. This is the final target only because I am using the linear chart. There is also $17.88 for a great 429%. These targets should hit easily as the bull market develops, expect growth long-term.
It is still early for Toncoin, early but bullish.
Thank you for reading.
Namaste.

TONUSDT Built a Fresh Up Trend!!!Hey Traders, in today's trading session we are monitoring TONUSDT for a buying opportunity around 3.20 zone, TONUSDT is trading in an uptrend and currently is in a correction phase in which it is approaching the trend at 3.20 support and resistance area.
Trade safe, Joe.

TON/USDT : The Next Bullish Rally Ahead? (READ THE CAPTION)By analyzing the #Toncoin chart on the 3-day timeframe, we can see that the price is currently trading around $3.00, which is approximately 60% below its all-time high of $8.20. If Toncoin can hold above the $2.80 level, we may expect further bullish momentum in the mid-term.
The next potential upside targets are $3.39, $3.64, $4.20, and $4.66.
Please support me with your likes and comments to motivate me to share more analysis with you and share your opinion about the possible trend of this chart with me !
Best Regards , Arman Shaban

TONUSDT 1D AnalysisTON ~ 1D Analysis
#TON Buy after successfully breaking this resistance line with a short term target of at least 15%+ from here.
