Trading opportunity for TONUSDTBased on technical factors there is a Buy position in :
📊 TONUSDT
🔵 Buy Now
🪫Stop loss 5.200
🔋Target 1 6.500
🔋Target 2 7.250
🔋Target 3 8.300
💸RISK : 1%
We hope it is profitable for you ❤️
Please support our activity with your likes👍 and comments📝
Tonusdt

TON can flyAfter the pullback in substructrue, a price compression has been created that has come out of this compression.
We have a bullish iCH on the chart.
The basic structure of TON is Boolean.
Closing the daily candle below the invalidation level will violate this analysis.
Do not enter the position without capital management and stop setting
Comment if you have any questions
thank you

TON Idea set upAt the moment everything is pumping, this chart looks bullish, broke the falling daily wedge, now currently cooling down. Keep on your watchlist. Follow me for more ideas

NOTUSDT - CLEAR CHARTabout 6 months of consolidation of falling wedge pattern in 3d chart
breakout✅
under retest now...
important breakout the 0.0095 (key level) to reach great targets
Best regards Ceciliones🎯

TONCOIN WILL KEEP GROWING|LONG|
✅TON/USDT is a coin to watch
As we are entering an Altcoin
Season again. A strong bullish
Rebound from the horizontal
Support of 4.4$ paired with
The strong bullish breakout of
The falling resistance line all
Make us bullish biased. Which,
Combined with the strong
Fundamentals of the coin,
Being a cornerstone of the
Entire telegram network and
Its internal marketplace makes
Us expect a strong bullish
Move up with the targets
Being 7.2$(+31%) and 8.2$(+51%)
Respectively.
LONG🚀
✅Like and subscribe to never miss a new idea!✅

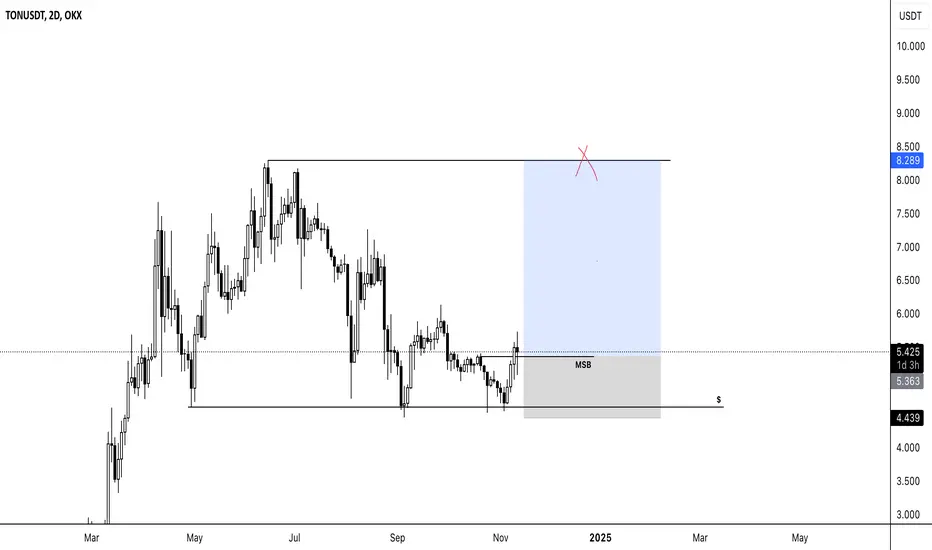
TON LONGThe 2-day chart of TONUSDT highlights a potential reversal setup after forming a market structure break (MSB) around the 5.36 USD level. Price is now showing signs of bullish momentum with a possible move toward the higher resistance zone.
Trade Plan:
- Entry: Current price level (~5.36 USD) or upon minor pullbacks if price holds above the MSB level.
- Target: 8.28 USD – aligns with a major resistance level and potential profit-taking area.
- Stop Loss: Below 4.43 USD, near recent support, to manage downside risk.
This trade setup aims to capture a continuation of the bullish structure in TONUSDT, with a favorable risk-to-reward ratio.
TON Long Spot Trade (Structure Shift & 21 EMA Reclaim) Market Context: TON has shifted its market structure, reclaiming the 21 EMA as support. This signals a potential upward move, providing a good entry point at current levels.
Trade Setup:
Entry: Enter a trade around $5.00
Take Profit Targets:
First target: $5.92
Second target: $6.84
Third target: $7.83
Stop Loss: Daily close below $4.50
This strategy aims to capitalize on the momentum shift, with tight risk management given the support level reclaim. #TON

TON/USDT: BREAKOUT ALERT! 100% PUMP INCOMING!!Hey everyone!
If you’re finding value in this analysis, don’t forget to hit that 👍 and follow for more updates!
TON Coin is flashing major potential! It's breaking out of a descending triangle on the daily timeframe and looks primed for a potential 100% surge. This could be an ideal time to buy on spot or consider a low-leverage long position.
Entry Range: $5.4 - $5.6
Target: 80 - 100% upside
Stop Loss: $4.9
Leverage: 2x - 3x
Fundamentals of TON Coin:
TON (The Open Network) originated from Telegram’s vision for a decentralized blockchain ecosystem. With its high-speed processing and innovative sharding technology, TON Coin aims to support a scalable and open financial platform. As institutional interest grows, so does its potential for future adoption.
TON Coin’s setup looks strongly bullish! What’s your perspective? Share your insights and analysis in the comments below!

TON Analysis / Do you think Paul can regain controls?OKX:TONUSDT
BINANCE:TONUSDT
CRYPTO:TONUSD
Analysis of the scenarios facing Ton Coin
▶The price has now entered the shock phase and It started a bearish rally from the Stop Hunt range.
If Ton downward movement considered as an excellent buying offers for investors, and the news of Pavel's arrest calms down in the next few hours, the price can touch the Stop Hunt level again.
Of course, this scenario is not at all suitable for trading and analysis, and it's just a hopeful prediction of the price.
📉🔍On the other scenario, the price downward rally is more accurate in my opinion. The news of the arrest is going to disturb the market for some time and this issue will gradually shift the price to lower support levels.
But what do we do?
⚡As I said before, TON price is worth much more than what it is, and it is quite possible to reach the $12 level within the next year. But in the current situation, finding profitable buying levels should be the most important goal of medium-term market traders.
In the above analysis, the PRZ level will provide an excellent buying zone.
Even in a hopeful scenario, the second best level to buy Ton is inside the yellow zone. Of course, I myself prepare a much smaller volume for buying in this area.
After the yellow level, until the price reaches PRZ, I will buy two more steps with the Bollinger Midline indicator or MA 50.
But the main zone for me is near the PRZ area.

TONUSDT - Weekly timeframeThis weekly analysis of the TON/USDT chart highlights a potential price movement scenario based on recent price actions and support/resistance zones. The chart shows that TON/USDT has encountered significant support around the 4.780 level, as indicated by the shaded grey zone. Price recently dipped into this support area before bouncing back, suggesting that buyers might be accumulating at this level. The projection indicates an anticipated rally, with the price likely moving up to test resistance levels around 6.134 and 6.883.
The blue line illustrates the expected path, with a slight retracement near the current price region (around 5.446) before a continued upward momentum. The analysis suggests that a breakout above 6.134 could confirm a stronger bullish trend, targeting the upper resistance at 6.883. This bullish outlook would likely depend on the price holding above the 4.780 support zone. Conversely, if the price fails to hold above this support, it could invalidate the projected upward movement.
This setup combines technical support and resistance levels, with the grey zones marking key areas of interest for potential entries and exits based on price action.

TON TON / USDT
Toncoin is trying to breakout the 6 months downtrend line, Sustained close above it open the doors for more highs soon
Best of wishes

Chart Analysis: TON/USDTThe chart provides a technical analysis of the cryptocurrency pair TON/USDT on a daily timeframe. Key elements include:
Price Action : Candlestick patterns illustrate the price movement of TON/USDT over time.
Trend Lines : Two descending orange trend lines indicate a downtrend.
Support and Resistance Zones :
A grey shaded area around the price level of 4.780, indicating a support zone.
Another grey shaded area around the price level of 6.883, indicating a resistance zone.
Projected Price Movement : Blue lines suggest potential future price movements, indicating a bullish scenario where the price could rise to around 6.883 and then potentially retrace before continuing upward.
Price Levels : Key price levels are marked with green horizontal lines at 4.780, 6.134, and 6.883.
Percentage Gain : A label shows a potential gain of 2.108 (44.14%) if the price moves from the current level to the resistance zone at 6.883.
This chart is valuable for traders and investors as it provides a visual representation of potential future price movements based on historical data and technical analysis. The use of trend lines, support and resistance zones, and projected price paths helps in making informed trading decisions.

TON's Situation: What Shall we Expect ??Now is the time for TON to grow. I don't know why, but TON reminds me of BNB in 2020 because we underestimated this coin a lot. As you know, this coin plays a key role in the Telegram messenger, which can gradually increase the value of this coin significantly.
Technically, TON is in a rising wedge, which can lead to an increase in price to the target shown in the chart after a breakout.
Give me some energy !!
✨We spend hours finding potential opportunities and writing useful ideas, we would be happy if you support us.
Best regards CobraVanguard.💚
_ _ _ _ __ _ _ _ _ _ _ _ _ _ _ _ _ _ _ _ _ _ _ _ _ _ _ _ _ _ _ _
✅Thank you, and for more ideas, hit ❤️Like❤️ and 🌟Follow🌟!
⚠️Things can change...
The markets are always changing and even with all these signals, the market changes tend to be strong and fast!!

Left Behind No More: TON Prepares to Join the Bull Market SurgeBINANCE:TONUSD has been lagging behind the broader market rally, showing little momentum while other assets have been catching fire in this early bull run. But TON’s underperformance may be setting it up for a parabolic move as it catches up with the rest of the pack. The key now is how it navigates a series of critical resistance levels that could pave the way for a strong breakout.
Chart Analysis
BINANCE:TONUSD faces a major trendline resistance overhead, which has kept its price action constrained. This trendline has acted as a ceiling, pushing TON back down each time it attempted a breakout. But the setup is starting to look primed for a potential breakout, especially if it clears the daily order block (OB) near $5.18.
Entry Levels
Aggressive Entry: For those looking to enter sooner, around $4.89 aligns with the first resistance level and a potential retest of the order block. This level might reject, but for those willing to take the risk, it provides an early entry point.
Safer Entry Level: Waiting for a daily close above $5.18 could offer a stronger entry. This would confirm a break above the daily OB, flipping it into support and creating a solid foundation for TON’s next leg up.
Clearing $5.18 with a solid daily close will signal that TON is ready to reclaim lost ground. From there, the next significant target is around $6.68, followed by an eventual test of $7.42. This range, once reached, could push TON into a more sustained uptrend, as it gains strength from the breaker block above, leading it to catch up with other assets in the bull market.
Target & Potential Path
If CRYPTO:TONUSD TON breaks these resistance levels and confirms the trendline breakout, it could trigger a chain reaction—one that propels it toward $8.36 and beyond. This level represents a long-term target and is the likely zone for profit-taking as TON aligns with the broader market’s bullish momentum.
The setup is there. Now it’s a matter of whether TON can seize the momentum and break out of its slumber.
--------
Follow me for more updates and chart insights! Remember to trade safely, keep risk management at the top of your game, and always trust your own analysis before making moves.
Cheers!

TONCOIN high potential and next targets (educational) Hello and greetings to all the crypto enthusiasts, ✌
🧨 summary: 🧨
Toncoin is gaining recognition in the crypto space, supported by a strong community and increasing adoption across platforms. Despite facing short-term challenges, its potential for explosive growth remains promising, especially if it can stabilize around key support levels. 📚💣
Toncoin is a cryptocurrency that has become increasingly well-known among active participants in the crypto space, establishing itself as a significant player in the market. It enjoys robust community support, which manifests through one of the largest and most engaged groups on social media platforms. This active community not only generates discussions around Toncoin but also plays a crucial role in its promotion and utilization. Various channels are continuously and dynamically used to advocate for the coin, making it an influential entity in the cryptocurrency ecosystem. 📚🔥
The widespread use of Toncoin across multiple platforms over the years has been instrumental in its rise to prominence. As more users and investors discover its unique features and capabilities, the adoption rate of this token is likely to increase, further enhancing its market presence. This growing awareness can lead to more substantial investment inflows, creating a positive feedback loop that fuels its growth. I firmly believe in the incredible potential of Toncoin and anticipate significant upward movement in its value in the near future. 📚✔
However, to better understand the current situation, we must analyze the technical aspects of Toncoin. The present technical chart suggests that the token is traversing a downward channel, indicating that the short-term price action may face challenges. The first key support level to watch closely is $4.50. This level is pivotal because if Toncoin cannot maintain its position above this threshold, we may see further declines in its value. Should the price break below this level, the next significant support area we would need to monitor is $2.80. This price point serves as a crucial buffer for the token’s stability and market sentiment. 📚🎇
If Toncoin does decline to the $2.80 level and fails to rebound quickly, it could lead to a prolonged bearish phase, which may discourage some investors. However, it’s important to recognize that the cryptocurrency market operates in cycles of accumulation and distribution. Often, after a price drop, savvy investors, particularly market whales and major stakeholders, look for opportunities to buy in at lower prices. This phenomenon can create a strong base for recovery, as these larger players accumulate tokens at attractive valuations. 📚💡
Once Toncoin reaches this critical support level of $2.80, we might witness a significant accumulation phase. The involvement of institutional investors and market whales can act as a catalyst for price recovery. These entities often have the resources and strategic insights to navigate the market effectively, and their participation can enhance overall market confidence in Toncoin. As these investors buy up tokens, they can create upward pressure on the price, leading to renewed interest from retail investors. 📚🙌
Historically, when cryptocurrencies experience substantial accumulation at key support levels, they often bounce back with remarkable intensity. This pattern can lead to explosive price movements, particularly when the market sentiment shifts in favor of the asset. Given Toncoin’s strong community backing, innovative use cases, and potential for real-world applications, it stands to reason that the coin could be poised for impressive growth in the coming months. 📚✨
Furthermore, the broader context of the cryptocurrency market plays a significant role in Toncoin's potential trajectory. As more investors seek diversification and exposure to emerging projects, Toncoin could benefit from the general market trends. Additionally, if other major cryptocurrencies experience positive price action, it often creates a favorable environment for altcoins like Toncoin to gain traction and attract new investors. 📚✌
Thank you for your attention. If you have any questions or comments, I’m here to respond to you. 🐋💡

SasanSeifi| TONCOIN:Is a Further Correction Coming?Hey there, ✌
🔹In the daily timeframe, analysing the KUCOIN:TONUSDT chart, reveals that the price has been on a downward trend since the $8 level. After breaking the crucial $6 support, this downtrend extended to around $4.80. Following this decline, the price saw a nearly 50% recovery and pulled back to $6, but then faced further correction to $4.50.
🔵Currently, with the price not stabilizing below the previous LOW, it has managed to grow at least 50% from the previous correction leg. The medium-term outlook remains generally bearish. If the price fails to break significant resistance levels between $6 and $6.50 and confirm a SELL signal while completing the pullback, further price correction towards $4 and potentially $3.50 might occur.
💢However, if resistance levels are broken and stabilize, the price may rise towards the $7.50 to $8 range. In this case, further analysis will be needed to determine if the previous high will be surpassed and whether the bullish trend will continue.❗❓
💢 Please remember that this is just my personal viewpoint and should not be taken as investment advice. I’d love to hear your thoughts and share opinions!
Happy trading!✌😎
Sure, if you have any more questions or need further clarification, feel free to ask. I'm here to help!✌

Be careful with TONCOIN !!!BINANCE:TONUSDT is forming a falling wedge on Daily timeframe , Up we go if we do breakout. the price can be bullish and I expect the price to go up to the Fibonacci line of 0.618 = $6 Stay tuned for more updates, thanks.
Give me some energy !!
✨We spend hours finding potential opportunities and writing useful ideas, we would be happy if you support us.
Best regards CobraVanguard.💚
_ _ _ _ __ _ _ _ _ _ _ _ _ _ _ _ _ _ _ _ _ _ _ _ _ _ _ _ _ _ _ _
✅Thank you, and for more ideas, hit ❤️Like❤️ and 🌟Follow🌟!
⚠️Things can change...
The markets are always changing and even with all these signals, the market changes tend to be strong and fast!!

TONUSDTTON ~ 1D
#TON You can pay attention to this Support Block. Maybe a small purchase on this support Block is very interesting with a target of 20%++

TONUSDT Potential up SwingTONUSDT is currently moving sideways, hovering just above the psychological level of 5.00 and consistently bouncing off this key level. The price action is forming an inverse head and shoulders pattern, which suggests a potential upward move toward higher levels. Additionally, the market is testing the downward trendline, and a breakout above this line could signal the start of a bullish trend. As long as the price remains above 5.00, the expectation is for a continued bullish move. The target is the resistance zone around 5.520

The Open Network (TON) & TelegramThe Open Network price today is $1.6 with a 24 hour trading volume of 10 million dollar. TON price is up 11% in the last 24 hours
Toncoin is a decentralized layer1 blockchain developed in 2018 by the encrypted messaging platform Telegram. The project was then abandoned, taken over by the TON Foundation, and renamed from "Telegram Open Network" to "The Open Network". The original idea was to integrate TON into an easy-to-use application that allows users to buy/send/store funds. Clients pay transaction fees and use TON to settle payments or validate transactions. Toncoin utilizes the PoS consensus model for network scalability and reliability.
Telegram users can now buy and sell short recognizable usernames for personal accounts, public groups and channels on fragment website and using TONcoin for doing payments
If you got it at 1$ like me its time to take some profits
1.7 , 1.9 and 2.1 are next targets

TON: rally to $6 begins?While TON’s price might have fallen below $5, IntoTheBlock data shows that the token’s Coins Holding Time has increased. Within the last seven days, this metric, which measures the amount of time a cryptocurrency has been held without being sold, is up 142%
Since it increased, it indicates that Toncoin short-term holders believe that a rebound could be close.
From the technical point of view, Toncoin is witnessing a massive rise in the Money Flow.
A continued rise in buying pressure might drive Toncoin’s price up to $6.15.
However, if Toncoin short-term holders opt to sell some assets, this upward trajectory could be disrupted, potentially causing the price to slide back to $4.46.

TON Toncoin potential SelloffTelegram CEO Pavel Durov has been charged for failing to prevent extremist and illegal content on the messaging platform and placed under judicial supervision, according to the Paris prosecutor's office on August 28.
Durov must report to the police twice a week and is barred from leaving France, the prosecutor's office stated on X.
Parisian investigative judges have also ordered the Russian-born Telegram co-founder to post 5 million euros in bail.
Meanwhile, TON Toncoin is currently in a bearish falling wedge pattern, with a new price target of $3.9.

TON ANALYSIS📊 #TON Analysis
✅There is a formation of Descending Channel Pattern in daily timeframe.
Currently #TON is trading around its major support zone. We could see a good pullback now.
👀Current Price: $4.916
🚀 Target Price: $5.900
⚡️What to do ?
👀Keep an eye on #TON price action and volume. We can trade according to the chart and make some profits⚡️⚡️
#TON #Cryptocurrency #Breakout #TechnicalAnalysis #DYOR
