TONUSDT Breaks Out of Bearish Grip! Is a Bullish Rally?🔎 1. Key Pattern: Descending Trendline Breakout + Reaccumulation Zone
After months of downward pressure, TONUSDT has successfully broken above a dominant descending trendline that has been acting as resistance since December 2024.
✅ This breakout occurred with a strong bullish candle and aligns perfectly with a significant historical resistance zone (around $3.00–$3.12).
📌 The area also overlaps with the Fibonacci retracement levels (0.5–0.618) — a zone where trend reversals often occur.
This indicates that the move isn't just noise — it might be the start of a mid-term bullish trend.
---
🧱 2. Consolidation Box = Reaccumulation Zone
TONUSDT spent nearly 4 months ranging sideways between $2.80 and $3.20, forming a clear reaccumulation range.
🔁 This kind of price action often precedes a strong breakout, as smart money accumulates before the next leg up.
🟨 This box now acts as a critical demand/support zone for any potential pullbacks.
---
📏 3. Key Levels to Watch (Support & Resistance)
✅ Bullish Targets (Resistance Levels):
🔹 $3.5404 → Immediate resistance
🔹 $4.0492 → Major resistance to break
🔹 $4.6460
🔹 $5.1961
🔹 $5.9429
🔹 $6.9065
🔹 Local High: $7.2311
🔻 Support Levels:
🔸 $3.1248 – $3.0099 → Key Fibonacci support (0.5–0.618)
🔸 $2.8000 → Bottom of reaccumulation range
🔸 $2.3290 → Major support (also the cycle low)
---
📈 Bullish Scenario (Primary Bias)
If price holds above the key zone at $3.00–$3.12, we could see:
A move towards $3.54 USDT
Breakout above $3.54 opens the door to $4.05 → $4.64 → $5.19 and beyond
A clear structure of higher highs and higher lows confirms trend reversal
Momentum remains strong as long as price respects the breakout zone.
---
📉 Bearish Scenario (Alternative Case to Watch)
If price fails to hold above $3.00 and breaks back below $2.80:
This would suggest a false breakout
Momentum may shift bearish again
Price could revisit the $2.32 support, negating the bullish setup
A return to sideways or even downtrend structure is possible
---
🧩 Strategic Conclusion
TONUSDT has broken out of a key descending trendline and reclaimed a strong structural zone, indicating early signs of a bullish cycle.
📊 Key Levels to Monitor Closely:
Support (validation zone): $3.00–$3.12
Immediate resistance: $3.54
Mid-term targets: $4.05 → $5.19 and higher
> As long as TON stays above the golden zone (Fibonacci 0.5–0.618), bulls have the upper hand.
---
📘 Pro Tips for Traders:
Watch for volume confirmation during retests
Be patient for pullback entries or breakout confirmations
Manage risk — don’t FOMO blindly
#TONUSDT #TONCOIN #CryptoBreakout #AltcoinAnalysis #TechnicalAnalysis #CryptoTrading #TON #Reaccumulation #BreakoutSetup #FibonacciSupport #BullishReversal #TONBullish
Tonusdtsignals

Ton USDT Buy Setup / Long SetupTon entry at current market price 3.305 , SL if 1 day closes below the mentioned zone. Otherwise holding ton for breakout towards 4-4.5$. use low risk amount as BTC can retrace.

Ton USDT Intraday Setup / Long SetupTake with tight SL, an easy 2RR, take it at cmp (Current Market Price), While if you holding spot bag, it can easily hit 4.5-5$ mark in this week. Best Of Luck
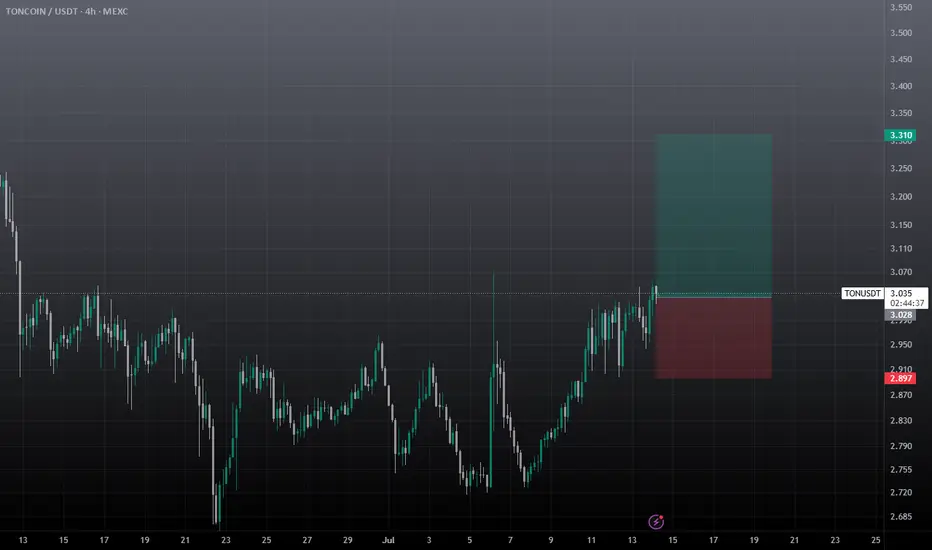
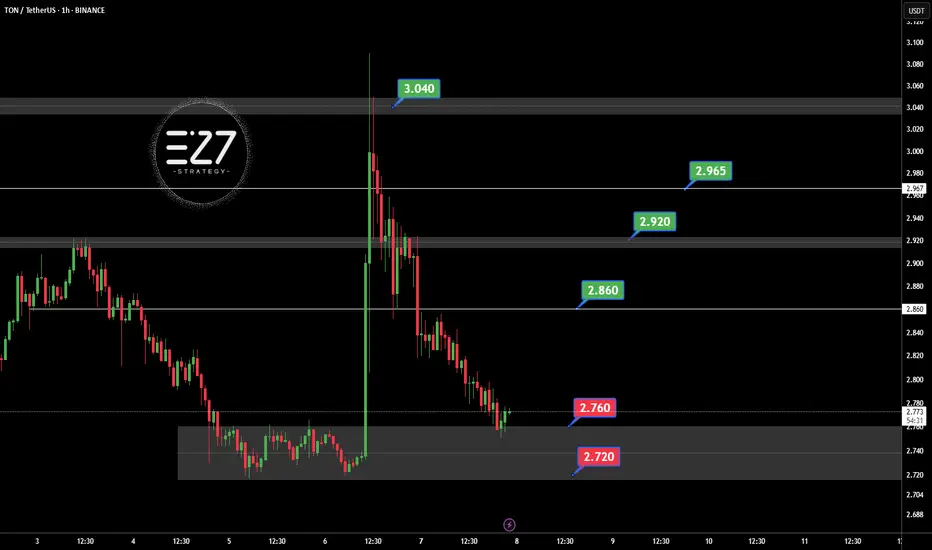
TONUSDT Following the official denial by UAE authorities regarding the possibility of obtaining a golden visa through staking OKX:TONUSDT , the bullish momentum driven by that rumor has faded. Selling pressure has increased, and TON is now consolidating within the key support zone of 2.720 to 2.760 USDT. If this support breaks, further downside is likely. However, if the price holds and reclaims the 2.860 USDT resistance, it could trigger a recovery toward 2.920 and 2.965 USDT. For now, the market sentiment remains bearish with a corrective bias.
Key Points:
UAE officially denied TON-based golden visa claims, weakening sentiment.
Current support zone: 2.720–2.760 USDT.
Key resistance: 2.860 USDT, then 2.920 USDT.
Break below 2.720 = further decline.
Break above 2.860 = potential bullish reversal.
⚠️ Please Control Risk Management in trades.
Did you hit a TON?TON yesterday moved due to a golden visa news - That said after the news came of UAE denying golden visa claim it fell, That move was not for that I guess, See the pas of it, If market stays like that, you would see it touch the springs!

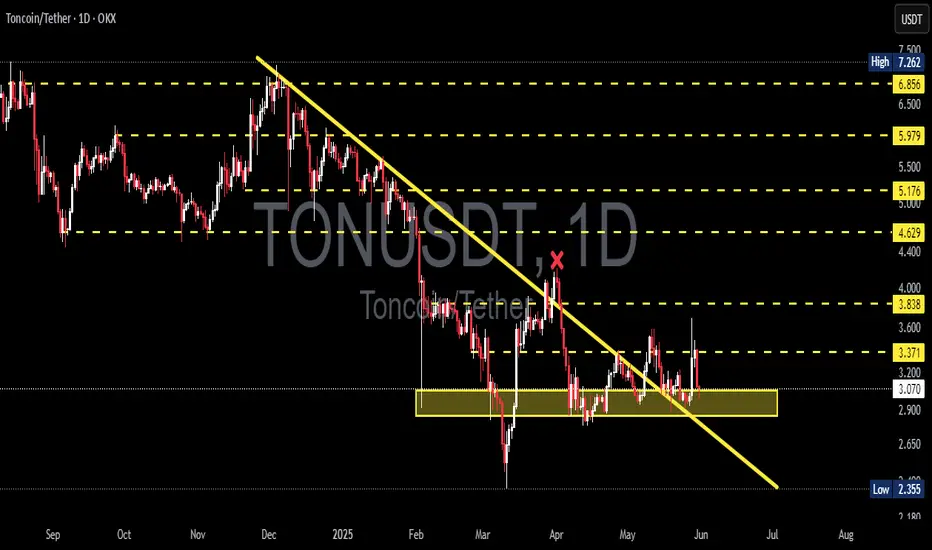
TONCOIN Preparing for Liftoff from the Golden Zone! Potential UpDetailed Breakdown:
🔶 Major Support Zone (Golden Accumulation Area):
TON is currently trading within a strong support zone between 2.839 - 2.300, which previously acted as a key resistance throughout 2023. This zone now serves as a high-probability accumulation area.
🔶 Double Bottom Structure & Reversal Potential:
The price action is forming a potential double bottom pattern, often signaling a major reversal after a prolonged downtrend. This is also supported by sideways consolidation on the support with decreasing selling momentum.
🔶 Bullish Targets (Based on Fibonacci & Historical Resistance):
If a bounce occurs from this golden support area, TON could rally towards the following key resistance levels:
🎯 Target 1: 3.247
🎯 Target 2: 4.087
🎯 Target 3: 4.798
🎯 Target 4: 5.879
🎯 Target 5: 6.865
🎯 Target 6: 7.932
🎯 Ultimate Target (ATH): 8.283
🔶 Maximum Potential Upside:
From the current level (around 2.839) to the all-time high (8.283), TON presents a +190% upside opportunity in a full bullish scenario.
Trading Strategy:
✅ Buy Zone: Accumulate within the golden support box (2.3 - 2.8 USDT)
🔁 Additional Entry: Upon breakout confirmation above 3.25 USDT
❌ Stop Loss: Below 2.2 USDT with strong bearish volume
📈 Take Profit Levels: Use resistance levels as partial TP targets
Conclusion:
TONCOIN is positioned at a technically significant support area, offering a high-risk-reward opportunity for swing traders and mid-term investors. A bullish reaction from this zone could initiate a strong multi-wave rally. Watch for breakout confirmation with volume before entering aggressively.
#TON #TONCOIN #CryptoBreakout #AltcoinSetup #TONUSDT #SwingTrade #BullishPattern #CryptoSignals #FibonacciLevels #TechnicalAnalysis

TONUSDT On the @TONUSDT chart, price is currently making a corrective move after reacting to the key support at 2.800. It may rise toward the 3.230 resistance and potentially break higher with a pullback to continue upward. However, if the 2.800 support fails, a deeper drop could follow. ⚠️📉
Resistances:
• 3.230 💥
• 3.371 🔼
• 3.656 🔼
• 3.948 🚀
Supports:
• 2.910 🛡️
• 2.800 🔻
⚠️Contorl Risk management for trades.

TONUSDT 1D AnalysisTON ~ 1D Analysis
#TON Buy back gradually from here with a short term target of at least 15%+, Long term target $8
TONCOINCRYPTOCAP:TON In the 4-hour timeframe, key support and resistance zones have been identified based on significant highs and lows. The primary resistance area is at $4.070, while the main support level is at $2.860. A descending trendline has been drawn, and the price trading below the 200-period moving average suggests continued bearish momentum in this time horizon. However, if the near-term resistance at $3.590 is broken, a potential upward movement towards the primary resistance at $4.070 could occur. Conversely, a break below the immediate support at $3.000 might lead to a price decrease towards the main support level at $2.860. To confirm bullish or bearish scenarios, monitoring for valid breakouts of these levels along with volume analysis and other technical tools is essential.

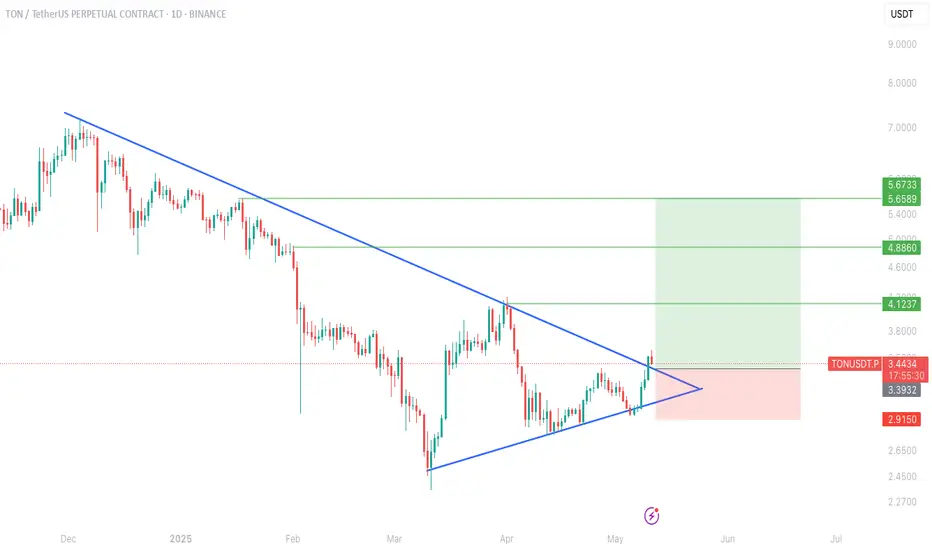
TON breakout alert!!CRYPTOCAP:TON chart Update!
TON has officially broken out of a multi-month symmetrical triangle on the daily chart, signaling a potential trend reversal after a long downtrend.
📈 Clean breakout above descending resistance
🔼 Entry triggered around $3.44
🎯 Targets ahead:
TP1: $4.12
TP2: $4.88
TP3: $5.67
As long as the price stays above the breakout zone, bulls are in control. A successful retest could offer another great entry!
If you find this analysis helpful, please hit the like button to support my content! Share your thoughts in the comments, and feel free to request any specific chart analysis you’d like to see.
Happy Trading!!
TONUSDT 1D AnalysisTON ~ 1D Analysis
#TON Buy after successfully breaking this resistance line with a short term target of at least 15%+ from here.

TON Long???📈 Price Action Overview:
Asset: USDT Pair (Exact asset not specified, assuming it's a crypto token)
Current Price: ~$2.99
Previous High: ~$4.08
Swing Low: ~$2.36
🔍 Chart Patterns & Structure:
Rising Wedge (Bearish Breakdown)
Formed after the impulsive rally from $2.36 to $4.08.
Price broke down from the wedge, confirming bearish sentiment and starting a corrective phase.
Descending Triangle / Falling Wedge (Potential Reversal)
Price consolidating around the $2.8 - $3.0 region.
A slight bullish divergence seen (explained in RSI section).
🔢 Fibonacci Retracement Levels:
Drawn from swing low ($2.36) to swing high ($4.08):
0.236: $3.58
0.382: $3.31
0.5: $3.10
0.786: $2.65
1.0: $2.36 (full retracement)
Currently trading between 0.786 and 0.5 Fib zones, in a key support area.
🟣 Support & Resistance Zones:
Major Resistance:
$4.08 (swing high)
$3.58 - $3.60 (Fib 0.236)
Current Resistance:
$3.10 (Fib 0.5)
$3.31 (Fib 0.382)
Support Zone (highlighted purple):
$2.80 (horizontal support)
$2.65 (Fib 0.786)
$2.36 (previous low)
📊 RSI (Relative Strength Index):
Current RSI: 49.16 (Neutral zone)
Key Observation:
Bullish Divergence: RSI made higher lows while price made lower lows around April 7–12.
Trendline Support on RSI: An ascending trendline suggests building bullish momentum.
May hint at a short-term reversal or bounce.
🔮 Potential Scenarios:
Bullish Case:
Bounce from $2.8-$2.9 support area.
Break above $3.10 = likely push to $3.31 or higher.
RSI breaking above 50 would confirm bullish momentum.
Bearish Case:
Failure to hold above $2.80 support.
Breakdown toward $2.65 or even $2.36 (swing low).
RSI dipping below the rising trendline = loss of bullish strength.
✅ Conclusion:
Currently in a critical demand zone.
Early signs of a bullish reversal forming (thanks to RSI divergence).
If buyers hold $2.80 and push past $3.10, a short-term uptrend is likely.
Watch volume + RSI for confirmation.

TONUSDT 3DTON ~ 3D Analysis
#TON Buy back when testing this support with a short -term target of at least 20%+.

TON USDT Buy Setup 1. Price Action and Trend Analysis
• Current Price and Movement: The current price of TONUSDT is 3.2440, down by 2.72% (as shown in the header). The chart shows a recent decline from a high of around 3.58777 (marked on the chart).
• Trend: The price appears to be in a downtrend after hitting a peak. However, the chart also shows a potential ascending triangle pattern (a bullish continuation pattern) with higher lows forming around the 2.35877 and 2.65256 levels and a resistance zone between 3.1010 and 3.24439 (highlighted in purple).
• Key Levels:
• Support: Around 2.35877 to 2.65256 (previous lows and the lower trendline of the ascending triangle).
• Resistance: The purple zone between 3.1010 and 3.24439, which the price is currently testing.
• Recent High: 3.58777 (a potential target if the price breaks above resistance).
• Recent Low: 2.35877 (a critical support level if the price continues to decline).
2. Volume Analysis
• The chart includes volume bars at the bottom, but they are not explicitly labeled. Generally, in a pattern like an ascending triangle, you’d want to see increasing volume on upward moves (indicating buying pressure) and decreasing volume on pullbacks (indicating lack of selling pressure). From the chart, volume appears relatively stable, with no significant spikes, suggesting a lack of strong momentum in either direction at the moment.
3. Indicators
• Relative Strength Index (RSI): The RSI is shown in the lower panel, currently at 41.01.
• RSI below 50 indicates bearish momentum, but it’s not yet in oversold territory (below 30). This suggests the price could still decline further before a potential reversal.
• The RSI has been trending downward recently, aligning with the price decline from the 3.58777 high.
4. Pattern Analysis: Ascending Triangle
• The chart shows an ascending triangle pattern, which is typically a bullish continuation pattern:
• Higher Lows: The price has formed higher lows at 2.35877, 2.65256, and 2.80841, indicating buyers stepping in at higher levels.
• Flat Resistance: The price has repeatedly tested the resistance zone around 3.1010 to 3.24439 but failed to break above it decisively.
• Implication: If the price breaks above the 3.24439 resistance with strong volume, it could target the recent high of 3.58777 or higher. The potential target for an ascending triangle breakout is often calculated by measuring the height of the triangle (from the base to the top) and projecting it upward from the breakout point:
• Height of triangle: Approximately 3.24439 - 2.35877 = 0.88562.
• Potential target if breakout occurs: 3.24439 + 0.88562 ≈ 4.13001.
5. Liquidity Levels
• The chart marks liquidity levels with numbers in parentheses, such as (3.58777), (2.80841), etc. These likely represent stop-loss or take-profit levels where liquidity might be clustered:
• Above the current price (e.g., 3.58777), there may be sell-stop orders or take-profit levels from short positions.
• Below the current price (e.g., 2.35877), there may be buy-stop orders or stop-loss levels from long positions.
• The price often moves toward these liquidity zones to “hunt” stops before reversing, so a drop below 3.1010 could target the 2.80841 or 2.65256 levels.

TONUSDT BuyTON Buy signal on H4 chart. Daily trend is strong enough to push price higher. Risk reward 1/5

Is a TON Pump Coming?Is a TON Pump Coming? 🚀
TON, the blockchain developed by Telegram’s team, has gained significant attention due to its low transaction fees and strong connection with Telegram. Recent increases in liquidity and demand indicate growing investor interest in this cryptocurrency.
🔹 Technical Analysis:
TON is currently in a short-term uptrend, with $4 acting as a key resistance level. A confirmed breakout above this level could push the price towards $7. However, failure to break this resistance may lead to a price correction toward lower support levels.
🔹 Potential Risks:
A significant portion of TON tokens is held by whales, which could lead to high volatility. Additionally, its unlimited supply poses long-term inflation risks if not managed properly.
🔹 Growth Catalysts:
Recent positive news, such as Telegram’s potential partnership with AI (Grok) and the release of key updates, could drive further demand. If TON sustains its momentum and breaks key resistance levels, it may enter a stronger bullish phase.
📌 Conclusion:
While TON has strong fundamentals and market interest, its long-term stability depends on supply management and investor behavior. Entry at key levels with proper risk management is essential for those looking to trade or invest. 🚀

TONUSDT TONUSDT Signal 🚀
🔹 Entry: Wait for a complete pullback (Confirm support) 3.154
🔹 Targets:
🎯 3.489 (First resistance)
🎯 3.869 (Key breakout level)
🎯 4.478 (Major resistance)
🎯 4.731 (Final target)
🔹 Stop Loss: 2.731 (Below key support)
🔹 Risk Management: Control your risk before entering

TONUSDT 3DTON ~ 3D Analysis
#TON Support blocks that you might be able to consider to start buying again from here, with a short -term target of at least 15%+.

TONUSDT 2DTON ~ 2D Analysis
#TON Buy gradually from here. This is a very good buy place for now. With a short -term target of at least 15%+.

TON at a very bottomAfter the rejection from the descending triangle we had, now $3 is going to be the last/strong support and I'm expecting another push to about $19 in next few weeks or months

#TON/USDT Ready to go higher#TON
The price is moving in a descending channel on the 1-hour frame and sticking to it well
We have a bounce from the lower limit of the descending channel, this support is at 5.10
We have a downtrend on the RSI indicator that is about to break, which supports the rise
We have a trend to stabilize above the moving average 100
Entry price 5.13
First target 5.27
Second target 5.40
Third target 5.58

TONUSDT 3DTON ~ 3D
#TON If you still have Conviction on this coin,. buy gradually within this support block with a target of at least 20%+

35% TON PumpSignal:
📥 Entry Point: Between 4.950 and 5.180
🔴 Stop Loss: 4.650
📈 Targets:
5.642
6.006
6.342
6.750
Overall Trend Analysis:
📉 Current Trend: Bearish with a potential reversal from the buy zone.
🟡 Moving Average (MA): Price is below the MA, indicating selling pressure continues.
📊 Note: If the price stabilizes in the buy zone, there’s a high probability of reaching the mentioned targets.
⚠️ Warning: If the stop loss is breached, the bearish trend may strengthen, invalidating the setup.
