Bullish top down analysis Smart Money Price On daily Order block waiting For peak information in h1 or 3 bar price pattern
Topdownanaylisis

Bearish top down analysis Smart Moneyhare a very interesting situation , price look beautiful daily barker block but in h1 price make a only push 1 and bounce 50 50 . but looking 200 ema price consolidate and may make new peak level . entry will m15 chart for many patterns

EURUSD - top down analysis Monthly Weekly Daily
Monthly - a long-term channel set in motion in the 2008 crisis now appears to break up. EURUSD traded in its upper part for some time, then, this year, it moved outside and started to consolidate there. There is a potential resistance above 1.22000 which played some role in the past and seems to be respected again.
Conclusion: bullish - traded in the upper part of the value channel for a long time and broke up
Weekly - zooming in on the consolidation after a breakout, the price action appears to be neutral. The price has failed to make a new high (purple circles) but hasn't broken any previous lows yet. EURUSD balances in both upper and lower parts of the value channel equally. Lastly, there is a pin bar with a high volume. This is a clue that the reversal and bullish action are slightly more likely to take place.
Conclusion: neutral - could be very narrowly bullish, but the price has gone furthest outside of the channel since its formation and the reversal sign, the pin bar, has not had any follow-up yet.
Daily - looking at the potential breakout of a new channel, there appear to be several bullish signs. A few pins and a relatively big green bar running on an overwhelming volume. One thing is missing and that is a follow-up or rather lack of it. There is some buying, but the resolve to take the price higher is missing.
Also, look at the purple area. There is a complete absence of any market structure. If the market moves to the upside, it should deliver the price to the top of the area.
Conclusion: somewhat bullish - I will wait for a valid sign to enter the market. It has the potential to turn to the upside. We will be wiser aster Thursday as many events are scheduled then. Either way, from a risk-reward perspective, this is clearly a long opportunity.

CADJPY - top down analysis Monthly, Weekly, Daily
The monthly timeframe reveals a triangle with a downwards Shifting Point of Control (SPOC). The price spends most of the time below SPOC. There is only one pro-longed oscillation above the level which later found resistance at the round number of 100 it failed to hold.
The most recent price action shows a rejection of above-90 levels as sellers took advantage of this price and started pushing CADJPY lower.
March 2020 candle stands out on the volume indicator. The candle itself is smaller than on other pairs. Perhaps, its, because the price was nearing bottom levels, and some investors stayed strong through a stock crash. Should there be another correction on the stock market, CADJPY is likely to go down as it did in the 2008 crisis, from which the pair never recovered. On the other hand, the down candle clearly violates Wyckoff's law of effort vs. result, and to interpret it properly, I will inspect a lower timeframe.
Zooming in on the latest red candles, the weekly chart has all the details. The price attempted to make another higher high after it retraced lower and failed. A lower high was formed instead. Then, the price continued below the support and should create our first lower low at some point. Then, it might or might not retrace back to the structure around 88 which would be my entry if I decided to trade based on this timeframe.
Notice the volume of March 2020 candles. This brings a lot more clarity to the massive volume. Even though there was a lot of selling at a time, buyers were stalwart-strong and did not let the pair go lower. A takeaway from this is that although stock market drops will increase the selling activity on CADJPY, it probably isn't the best pair to speculate on during the crisis, because there are many willing to defend it.
Look right and see the red "M". This is my note table. I created a red "M" to remember that the Monthly timeframe looks bearish. As we move towards daily, a gray "W" will appear on the chart. The weekly timeframe is bearish, but a retracement to the structure around 88 is expected. On top of that, selling now would be chasing the price and that is wrong!
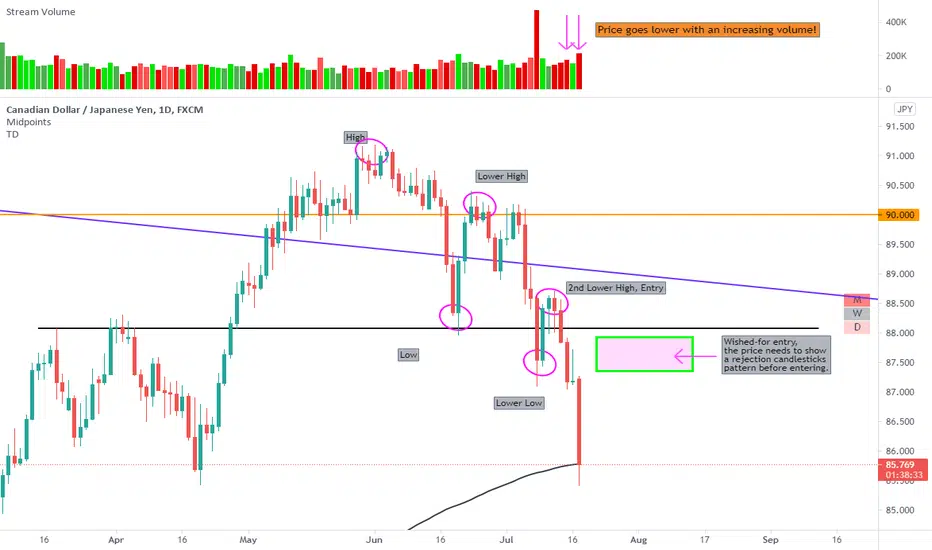
The daily chart brings bad news as it shows that the would-be weekly entry level has already been retested. That was the best possible entry in advance of the coming downtrend. I missed it myself. The best we can hope for is that the price comes back closer to the second Lower High. The entry does not have to be perfect - a monthly chart is on our side too. But it definitely has to be good. Not bad, not slightly bad. It needs to be good!
The volume-based analysis involves one high-volume candle which definitely violates Wyckoff's effort-result law. The price movement isn't as big as it should be based on consumed volume. However, I think the volume supports my analysis later and the most recent price action is always the most relevant, also.
Look at the 5 last days. With the exception of Friday, the volume has increased every day and the price movement to the downside increased as well. This means that new bears are entering the arena and the trend has just started. If there is a retracement (and an entry opportunity), it shouldn't beat the biggest red candles volume-wise - but that is up to future analysis.
Keep in mind that the price hit 200 daily Exponential Moving Average today. That could lead to an opportunity.
"D" on the chart will be slightly red. I expect more selling, but the price has already dropped a lot, and it is on 200 EMA. It may retrace this week.
Potential entry
I left the purple area on the chart. That's an entry I would like to take if the price gets back up. A candlestick reversal formation needs to appear before entering short. Pinbar, engulfing or even three-bar rejections are ok.
nzdcad longs! (Entry given) Topdown analysis!Hey traders, here is my analysis for NZDCAD, nice daily swing trade lining up in the coming days.. Let me know your thoughts below

MULTIPLE TIMEFRAME ANALYSIS/TOPDOWN ANALYSIS
What is multiple timeframe analysis?
What is a top-down analysis?
Most technical traders in the financial markets(crypto, forex, etc) whether they are novices or seasoned pros, have come across the concept of multiple timeframe analyses in their educations.
However, multiple timeframe analysis is often the first level of analysis to be forgotten when a trader pursues an edge over the market.
Multiple timeframe analysis involves monitoring the same currency/crypto pair across different timeframes.
While there is no real limit as to how many timeframes can be monitored, or which ones to choose, there are general guidelines that we should follow as a trader. Using three different timeframes gives a broader view of any market.
Using fewer than this can result in a considerable loss of data while using more typically provides redundant analysis and
indecision. When choosing the three timeframes, a simple method can be followed. this rule has been developed and shared among our students, be it day traders, swing trader, or position trader the rule is applied to help the trader pick his/her best timeframe for top-down analysis

bullish idea Wyckoff + ICTit's clear bullish market structure, weekly monthly daily &h4 is in same line so waiting for retracement in h4 .


CHECK THIS USDJPY SHORT!!!4HR is presenting a nice double top formation, moving through to the 1hr we can see a triple test of resistance on the second leg of the double top. moving further to the 15min we are testing resistance for the third time on the second leg, all pointing to bearish confirmation.
We have 2 trades to consider here first is top-down, second is a bigger play on the larger timeframe.

EURUSD Market OverviewUSD selling pressure has been seen this week, due to the most recent weekly jobless claims falling to a less than expected figure.
US T-Bonds gave the US Dollar Index some small gains.
The Euro Commission revealed that the Eurozone growth forecast for 2021 fell to 3.8% from 4.2% Not so good right?! The economy is looking weaker and it doesn't help that Euro Central Bank Policy Maker, Mr. Makhlouf acknowledges the weakened economic growth of Europe.
Its clearly mixed data here for EURUSD, and I personally don't plan to trade EURUSD as of now. There is strong resistance shown on the 4H Timeframe and until price can break and retest this structure, I wont be looking to Long the pair.
But why long? Check out my analysis, the Monthly and Weekly are showing a Bullish setup. As a result, I am waiting for the Daily and 4H to align with my anticipated move to the upside; I'll be waiting for a shift in market tone.

NZDJPY - Ready to SHORTEntry break of trendline with stops above the high.
Aiming for the major trendline
Confirmation:
- MACD divergence
- Wedge resistance

bearish top down analysis AUD is strong next weak so i am interested to selling this pair because of its take both side of liquidity and trap the trader of both buyer and seller..


Bearish top down analysis in monthly, price on bearish order block .now in monthly hummer candle appear ,,

Bearish top down analysis clearly seeing Drop base Drop price action so waiting for OTE or 3 push pattern.. entry should be in lower time frame with many confluence

EU Short----------Hello Traders!-----------------
EU its looking bearish in my opinion my TP level its the fibonacci level and we need to break the lows and the structures we are going to have many pullbacks because of the daily minor structure that its forming but EU its looking the best to trade right now.
Hope you enjoyed and we will see what happens.

Bullish top down analysis Smart Moneyprice was in compression so looking for both baying and selling ..but best is looking for buying because of monthly weekly or bullish entry must be in LTF

EURUSD DAILY OUTLOOK EURUSD daily outlook :
price made new low and gave us a nice sell entry on ltf..
my long term target for EURUSD will be 1.16141
will post ltf analysis so make sure to check it out!


Bearish top down analysis Smart Moneyin monthly price want to seek sell side .now monthly weakly ,daily and h4 bearish..so looking for short,


EURUSD on the path to test 1.22#EURUSD:
(1D):
As expected from last week's analysis, EU came all the way back to support around 1.205 to bend to the upside once again, following the overall bullish direction. We are about to see 1.22 resistance being tested, where I will be looking for a bullish opportunity once broken to the upside.
(4H):
On the lower timeframe, we have more detailed information above the retracing leg down on 1D. Namely a falling wedge, eventually broken and retested.
(1H):
Price action has been quite choppy as of late. For this reason, i will be waiting for a bullish bullish continuation setup once across next resistance, aiming for the 4H wedge top. If developing on a larger scale, i will be interested to see 1.24 as next target.
