$GU (GBPUSD) 4HGBPUSD is forming a potential reversal structure with liquidity resting above and below the current range.
We expect a move to grab short-term liquidity above 1.3475 followed by a sweep of lows near 1.3369.
This would complete a rounded bottom structure, setting the stage for a bullish reversal.
Once the low is swept and buyers step in, the target sits around the 1.3600 handle.
Topgbanks

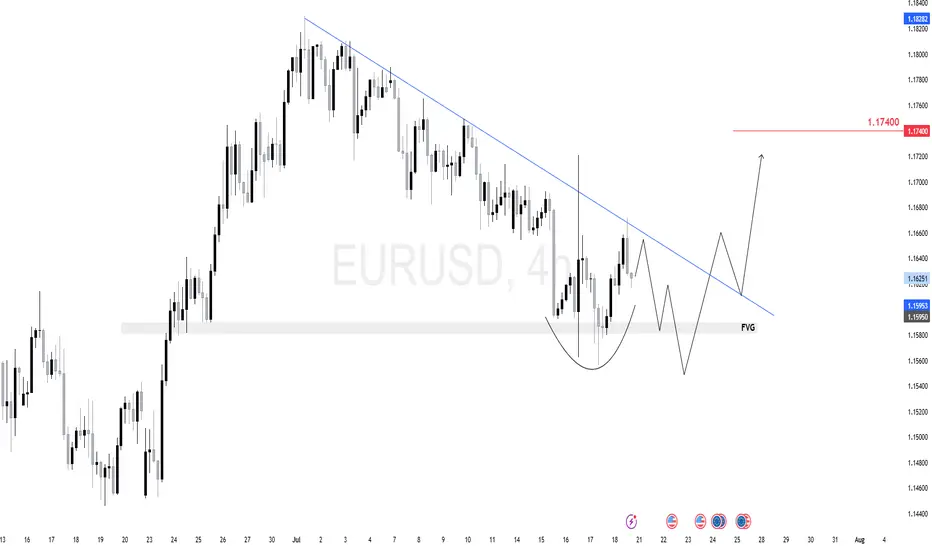
$EU (EURUSD) 4HEURUSD is forming a potential inverse head-and-shoulders just above a 4H fair value gap (FVG).
We expect one more dip toward the 1.1580–1.1595 zone to complete the right shoulder and tap demand.
From there, a breakout above the descending trendline can target 1.1740 next.
The key here is watching the reaction after the FVG test — if buyers step in strong, we ride it up.
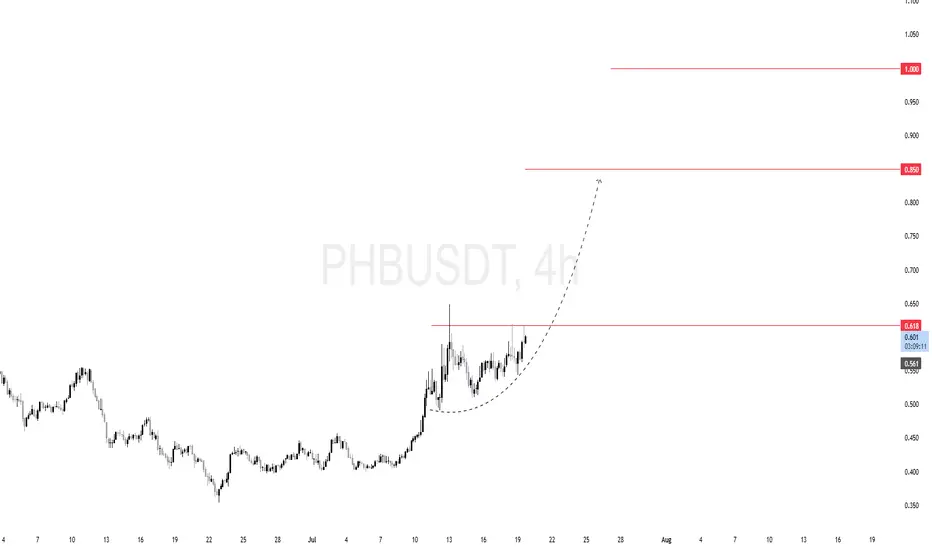
$PHB (PHBUSDT) 4HPrice spent several sessions consolidating below the $0.618 resistance zone. This horizontal level has been tested multiple times, building up buy-side liquidity above it.
We're seeing a rounded base formation — a classic bullish continuation pattern. It signals strong demand and positioning by smart money.
If $0.618 gets cleared with volume, we can anticipate rapid upside movement with the following key targets:
🎯 First target: $0.85
🎯 Final target: $1.00 (psychological level and historical supply)
$GJ (GBPJPY) 1HPrice is currently forming a descending triangle pattern, with clear lower highs and a horizontal support zone.
Trendline resistance is actively being respected.
Liquidity is likely building below the horizontal support zone.
A false breakout or sweep above the trendline followed by rejection could trigger institutional distribution.
As long as the descending trendline holds, and no bullish BOS occurs, the structure remains bearish. Look for price to accumulate short positions before expansion.

$EJ (EURJPY) 1HPrice has been in an overall bullish structure, forming higher highs and higher lows.
Price tapped into a premium zone, showing signs of exhaustion.
After the liquidity run, we saw a rejection from the top, followed by a shift in structure.
A bearish FVG has formed, and price has now retraced back into it, offering a potential sell opportunity.
As long as price holds below the high and inside the premium FVG zone, bearish bias is valid. Any break above the recent high would invalidate this setup.

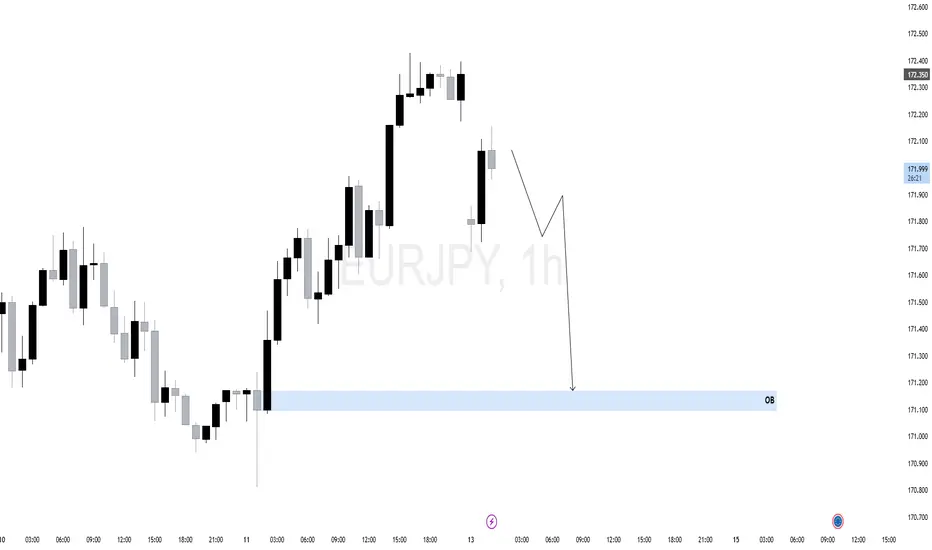
$EJ (EURJPY) 1HEURJPY recently showed a strong bullish rally off a key 1H Order Block (OB) near 171.200. This rally swept sell-side liquidity before shifting short-term structure.
However, current price action shows signs of weakness — multiple rejection wicks near 172.350 and a potential shift in momentum.
The corrective structure forming suggests the bullish move may have been a liquidity run. A clean lower high may confirm bearish intent.
As long as price remains below the recent swing high, we anticipate a short-term retracement toward the OB zone (171.200), which aligns with an area of unfilled orders and possible rebalancing.
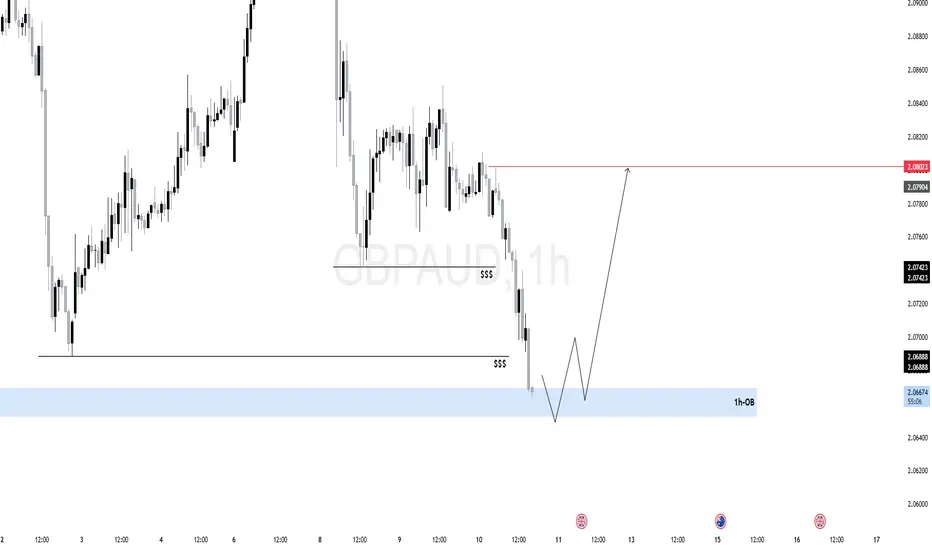
$GA (GBPAUD) 1HIf price holds and reacts from the OB, expect a short-term bullish leg toward:
Internal liquidity first (2.07400), Then external buy-side liquidity above 2.08000.
Price has been in a clear bearish structure, printing lower highs and lower lows.
Recently, price swept multiple layers of internal liquidity (marked as $$$) before tapping into a key Order Block (OB) just above the 2.06500 zone.
The OB zone aligns with a higher timeframe demand area, suggesting this could be a reaccumulation phase.
The OB zone has previously led to strong expansions, making it a valid area for institutional re-entry.
The current liquidity grab beneath the previous lows appears intentional — a trap for breakout sellers.
Smart money often waits for such sweeps to absorb sell-side liquidity before shifting the structure.
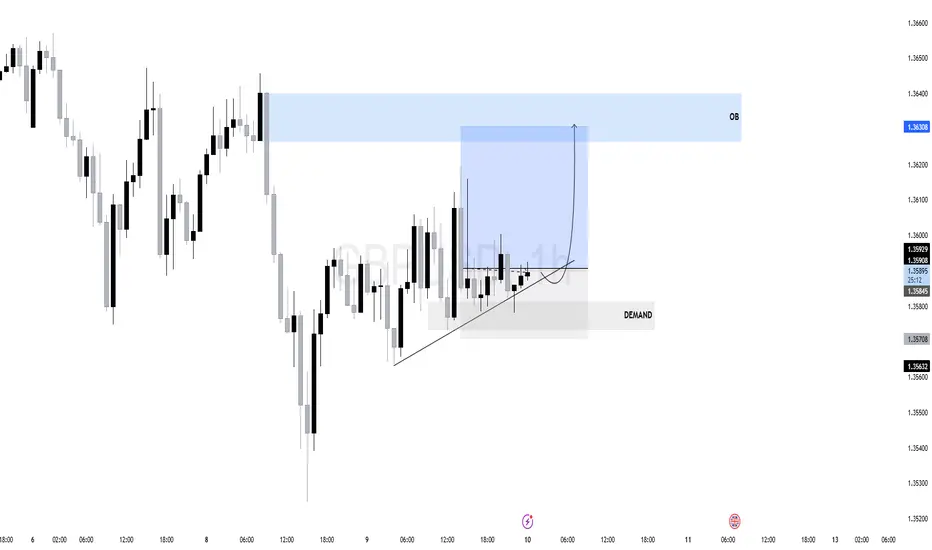
$GU (GBPUSD) 1HPrice has been consolidating after a previous sell-off and is now showing signs of accumulation above a defined demand zone (1.35600–1.35800).
The price has respected the ascending internal trendline, forming higher lows — an early sign of bullish intent.
Strong bullish rejection from this area confirms interest from smart money. Price tested it and immediately rebounded, signaling absorption of sell-side liquidity.
The internal ascending trendline continues to act as dynamic support. As long as price respects this trendline, bullish bias remains intact.
Multiple highs around 1.36300 remain untouched — a magnet for price.That area overlaps with an Order Block (OB), making it a high-probability target for institutional interest.
The tight consolidation before the expansion (highlighted in blue) suggests price is loading for a sharp move.
As long as price remains above the demand zone and trendline A bullish expansion toward the OB zone (1.36300–1.36400) Or A potential liquidity sweep above the highs, aligning with external liquidity targets.
$BTC (BITCOIN) 4HPrice previously rallied strongly from a Fair Value Gap (FVG) at the bottom of the chart, forming a bullish market structure.
After a bullish displacement, BTC consolidated in a tight range (reaccumulation) and swept internal liquidity before breaking down.
Now, price has returned to a critical discount zone around 107800–107600
First Target: 109,229 — internal range high.
Main Objective: 112,000 — resting external liquidity above a clean high.
As long as BTC holds above 107600, we remain bullish. The current area is perfect for accumulation before a potential expansion phase toward external liquidity.

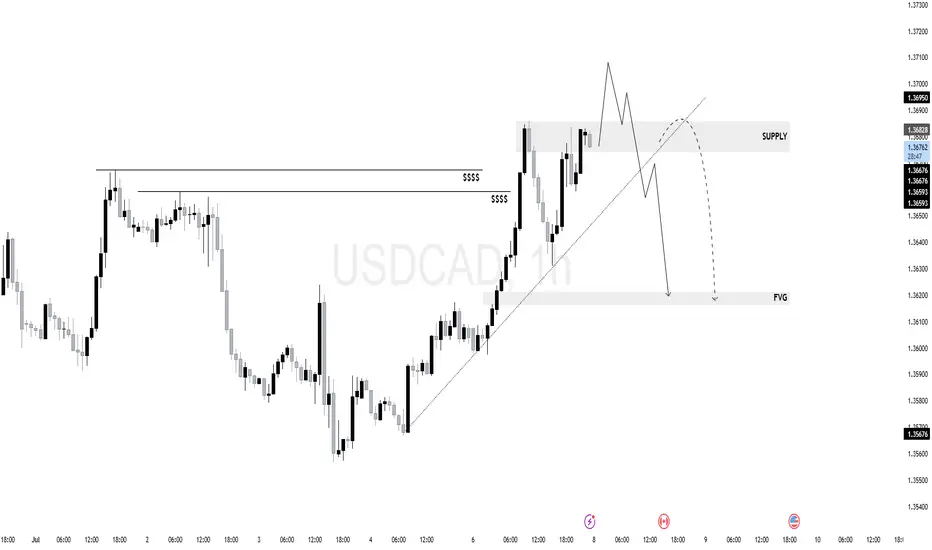
$UC (USDCAD) 1H Liquidity has been swept. Supply has been met.
The price entered a previously established supply area (1.36950–1.36700) and showed early signs of rejection
The break of the short-term trendline coupled with price failing to hold above the highs could signal a shift in structure toward a bearish leg.
If the rejection confirms, price is likely to seek rebalancing at the FVG below (1.36200–1.36000 zone).
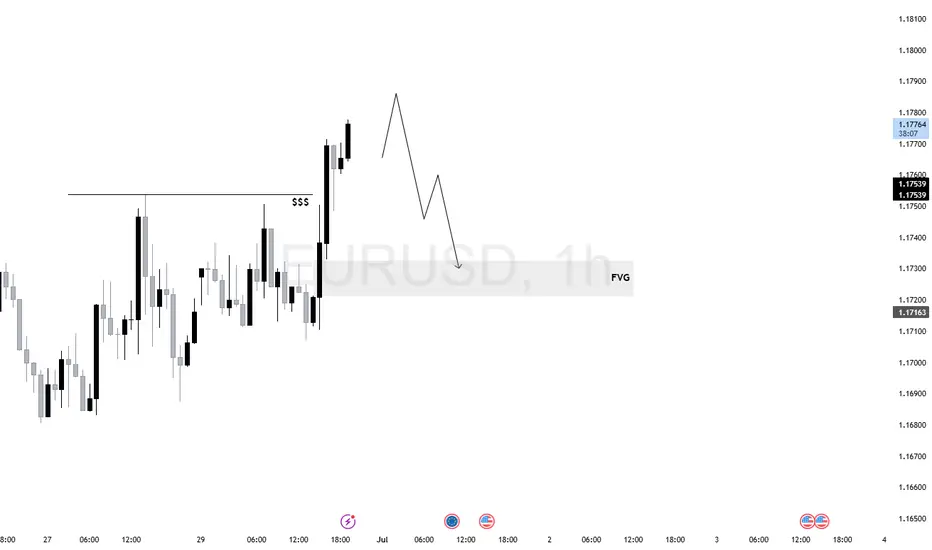
$EU (EURUSD) 1H AnalysisEURUSD swept short-term sell-side liquidity and printed a strong displacement above the relative equal highs.
Price is now in premium territory and likely hunting liquidity before rebalancing.
Bias remains bearish if price fails to form higher-timeframe continuation. Ideal setup would be a short from signs of rejection toward 1.17163 FVG zone.
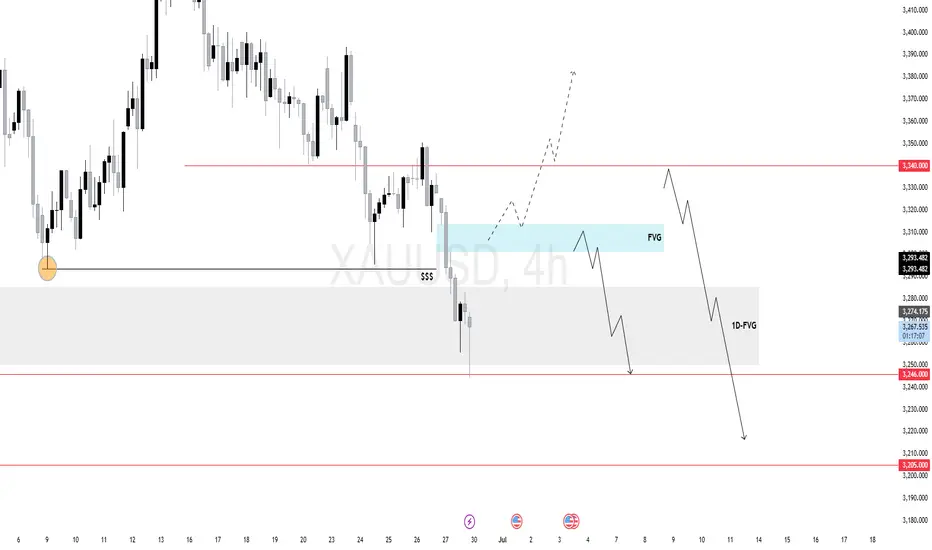
$XAU (XAUUSD) 4H forecastGold swept short-term sell-side liquidity and tapped into a daily FVG, where price is currently consolidating.
The 4H chart shows two potential paths:
Retrace Scenario: Price may rally short-term into the 4H FVG zone for a premium-based entry — ideal area for shorting continuation aligned with the bearish daily and weekly narrative.
Immediate Breakdown: If price rejects at current levels, a continuation toward the 3246 and 3205 daily draw-on-liquidity zones is likely.
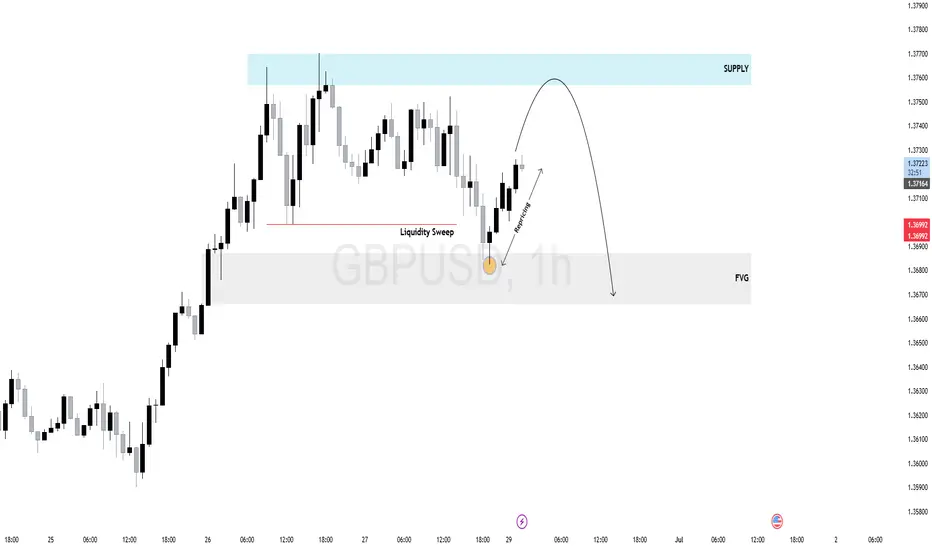
$GU (GBPUSD) 1H AnalysisPrice swept internal liquidity before dropping into a clear 1H Fair Value Gap (FVG), which acted as a draw on liquidity. Following the mitigation, GBPUSD is now retracing toward a high-probability supply zone.
Expect potential rejection as price rebalances inefficiency and seeks sell-side liquidity.
Watch for bearish confirmation inside the supply zone — ideal for intraday shorts if the structure shifts.
Pullbacks = short opportunities.
$EU (EURUSD) 1H AnalysisBias: Bearish after liquidity grab at 1.14392
Setup: Wait for the sweep ➤ BOS ➤ Enter short
Target: 1.13600
Price is forming a range-bound consolidation, but the internal structure shows liquidity building below and above.
The market seems poised to run the 1.14392 high, grabbing buy stops above the short-term high.
After that sweep,i see a rejection and shift in order flow, setting up a bearish leg.
Key POIs :
Sweep Zone: 1.14392 (Buy-side liquidity)
Sell Target: 1.13600 zone – a clear sell-side liquidity draw
The red line marks an untapped liquidity pool, aligning with a previous support level.
Trade Idea (Short Bias) :
Let price sweep the 1.14392 high, form a bearish shift (change of character).
Ideal entry after confirmation of rejection.
Target: 1.13600
Invalidation: Clean break and close above 1.14500

$XAU (GOLD) 15M AnalysisPrice rallied strongly into a bearish FVG (Fair Value Gap) around 3,335 after reclaiming demand...However, this rally lacked conviction and broke structure to the downside, forming a lower high and a weak low retest.
Ideal short setup:
Price returns into the FVG, rejects around 3,333–3,335, then shows signs of displacement downward.
First target: Break below 3,325.
Invalidation: Clean break and close above 3,336.
Bias: Short from FVG zone.
Target: 3,294 area of liquidity.
This is a classic liquidity sweep + FVG rejection setup.
Reclaim of the trendline after sweep.
Price to revisit the FVG zone around 3,335.
Final rejection and breakdown toward 3,294.

$GU (GBPUSD) 4H AnalysisExpectation: Break of trendline → retest → drop toward 1.34450 liquidity.
Momentum is exhausting near resistance, and price is now testing a key ascending trendline...We’ve swept short-term buy stops and failed to sustain bullish continuation.
Buy-side liquidity above recent highs has been swept.
Now, sell-side liquidity rests below 1.35240 (marked in red), a key equal low / internal liquidity pool...Below that, there’s a clean draw to the 1.34450–1.34143 imbalance zone, where liquidity and inefficiency align.
Price could pull back after the trendline break, then resume bearish continuation.

GBPUSD 1H chart✅ What I Like:
Clean Fair Value Gap (FVG):
The FVG is clearly defined and price is actively returning to it.
This offers a textbook point of interest (POI) for a potential short.
Price Delivered into Premium:
This FVG is sitting in a premium zone (above the equilibrium of the recent swing), making it a good area for potential shorts if internal liquidity has been swept.
Aggressive Displacement Candle:
The bullish candle that tapped into the FVG is impulsive — might be a liquidity run, grabbing buy-side liquidity before a reversal.
⚠️ Concerns:
No Clear Liquidity Sweep Yet:
There’s no obvious run on recent highs before price hits the FVG.
Without a liquidity grab, the setup might lack that “smart money” confirmation.
No Market Structure Shift Confirmed:
We’re still in bullish short-term structure unless we break a recent low.
A reversal from the FVG needs confirmation via lower-timeframe BOS.
Dollar News Event Approaching?
The FVG reaction could fake out if major USD data is near.
Fundamentals can disrupt clean technical setups.
🧠 Final Thoughts:
If this setup is to be shorted:
Wait for 15m or 5m structure shift.
Look for signs of exhaustion or rejection in the FVG zone (e.g., bearish engulfing, liquidity sweep of intraday highs).
If price pushes above the FVG without rejection, it may invalidate the short and continue toward higher liquidity.
High-probability zone, but needs confirmation + narrative.

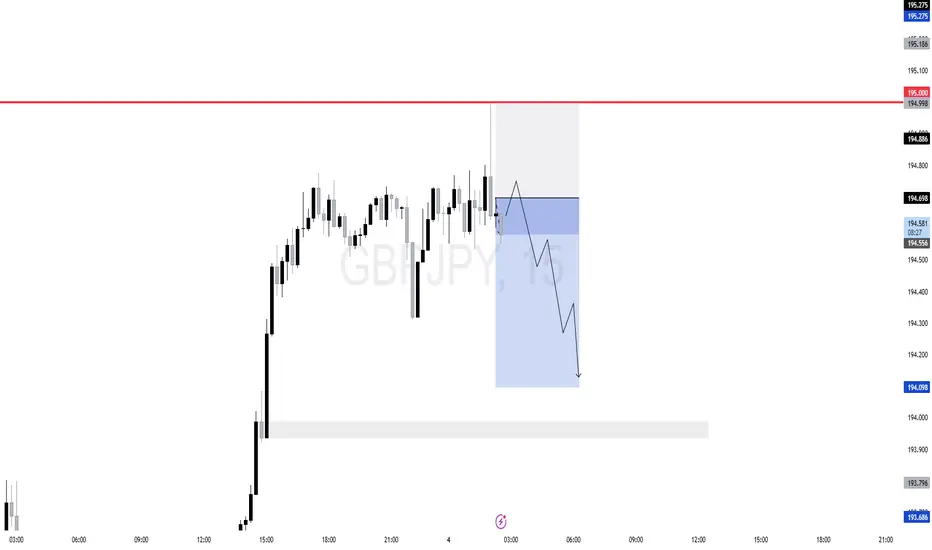
GBPJPY 15-min chart setup✅ What I Like:
Liquidity Sweep at 195.000: Price ran buy-side liquidity above a clear psychological level and showed signs of rejection — classic manipulation.
FVG + Premium Retracement: The short setup aligns with an entry around the 0.618–0.75 retracement zone of the recent leg up, which is also inside a fair value gap.
Timing
🔻 Concerns:
Momentum: The bullish impulse leading to 195.000 was strong. If no displacement confirms the move down, price may consolidate or go higher.
No Strong Break of Structure Yet: To validate full bearish intent, I'd prefer to see a solid break below a recent short-term low (market structure shift).
GBPUSD A Bearish Shift in the MakingThe chart highlights a key overhead resistance (red line). Price has tested this level and appears to be struggling to break above it decisively. This resistance zone is likely attracting sellers who are defending it vigorously.
After failing to break above the resistance, the market seems to be forming a lower high. This shift in structure can be an early warning of a bearish reversal, as buyers lose momentum and sellers begin to gain control.
The blue horizontal line marks a significant support zone. The chart’s projected path indicates a potential move down toward this area, suggesting that sellers might push the price lower if immediate support levels fail to hold.
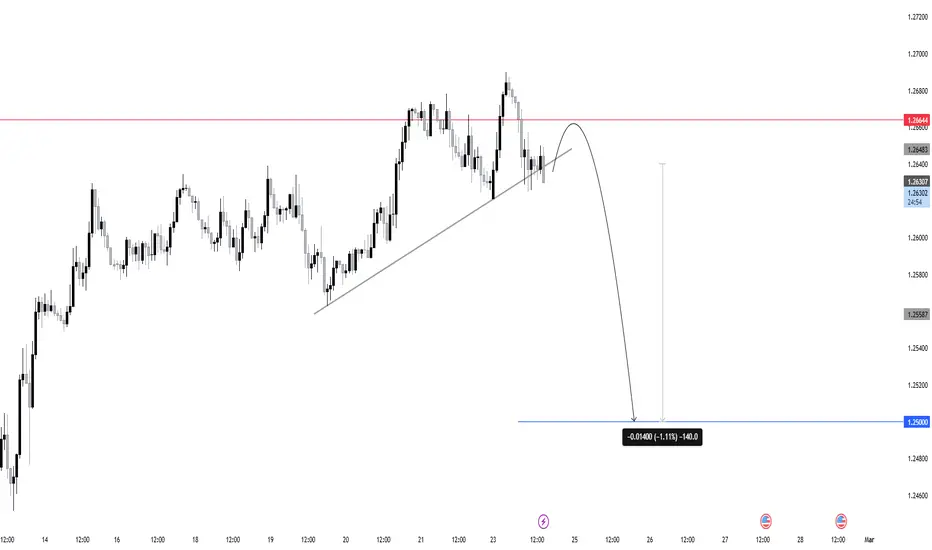
GBPNZD Ascending TrapPrice is currently trading along an ascending trendline, making higher lows in the process. This suggests short-term bullish momentum. However, the overall structure resembles a consolidation or a potential “rising wedge” setup.
The market is hovering just above the trendline, and sellers seem to be testing buyers’ resolve at this level.
The candlesticks near the trendline show some indecision (small-bodied candles or wicks on both ends), hinting that bullish momentum could weaken.
If the price breaks convincingly below the trendline, it would signal a shift from short-term bullishness to a possible bearish phase.

GBPJPY showing signs of a potential DUMPRecent price action shows a consistent lower high formation, suggesting that the bulls are losing momentum
The next significant support comes in around 195.800 and a Further downside targets could push GBPJPY towards 195.000
Stay informed about any fundamental updates that could trigger sharp volatility, but based on the current setup, a bearish outlook on GBPJPY looks promising

OIL bearish bias down to $72.50The price currently trades around $73.37 and appears to be in a retracement phase after a significant sell-off. The overall structure suggests the market may continue to test lower levels with a clear rejection from the recent highs near $75.00, followed by a steady move downward.
Resistance: $74.00, where a rejection occurred
Support: $72.50, which aligns with a previous structure low
Let me know if you agree with my idea ?

$PAAL A Good Crypto CoinPaal AI, now partnered with IBM and Google Cloud, is revolutionizing the AI landscape!
Backed by a cutting-edge token on Ethereum, $PAAL offers more than just utility—it delivers profit-sharing and buybacks to increase demand and enhance value.
Paal isn’t just a project; it’s a movement redefining how AI and blockchain merge.
Im bullish.
