Bitcoin 2021 targetThis is my bitcoin target for 2021 around summer or by the end of year. If i need to give exactly target i woul'd bet around 28 september.
Topping

OIL me up What a crazy rally its been for oil since last November.
Just passed the .786 Fib level on the daily based on the highs of Jan 2020 and looks pretty solid growth wise.
Possible it can go to top of channel around 65.
Definitely been good for the OPEC cartel and the USA.
Maybe theres some cracks?
A lot of traders are pricing in a recovery already in travel and based on vaccination roll out (new variants) seems like this might have been jumping the gun a bit.
Ichimoku looks like it about to cross over and the baseline has been acting as support during this rally. How long will it sustain?
Completely over bought on the daily chart and just went into overbought territory on weekly chart as well.
historically OIL and DXY have been inversely correlated since the oil trade around the world is done in the good ol Benjamin.
Curious to see how a decline in prices would affect DXY.
Let's see what you think,
That's all folks.

Tesla : Looking for a final rally higherThe last count was very bullish and was looking for a wave 3. This did not happen and the count was invalidated. The first adjustment in counting is that price wasn't finished with wave 2(circle) yet. In this count i am still looking for a wave 3(circle) up. Perhaps Biden will launch this rocket.
However, looking at how price has been in a contracting range for the last couple of days, a triangle should be considered. This would mean price is still in wave IV and the final wave V could be a spike through the wave III high at minimum. There is one problem with counting this price action as a triangle. wave 1(circle) has to be changed from an impulsive wave to a corrective wave B of a triangle. This is not a good way of changing a count but can be allowed if the internal structure of that wave is not clear and the timeframe is small enough. Look for wave D to finish between the 2 red lines shown on the chart. Wave D cannot go past the wave B high but should go above the trendline that started at the wave B high.
If the wave IV wave low is broken, a double three corrective wave is still possible, but the size of wave IV would be large enough to consider that Tesla has already topped and is in a larger corrective wave down.
Good luck !

Tesla : Last run upPrice went up nicely from the wave IV low and should continue in this last wave up.


the short is here. BTC. cam weekly and monthlyNew weekly pivot on chart coming. monthly in the 16k region. all weekly and monthly targets getting hit except one in the 19k region. Large correction coming soon. Algos will react to these levels. Camarilla + cpr.


BTC has big resistance in this areaActually the entire area of upper 10ks was not much resistance in general. So breaking it didn't really mean too much. However there are some pretty big resistance here. L3 monthly camarilla level would mark it returning to the original range it fell from.
The Purple lines are the Monthly CPR and pivot point.
The blue line is an already twice tested downtrend line. All of these are pretty significant.
I think its a little early for this breakout. because we will be having a new daily pivot forming which will drag btc down a couple hundred after UTC closing. So lets se

bitcoin. Short potential. 2day. CamarillaCam monthly levels. we hit the top of predicted monthly range perfectly. if we reject here. the typical play would be to target the L3 on the otherside. supporting information is that the sentiment is very bullish. over confident. fear and greed highest since 14k last year. fisher transform on 2day is +4. TD9 sell set ups are on larger time frames. godmode on daily and two day signalling top locally. wave trend. The inverse of wix sensing top points. OBV shows lot of buying in this area. The PPO is in the red extreme warning threshold. The defi movement is just big money narrative or getting more money to begin with. the worlds economies are going to face hardship the coming months. BTC has NEVER been a good storage of value at these levels. People are trying to compare the price action here as if it is unstoppable like 2017 however this is not a blue sky breakout. That is just my two cents.
P.S Potentially we could bounce from 11.8 or see the H4 level or up to it for some upside hunting. that is a large space so exercise caution. stop loss yourself maybe around 12.1 and look to reposition after that happens if it does.

Massive Broadening Top on the S&P 500 (Updated)This is an update of my previous idea showing the multi-year topping pattern happening on the S&P 500. The previous post is linked below in related ideas.
Since that post we've had an incredibly aggressive rally, breaking above all estimated rebound levels, closing all gaps in the March decline, and now looking to challenge all time highs. But the big picture remains the same: we're in a massive, volatile topping pattern at the tail end of an aging bull market. Here are a few things that are new to the situation since the previous update:
Two months of gaps all the way up (seen on a daily chart) that will eventually fill
An over-extended rally, that might better be called a mania, not seen since the 2000 tech bubble
The highest valuations ever by some measures
The lowest put/call ratios ever (showing nobody is concerned about downside)
The largest monetary interventions ever
One of the highest extensions above the 50 day moving average ever (and who knows how many other overbought indicators)
Noob retail traders jumping into the market like nothing seen since the 2000 tech crash
Unprecedented protests/social unrest, further adding to the economic issues and breaking down social distancing norms, sure to bring on another wave of Covid
Meanwhile the economic situation remains positively terrible with nothing by comparison in history but the Great Depression. Basically we're seeing a stock mania, a massive disconnect from fundamentals, happening inside of a recession--something that has never happened before. Thanks Fed!
So looking at the situation objectively, I just can't join all the bulls running so madly ahead while cheering for new highs. The economic situation says the the bull born in 2009 is dying if not already dead. And technically what I see is we've now rallied back up near to the top of the multi-year pattern. So what's the upside? Maybe 100-150 points to the top of the pattern. And the downside? The risk of a 1000 point decline that could be a 2000 point decline if we break the March lows. Are you kidding me? Has there ever been a worse risk/reward in history? Nobody in their right mind is buying here. And that's just it, the market is in a mania--participants are not in their right minds.
Some people are saying the March decline was just a correction, and maybe they're right. But what that means is we haven't even seen the bear yet. The increasingly large drops to the bottom of the megaphone the last few years have just been the initial moves as the bull comes to an end... just a warm up to what is eventually coming. What are we going to see when the market finally turns if the 35% crash in March was just a shudder from a tiring bull? Holy cow.
It's times like this where it's worth pointing out that cash is a position, and it's a sane position that easy to hold as the world goes insane. At least if you can avoid the fear-of-missing-out mania now running rampant through the markets.

ES1 (S&P500 futures) just topped out!Just happened minutes ago, the topping pattern of a High, Low, Lower High, Lower Low, Lower High, and then a Lower Low just completed and then it gave up and did a huge Markdown.
MACD has given an earlier indication of a drop, after pattern completion.
THIS IS a topping pattern, and it is of high probability that the S&P500 topped out.
Now waiting for it to continue the downward momentum and break the trend line support. But not before a rather lame attempt on daily charts next week to recover somewhat and reverse down again.
Watch for it...

Will CAD remain strong?The Canadian Dollar continues its recent out performance against the US dollar and is currently pressing down on a noted support zone. USD/CAD has turned lower after hitting a four-month high last week, helped by a small rally in the price of oil off its multi-month low. The price of oil however will remain under downside pressure, as investors fear that hit to the global economy from the coronavirus. A Chinese flu-like virus.
Looking ahead this week, USD/CAD traders should be aware of two important data events on Wednesday with the latest Canadian inflation data released, while later in the day the FOMC minutes will be released.
This move lower highlights the current weakness in the pair although the CCI indicator does not fully confirm this. A break below the support-zone could see the pair fall back to the 200-day moving average

ISRG Topping RiskISRG dropped sharply from its recent new all time high. The stock is struggling with heavier large lot rotation action at this level. Volume is too low and Balance of Power shows heavy rotation.

Activision - New lows ahead?With equities being enormously stretched to the upside in recent months, it is wise idea start preparing for some short exposure.
One idea, I am looking at is NASDAQ:ATVI $ATVI
After halving in later 2018, during 2019 it is building what looks like a major bear flag. Wave structure, with price near 0.618 level, also suggest that the top might be near and reversal may start relatively soon (probably though we will get gap fill at first).
For entry some support trendlines also need to break first, and I will be watching for this development.
P.S. NASDAQ:EA chart is somewhat similiar $EA

XEL Forming Intermediate-Term Top, Downtrend RiskXEL is at risk of an intermediate-term downtrend after topping recently. The strong support level is near 44-40 for the first big bounce up level.

DLTR Turns at ResistanceDLTR was unable to break out above a high resistance level. The stock bounced at a short-term topping completion support level.

VRSN at Topping Completion LevelVRSN has a bounce up at a support level that is technically within the topping formation completion level. The stock has recently consolidated above the prior low for this top.

AXP at Risk of a Rounding Topping FormationAXP has had a slow downward rounding candlestick pattern as the stock slips down in price. The price has stabilized for the moment at a Topping Completion support level.

4h BTC The 4 h topped on the daily 200 MA, it was a 4h 9 TD sell, which in the end printed a RED 1 TD price flip, if we go on as this without a reversal, we could face a countdown to TD 9 buy on the 4h.
The 4h EMA are still bearish and the short EMA just flirted with the 50 EMA (yellow), I still don't see a reversal and also the volume keeps declining. We are stuck in an EQ and we still have time to go on, be careful.
Trade safe folks.

Is the upside move starting to reverse\consolidate?This big surge over 10k is starting to form a broadening topping pattern that suggests that once the support is broken BTC will either correct downwards to test the 10k mark once more, or at the very least start to consolidate for a bit.
That being said we are still inside the pattern and we could have another retest of that resistance at about 11k.
What do you think is happening?
Share your thoughts in the comments!

BTC topping?Is BTC finally giving in to logic and reason? will the correction finally begin\continue now? Cast your votes now in the comment section below!

BTCUSD: Gann fans shown respect and MOM nearly at 0Respect was shown to the previous Gann fan and the current one. Now that momentum has topped out, we have seemed to hit major points of resistance and we are bearish again.

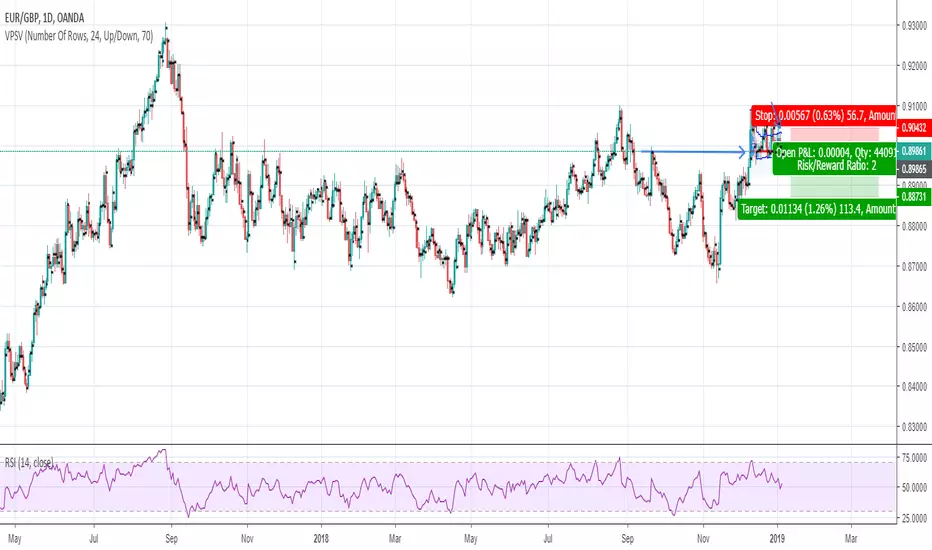
A clean shortPrice is retesting the POC for the current consolidation which is also a solid level of resistance since 2016, with the exception of a small peak in 2017. Momentum in the RSI has sharply fallen off leaving solid reason for me to believe price will continue any higher. Using the current price for entry and keeping the stop just outside the value area and a 2:1 RVR. Enter at .90411 Stop .90432 Target .89841