Total Market cap daily wave countingAs it is clear in the chart, a 5-wave impulse structure has been created, probably this 5-wave structure is either wave A or wave 1 of a larger structure.
So now we need the market to complete wave B or 2 and enter correction.
With time analysis calculations, the possible time levels of price return are:
8 Jun
25 Jun
12 Jul
4 Aug
5 Sep
Also, using the Fibonacci retracement, our possible price levels for the retracement end are:
1.022 B
958.50 B
900 B
In addition, with the formation of the head and shoulder pattern, the main target of the head and shoulder pattern overlaps with the second target of Fibonacci, i.e. 958.5 B, so this range is very important for reversal and support.
Total

TOTAL2 - Rounded TopA Rounded Top structure on TOTAL2
This rounded top will result in an upward movement once completed within the channel
I have plotted an example upward movement with the bars pattern tool in green
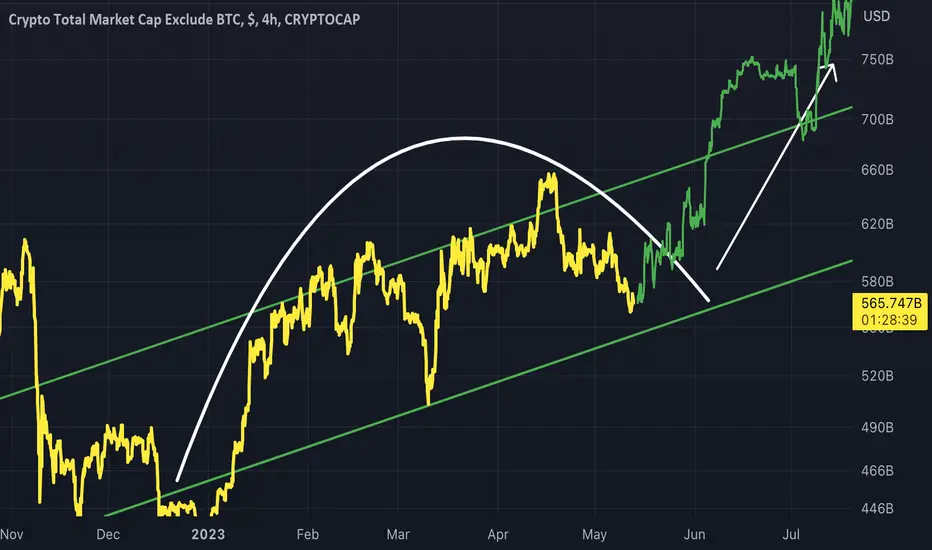
Crypto $TOTAL 3 been weak & likely has lil more to goUnless you're not on twitter #memecoin season hit hard & looks like it has likely GONE
This was a weird phase, very different from many others
Usually the pattern on break down = CRYPTOCAP:BTC > CRYPTOCAP:ETH > #altcoins > #memcoins
But most #crypto fell at same time this time around
Well, except SOME #memes
IMO the Bull is not dead BUT has a few spears in it (think Spain)
LONG TERM #crypto just retested BREAKOUT lvl
Need to expand long term chart

The market will begin recovering soonThe market is still in a bearish trend. However, the BEAR cycle will soon be over. Keep an eye on the 1000x indicator. Wait for the green zone to go long with your fav coins and tokens!

TOTAL 1DWe can see the total index chart in daily time
Currently, it has reached the bottom of its channel
My expectation is that the price will support in this area and move upwards
If the channel is broken, I showed with an arrow how far the movement will continue.
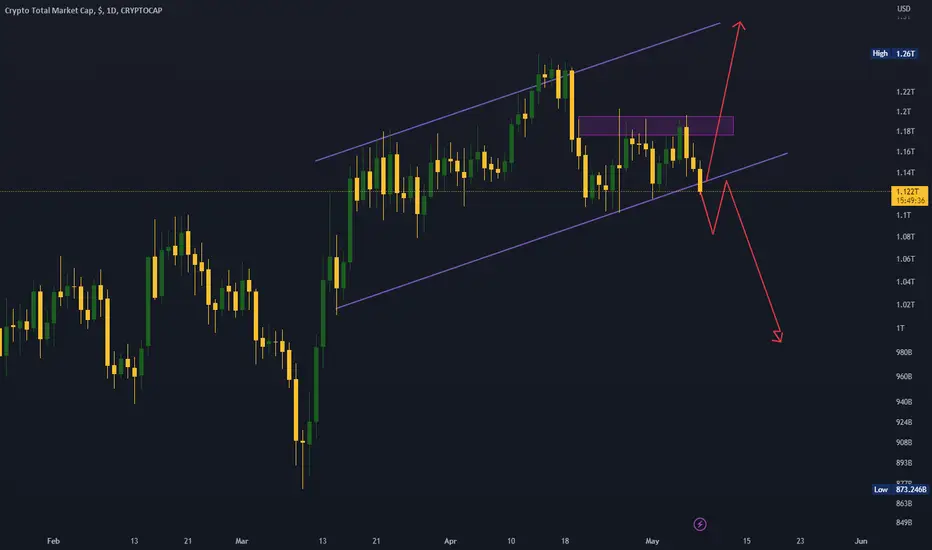
TOTAL CRYPTOCAP 35% LongFrom previous low 1,1 T i am expectiong 45% UP
The lowest target is bottom of yellow box, highest target is top of yellow box
Stop is a white line

USDT.DThe second scenario is the downward trend of the index and the upward trend of Bitcoin
One thing I learned empirically is that
When the price enters the trading range after a spike, finally the price breaks the trading range in line with the spike it hit.
what is your opinion ? :)

Altcoins not looking hot, but haven't in some timeCan't recall last time we had this much cash available for #stocks AND #Crypto
CRYPTOCAP:TOTAL 3 = NO CRYPTOCAP:BTC or CRYPTOCAP:ETH
IMO, unless change FAST, #altcoins look like they want to trade a lil lower still
(we haven't posted much here but we're still active, pls see profile. Making killer calls)
Total marketcap analysisAccording to the total chart data, we will have two scenarios ahead:
The first scenario : Increase liquidity in the market
According to the chart data, we are now in a support area marked in green, if this area is maintained, we expect liquidity to increase to the blue areas.
Second scenario: decrease in liquidity
If the blue areas that act as support are lost, we will see liquidity fall to the purple area
My personal opinion:
Due to the failure of the average of two hundred days in the chart and its re-pullback
(blue circles), I predict that the first scenario will happen and increase the liquidity in the cryptocurrency market
A smart trade should always have appropriate solutions
Trade smartly

Blood Moons & Fibonacci: Exact Dates to SellWhen analyzing the cryptocurrency market, it is important to consider the total market cap rather than just one coin, such as BTCUSD. Charting the TOTAL crypto cap provides a more comprehensive view of the overall market and allows for more accurate tracking of inflows and outflows.
Based on the analysis of the 0.618 fib retracements for horizontal fib and fib speed fans, it is predicted that the market will continue to follow a predictable pattern. The intersection of these lines marked the echo bubble of 2019 high and the cycle top in 2021. This indicates that the market is currently following a similar pattern and is likely to continue in this direction.
Using this analysis, it is projected that the cryptocurrency market will reach a total market cap of 1.758 Trillion by the the middle of this year.
In addition, the analysis of the blood moons provides further evidence to support this prediction. The last blood moon in November 18/19, 2021 marked the cycle top, and the next blood moon is predicted to occur on March 13/14, 2025, which is expected to mark another cycle top. Therefore, it is recommended to de-risk heavily and exit the market Between March and May of 2025.
Looking ahead, it is predicted that the cryptocurrency market will continue to grow and reach a maximum market cap of 7.178T by March/May of 2025.

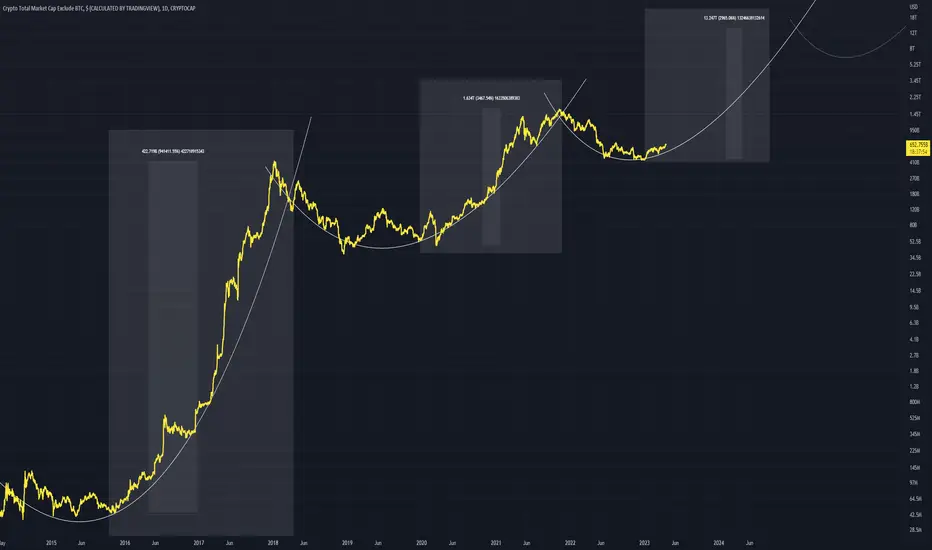
Price is Fractal - Fibonacci MagicAs you can see, nothing in this market is random. Fibs play a major role. TOTAL market cap is the best expression of this, all other charts are not as useful for analysis of where the overall market is going.
I had to split this into 4 charts to illustrate how price is reacting off significant fib levels (38.2% and 61.8% mainly, but also the 127.2%)
In chart 1 you can see the initial rally retraced perfectly to the 38.2% fib
We then saw a bounce to the 127.2% before a deeper retracement to the 61.8% (as illustrated in chart 2). Note the fib was redrawn from the the swing low to the new swing high.
You can also see in chart 1 the second peak was at the -38.2% of the first FIB drawing.
And the second peak is at the -38.2.% of the second fib drawing..
Fascinating.
Down to chart 3, drawing the fib from swing low to swing high, we see price has currently retraced to once again, the 38.2% and stalled.
We can now assume that a similar thing will occur (a smaller relief rally to 127.2% and a potential dump to the 61.8% before a bigger move higher.
As illustrated in the 4th chart.
There's a possibility we move even higher than the 127.2% and run tot he 138.2% before encountering more resistance


TOTAL chart analysis + 10 ALTS TO BUY WITH ITS ANALYSIS !!Hello Dears,
- after yesterday correction, bulls were able to hold the bottom of the channel and that will give us a chance to make some profits again through long positions
- you may early enter Alts now before the breakout of the channel but please use a proper risk management strategy
- or you can wait for a confirmation and ride the wave
- here are some trades that are still in our buying zone
MBOX | Very clear trade setup
COMP USDT | two trade opportunities !!
MATIC | Possible crap pattern
UNI | Time to break the consolidation phase
FET | Bullish flag breakout confirmed ✅
MAGIC | Massive Ascending triangle !
APT USDT | Triangle Breakout !!
#COCOS/USDT | full details trade!
ACAUSDT | ready for a bullish impulse
Maybe you can fill your bag now 😁
Don't forget to leave like, your support is really appreciated!!

TOTAL2 Curved Trend The trend that will take us in to the next bull run
This curve is evident since the start of price formation. I have put an extra dotted line to show what it would look like if the curved trend repeated again.
There is a massive difference however in % between the first being (941411%) and the second only being (3500%)
Bullish heading into the third curve up
Altseason coming.... Hold AltcoinHello guys.
Total, Total2 and Total3 in Weekly TF.
Hold Altcoin.
Thanks.

Crypto market cap $ Money flow💰. TOTAL CRYPROCAP 📈📉updateHello guys. This is an update of previous analysis (blow link), The chart is very similar to Bitcoin now. The market broken its strong resistance zone in 1.16-1.18T, which is a sign of money flow. So after a retest of this area and fixation, we will see the continuation of the upward trend and the entry of money to the crypto market to 1.5T. Consider it and monitor the price's action in the circles.
Good luck.
If you like the idea, do not forget to support with a like and follow me for next analysis :)
Write your comment and opinion here to me
.
Salam doostan aziz, yek update az tahlile gozashte (linke zir) hast, hame chiz rooye chart moshakhas shode. market nahiye moghavemati ghavi khodesh ro shekaste dar 1.16-1.18 T, ke in neshane voroode pool be bazar hast. pas baad az yek retest ya pullback be in nahiye va tasbit balaye an, ma shahede edame harkate so'oodi va voroode pool bishtar be bazar khahim bood be target 1.5T. ino darnazar begirid va raftar bazar dar dayere haro rasad konid.
moafagh bashid.
like va follow faramoosh nashe :)

📈TOTAL3 is ready to rise above dynamic resistance📉CRYPTOCAP:TOTAL3
Hey everyone, first take a look at my previous analysis and positions.
As previously analyzed, alt-season is coming.
Don't forget to risk-free your position.
Please share ideas and leave a comment,
let me know what's your idea.
CrazyS✌

ALTCOINS: Key Comparison Shows Altcoin Market Is Ready To FlyHello All,
The market has had a great year! Everything has been playing out nicely.
BTC has risen more than most & now we have ETH making yearly highs.
Do we know what is next? ALTS! It has happened too many times in this order.
(First bottom, then entire market bounces, then entire market corrects, then BTC outperforms along with some alts, then ETH outperforms along with some alts, then rest of alts catch up.)
Everything now points to the idea that ALTS are about to run hard!
In this idea, I am comparing the TOTAL crypto market cap (BTC & ETH & all others) to the altcoin market cap (excluding BTC & ETH & stablecoins).
As we can see, the altcoin market cap has been severely lagging behind the total crypto market cap (mainly because of BTC & ETH outperforming).
The total crypto market cap has just fully cleared its August 2022 swing high. Altcoins are nowhere near there yet!
As seen with the orange trendline drawn, when TOTAL broke over it, it has rallied straight past the 200MA and onto its first HTF higher high!
Altcoins just broke this same orange trend line! Next up is the 200MA and then the August 2022 swing high.
This seems like a high conviction play.
Keep close eyes on your favorite alts.
Thanks for reading!
Please comment and like!

3 Charts say : ALTS Could PUMP!Hi everyone,
Question i get a LOT these days: ''Why BTC flies but most ALTs don't''.
Well that is usually the case, Bitcoin needs to rise first, them some money leaves BTC for ALTs.
Let's look at 3 charts that are in favor of a good ALTs mini-season ahead:
1. ETHBTC on support:
Bitcoin flies first, can ETHEREUM, the second biggest crypto and First ALT follow? Answer is very probably yes.
Shanghai is on but that's not scary news, maybe the contrary: Link
chart:
2. BTC Dominance at Resistance
Good for alts. Some money can flow from BTC to ALTs.
Chart:
3. Crypto Total Market Cap on Support
Chart:
Also note the fundamentals:
Inflation drops, Feds admit they are close (or late) to stop hiking: Link
One Love,
The FXPROFESSOR

Prepare for the worst and Hope for the Best...Wojak is crying. Do not gamble tonight... The trend is clearly bearish, and the market doesn't look good!

Why I Believe BTC and The Crypto Market Is Heading HigherHello all!
As I was recording this video, BTC has made a new yearly high!
Hope you all enjoy!
Thanks!

Altcoins look like they want to move BUT.......REALLY LIKE how $TOTAL 3 is looking = NO #BTC or $ETH
#Altcoin are looking like they want to MOVE!
There is one issue i. There's a TON of resistance all over the place further up.
It is taking one out today!!!
#Crypto #cryptocurrency

Cryptocurrency market cap 2-daily EMA20💫EMA200 crossCryptocurrency market cap 2-daily EMA20💫EMA200 cross
Bad times to buy cryptocurrencies❓
Act as experienced investors do... dear Bitcoin & Crypto Nation ❗️😎
And think long-term 🗓️
Let me know your thoughts in the comments🤗
⬇️⬇️⬇️
Likes and Follow for updates appreciated🤗
Disclaimer:
Not financial advice
Do your own research before investing
The content shared is for educational purposes only and is my personal opinion
