TOTAL - Crypto market phases🟩🟨🟥⬜️Update on this chart since ~5 month dear Crypto Nation😎🚨
These repeating patterns of different market phases are still valid IMO🟩🟨🟥⬜️
Did we finish the A-B-C correction and are at the start of the Bottom market phase for Cryptocurrencies ❓
Let me know your thoughts in the comments🤗
⬇️⬇️⬇️
Likes and Follow for updates appreciated🤗
Disclaimer:
Not financial advice
Do your own research before investing
The content shared is for educational purposes only and is my personal opinion
Total

Major Reversal Symbol Flashing for $DXYThe "TBO" indicator was created to show the strength of the trend as well as show breakout and reversal signs. The U.S. Dollar Index (DXY) has been an important metric for gauging the sentiment of TradFi markets (SPX, DJI, FANG, XAUUSD) as well as crypto markets (BTC, ETH, TOTAL), which means that all TradFi and crypto traders should be paying attention to this chart for two reasons:
If DXY is bullish, TradFi and crypto markets tend to trend bearish
If DXY is bearish or consolidating (moving sideways), TradFi and crypto markets tend to trend bullish and are more susceptible to bullish breakouts (like we've seen market-wide since November 2022)
So going back to the "TBO" indicator and its importance in showing DXY's sentiment, when looking at the current day (February 17th) we can clearly see several "TBO" Close Short symbols (the orange diamonds below the candles). These symbols tell us that the trend could be reversing soon, and that we should consider taking some profits out of our short position.
With this information in mind, and judging by past performance of the "TBO" Close Short symbols indicating upside reversals, we will be paying even more attention to three of these such symbols printed in a "cluster," indicating a stronger possibility for DXY to move to the upside, thus resulting in bearish sentiment for TradFi and crypto.
There is no way of knowing how long a supposed upside reversal will last according to the TBO, so caution must be exercised moving forward.
*Note: the "TBO" indicator is written with quotation marks because there is an existing ticker for TBO, which is not related to the Trending Break-out indicator. To prevent hyperlinks from showing every time we type TBO, we have added quotation marks.

BTC VS TOTAL 1W - Pattern invalided? During Deathcross BTC creates first the cross then TOTAL
During Goldencross TOTAL creates first the cross then BTC
The last Goldencross now in February (2023) BTC created first the cross then TOTAL.
Is the cross invalided?
Furthermore the next levels are 9% to next Reversal Point. Price: $26780
The average of 35% (based on the 2 previous Golden Cross) gets us to $29200.
Date Date. Days of. Price. Price
Start End Type Differene Open Close Difference Market Days 1st 2nd
01/04/18 08/04/18 Deathcross 8 $6.808,00 $7.020,00 3,02% -5%. 8 BTC. TOTAL
19/04/19 24/04/19 Goldencross 5 $5.258,00 $5.416,00 2,92% 150% 63 TOTAL BTC
13/10/19 26/10/19 Deathcross 13 $8.280,00 $9.244,00 10,43% -37% 36 BTC TOTAL
14/02/20 18/02/20 Goldencross 4 $10.360,00 $9.684,00 -6,98% -53% 25 TOTAL BTC
25/03/20 02/04/20 Deathcross 8 $6.737,00 $6.751,00 0,21% 50% 46 BTC TOTAL
19/05/20 21/05/20 Goldencross 2 $9.800,00 $9.071,00 -8,04% 35% 95 TOTAL BTC
19/06/21 07/07/21 Deathcross 18 $35.767,00 $33.836,00 -5,71% -22% 38 BTC TOTAL
31/08/21 16/09/21 Goldencross 16 $47.116,00 $47.775,00 1,38% 36% 39 TOTAL BTC
14/01/22 23/01/22 Deathcross 9 $43.097,00 $36.224,00 -18,97% -19% 9 BTC TOTAL
07/02/23 13/02/23 Goldencross 6 $23.243,00 $21.780,00 -6,72% ONGOING BTC TOTAL

TOTAL 3 - NO BTC or ETH breaking 1st Downtrend!🚨🚨🚨Look at this!🚨🚨🚨
$TOTAL 3 = #altcoin = no $BTC or $ETH
What do you think so far?
Volume decent too
Weekly bout to crossover!!!
#BTC looks good too but weekly close will CONFIRM = Friday night
🎆🎆🎆EX-CI-TED🎆🎆🎆
Wait till FOMO kicks in!
#crypto

[UPDATE TOTAL3] I said it multiple times. This a good scenario.Let's see if we go for yellow or white.
Yellow = short squeeze
White = wyckoff

TOTAL Crypto Market Cap DAILYThe TOTAL PA is sliding down the Support nicely while the MACD cools off. Its not ready to turn just yet so we may remain like this till Weekend.
The Long wicks show the battles going on right now and you can see how the 50 MA ( Red) acted as support yesterday.
There is little doubt the Bears are trying hard to drop the price but the Bulls are holding on
Support should hold despite the FUD and attempted destablising by the IMF nd SEC, which are all representatives of the traditional Banking industry
No surprises there then

$BTC weekly shows interesting data$BTC still chugging lower, albeit slowly
$TOTAL 3 = #altcoin no longer looking better than #BTC
#bitcoin regaining dominance is not the worst thing in word although it's being done on weakness
Weekly BTC RED EMA @ Breakaway gap area
Interesting
#crypto

$BTC vs $ETH vs $TOTAL 3 (Altcoins)Be careful with this drop
There's something more @ play here
Still cautious bull but $BTC can drop close to 10%
That's decent amount of pain for #altcoin
$ETH could fill the gap or drop to 1400
RSI looks BAD
$Total 3 = #altcoins is whimpering
Some bounced nicely already

Crypto MC - Potential Upward MovementCrypto Market Cap EMA crossed above HA Trend Follow. Exit at upper BB

#TOTAL (Crypto Market Cap Elliott Waves Analysis)Hello friends.
Please support my work by clicking the LIKE button👍(If you liked). Also i will appreciate for ur activity. Thank you!
Everything on the chart.
we have finished forming the ending diagonal and got a good upward impulse,
in the medium term I expect a correction to the ~850B area and continued growth with the main target in the 1.2 - 1.25T zone, if we are lucky, it is possible to see even 1.5T
Good luck everyone!
Follow me on TRADINGView, if you don't want to miss my next analysis or signals.
It's not financial advice.
Dont Forget, always make your own research before to trade my ideas!
Open to any questions and suggestions.

BTC analysis for most possible directionDidn't post yesterday, was busy
---
This is copy paste from yesterday
$BTC not looking so hot atm
#BTC RSI is sinking fast
$TOTAL 3 = #altcoin
Also looks weak but nowhere near as much
Facing heavy resistance
We're likely due for a lil pain from here
---
TODAY
1/2
$BTC @ an important area
#BTC holding @ dotted line support
#bitcoin trading UNDER Red Mov Avg for 2nd day
Buy volume lowers, sells > than buys but not much
RSI MUST NOT tread sub 50 area (middle)
We break Green Mov Avg still ok but MUST HOLD Breakaway Gap area
#crypto
2/2
What about $BTC vs #altcoins?
$TOTAL 3 = #altcoin
Staunch resistance right above
Yet holding better than #BTC
4Hr shows some buys coming back
See the Inverse head & shoulder?
Ugly but it's there
#crypto had huge run, it's okay to REST as long as it doesn't fall asleep

Golden Cross irrelevant - Weekly crossover MORE importantTons of posts on Golden crossover
IRRELEVANT
Why? Because it's garnered so much attention it lost its validity YEARS ago
What IS relevant is $BTC WEEKLY short term crossover that we called Jan 30th
#BTC setting itself nicely
#bitcoin closed up .8% #altcoins up 3%!
#crypto

$OP Optimism - Bearish Harmonic Pattern formed dailly
- Currently facing 1.618 as resistance
- Bear div building on both oscillators
- Currently up 280% from the lows

$BTC $ETH & Altcoin data, Memecoins running, what it mean?Important short term🧵
$BTC RSI not showing good signs, NEG divergence
#BTC HAS BEEN LEADING the rally but it's weakening
We've posted on this $TOTAL 3 doing ok
#memecoin running usually @ end of runs
#bitcoin MUST hold support levels
MUST hold number is 18kish
---
2
$DXY running & RSI over 50 again
BAck to #crypto
$Total = ALL including $BTC & $ETH
Not showing recent strength of Total 3 = #altcoin
They all still have a ways to go to break down trend
Although #BTC HAS done it on it's own
#bitcoin has been LEADING until now
Rest time?
---
3
$BTC broke downtrend not long ago & struggled
24k has been issue = MAJOR RESISTANCE &
NECKLINE for Inverse Head & Shoulder = BOTTOM
Now $ETH RSI looks ok
However HUGE resistance @ 1700 area
#ETH hasn't broken downtrend
---
4
$BTC is to $DJI = $ETH is to $NDX
#DJI broke out before #NDX did
Very likely #BTC broke already & #ETH will follow
We'll likely take another month or so to realize the bottom
$TOTAL 2 = No #bitcoin, includes #ethereum & #altcoin, looks ok
We'll see how all pans out
Gnight
TOTAL3 = Altcoin Crypto is moving better than BTC atm = LIKEY!Please see profile
This is re-post
$DJI almost went green since post
$NDX went HIGHER
$BTC sells but fresh buying came in
#bitcoin battle ensuing
#BTC breaks 24, hopefully with volume we should see MORE than 10% pop, maybe even fill gap
*******
#Crypto #altcoins pumping $Total 3


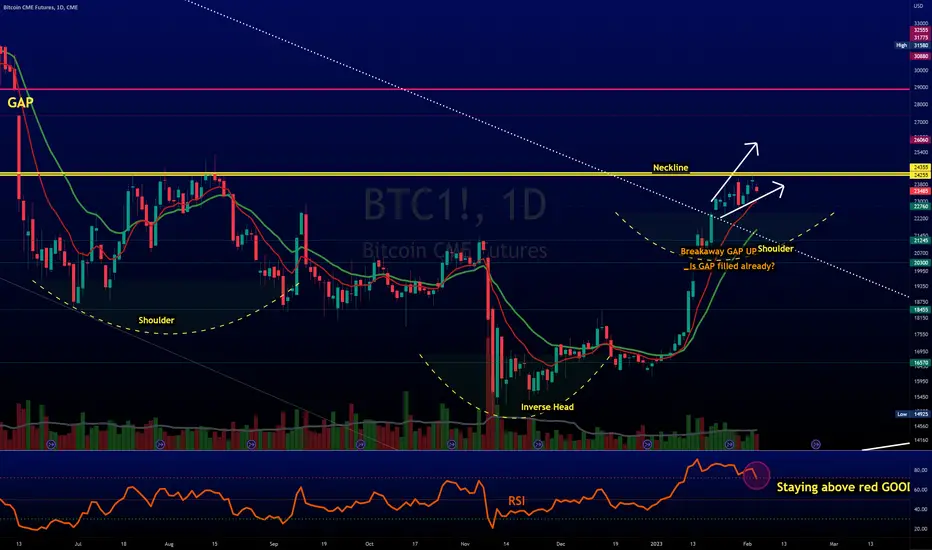
$BTC bearish engulfing light volume - Now what?1
Said MANY TIMES 24k would be HARD for $BTC
#BTC high = 24080
DAMAGE DONE:
Short up trend broken
Bearish engulfing but LIGHT volume
STILL IN PLAY:
Breakaway Gap
Inverse Head & Shoulder
RSI above overbought, red dotted line
#bitcoin playing out as expected
Rest of #crypto?
---
2
#Bitcoin BULLISH WEEKLY CROSSOVER soon?
Bearish crossover happened DEC 22
$TOTAL 3 = #crypto #altcoins - hasn't looked as strong as #BTC
RSI been going lower but currently resting @ red moving avg, holds = good
1 last thing
$BTC 4Hr hasn't traded under avg's since Dec 30

Total vs Total2 vs Total3Let's compare $TOTAL = all #crypto
vs NO $BTC with $ETH = $TOTAL2
vs NO #BTC or #ETH > #altcoins = $TOTAL3
Not much change between T & T2, although T looks a bit better
However, T3 is beginning to show lil more spunk
Could we be setting up for MORE #altcoin moving?
We'll see soon

Crypto Total 48k FractalWe have taken liquidity from the last supply area (yellow line) at the top BEFORE the FTX pump
This means all Shorts that have tight stop losses BEFORE FTX DUMP are now taken out.
TOTAL is painting a fractal similar to how it did at 48k
This is concerning, and Long should be very careful here

TOTALThe total index is below the psychological range of 1 trillion.
Since the size of the bullish impulses is gradually getting shorter, we are likely to see a correction.
But if the level is broken with a strong trend, the scenario will collapse and the rally will continue.
In a few days, the Fed will announce the interest rate, it is likely that the market will react after that.

Where is the BTC bottom???BTC supply is rarely calculated/used in charts. Since we analyze equities/idices divided by M2SL, we should divide BTC with it's supply.
Since 2021, BTC supply increases by ~0.003% per week. At least according to the BTC_ADDRESSES ticker.
While this may not analyze the true amount of BTC in circulation, it is at least a start...
This process allows us to add a distinct bound to it's price. It's logarithmic expansion is hard to analyze. So this transformation solves most of our issues with it.
A larger view of the chart.
SCENARIO 1
Bitcoin wealth trends upwards compared to it's supply - It creates wealth
The channel was drawn using a log-scaled regression.
The light-blue line is a more realistic target for the bottom of the channel. The 2020 black swan is an outlier, we do however take it into consideration as a terminal target.
In order to get an idea of the timing, we draw a channel for the last 100 weeks.
And after extrapolating the trend channel, we take 6 targets.
Taking into account the increase in BTC supply (increasing supply, decreasing price) we get the final targets.
A=14220, B=12987, C=14719, D=13468, E=15432, F=14113
SCENARIO 2
Bitcoin fluctuates horizontally to eternity
Look at this retracement...
The 1.618 ratio is an impenetrable border (?)
This chart suggests that perhaps there is a big drop ahead of us, I haven't pinpointed a probable bottom. I will update this idea in the future if I come up with anything.
Price never succeeded to pass this ratio. Instead we had distribution for the last two years. It feels as if this ceiling may never give in. Bitcoin's role to society must change for it to skip this border. Then price might head to an entirely new scale. A monetary crisis could provide an opportunity for BTC to become a viable alternative to fiat currency.
Make sure to follow this idea by SPY_Master for more information about the brewing crisis.
Tread lightly, for this is hallowed ground.
-Father Grigori

Rising Triangle Idea To 30k I believe there will be a small pull back "trap" to the baseline of the first flag around 21k.
This will cause the unexperienced trader to think the rising wedge has been broken.
The impulse wave following afterward towards 30k will be strong and many shorts will be liquidated.
What happens next? 10k or 42k... we shall wait and see!
Not trading advice, Just for fun! (:

TOTAL chart 1 hour - REFERENCE ONLYJust putting this up here now as, well, we can see, something HAS to happen soon. Take care..Could go either way
