Total Crypto MarketCapTotal has bounced off of resistance, but the indicators are pretty low. The value has also reached the extreme bottom now and is very likely to bounce up in a try of reaching the 1,4~1,5 T marketcap. We need to monitor DXY, BTC and SPX to see if that is possible.
Total

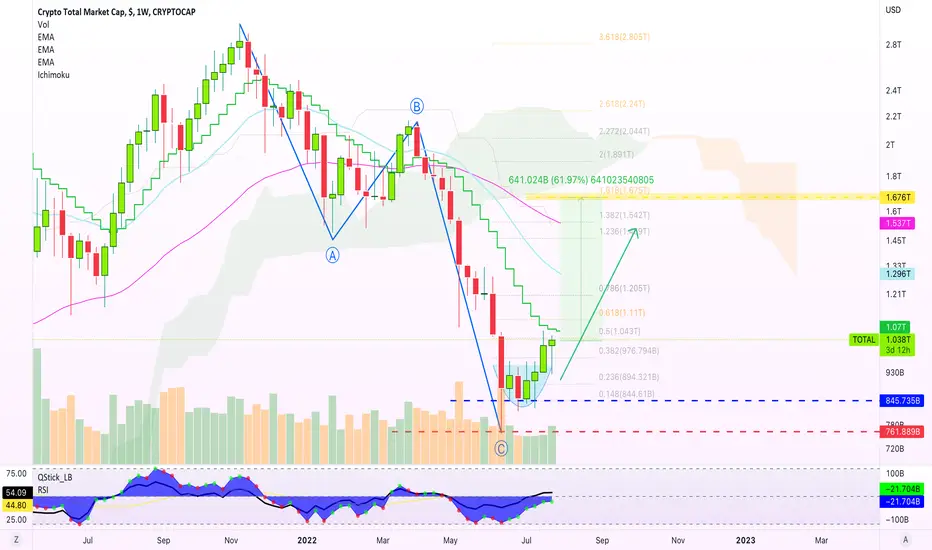
TOTAL CAP ON THE LAST CORRECTIVE WAVE ...!In this post, we have analyzed the total crypto market cap index ,using the Elliott wave counting, classic patterns and price action theory.
Like and share if you agree with this and comment you own concept.
-Thanks-

Head and shoulders to watch out for on total crypto market cap.Right now price action is currently testing the neck line of a head and shoulders pattern that, if validated, could wipe 250 billion off the total crypto market cap. We can see its been stiffly rejected recently by the 1 day 50ma…in order to avoid validating the h&s pattern, it is crucial to flip this 1 day 50ma back to solidified support. There is a lot of fearmongering recently about a bunch of bt coin being released from Mt. Gox that could get immediately dumped on the market…something to look out for as it is a moment like thaat that could lead to a pattern like this triggering. However for now there’s still a chance this could be a fake out. Will have to wait and see, but we should know soon enough. *not financial advice*

Crypto TOTAL MarketCapAs you can see - we reached the triangle's target perfectly and bounced off of it. All indicators are either resetted or in middle ground open for rising - We can witness a push to the descending trendline once again.

TOTAL 3 weekly still looking bullish overallTOTAL 3 weekly chart:
The Long yellow rectangle support box may
be the most important support in the entire
Market as a whole. When there is around 19,000
Alt-coin projects relying on BTC holding and this
huge monster support box holding, this is Do or
Die...Im confident in the coming 300 days,
we will see all time highs in the TOTAL 3 market.
The Green $2.674 Trillion is my Super bullish
prediction coming from measurements. and the
smaller yellow rectangles are the falling bearish
support boxes....lets hope we dont see the candles
fall lower. The RSI has never been this OVERSOLD, we honestly should be moving up
bc we are in uncharted territories and sentiment should change.

#TOTAL MARKET CAP 1DAY ANALYSIS !!Hello dear traders, we here new so we ask you to support our ideas with your LIKE and COMMENT, also be free to ask any question in the comments, and we will try to answer for all, thank you, guys.
TOTAL MARKET CAP ANALYSIS:-
Total market cap rejected after creating a higher high and couldn't able to give a close above resistance trendline and came back to the expected retest area, where ascending trendline is also acting as a support.
A bounce can be expected from here and bullish confirmation is a successful retest above the upper marked resistance trendline and a fail retest might result into further correction in the market.
This is not a piece of financial advice. All investments made by me are at my own risk and I am held responsible for my profits and losses. So, do your own research before investing in this trade.
Thank you for your time, we hope that our work is good for you, and you are satisfied, we wish you a good day and big profits.
Thanks.

TOTAL MARKET CAP IMPORTANT UPDATE MUST READ!!Hi guys, This is CryptoMojo, One of the most active trading view authors and fastest-growing communities.
Consider following me for the latest updates and Long /Short calls on almost every exchange.
I post short mid and long-term trade setups too.
Let’s get to the chart!
I have tried my best to bring the best possible outcome to this chart, Do not consider financial advice.
TOTAL MARKET CAP UPDATE
In the last 2022 February, the total market cap made a bearish flag pattern and breakdown this pattern and dropped up to 37%.
In 2022 May Total market cap made a bearish pennant pattern and broke down and dropped up to 37% again
As you can see from the chart or absorb in the chart that now Total market cap again makes this bearish flag pattern but the breakdown is not yet done if it breaks down this pattern we can drop up to 37% again.
This chart is likely to help you make better trade decisions if it does consider upvoting it.
I would also love to know your charts and views in the comment section.
Thank you

TOTAL2 Bottom FoundTOTAL2 Has formed a strong double bottom along the 4.618 fib line of a bear trend
This correlates well with a larger bear fib trend (green trendline)
I have plotted price action in bars pattern which shows a reversal out of this bear market
This is the altcoin market cap

TOTALThe total chart, with its very beautiful technical makeup in the 4-hour time frame, can be another factor in the beginning of wave 5 of the market.
By forming a diagonal pattern and 5 waves formed inside it, Total can make a correction up to the specified range.

What's up about crypto market cap. TOTAL CRYPROCAPHello my friends. This is an update of previous analysis (blow link), The bars filled the second box as expected, and then will come down again. a lot of liquidity is needed to break the top of the box in this week, consider it.
Good luck.
If you like the idea, do not forget to support with a like and follow me for next analysis :)
Write your comment and opinion here to me

TOTAL broke outTotal Brokeout of a mid tern descending channel, broke above the 4h 200 ema and retested it with support. Probable retest of the channel and support from the 4h 200 ema again then to the measured move of the descending channel at 1.33 Trillion above the 21 weekly ema.

Crypto Total Market Cap ReviewHello friends, today you can review the technical analysis idea on a 1D linear scale chart for the Crypto Total Market Cap.
Chart is self explanatory. It could get to the 0.236 Fib level before coming back down. RSI and Stoch RSI are near or at the overbought region. Volume dropping off still.
Also Included: MACD, Ichimoku Cloud, and VPVR.
If you enjoy my ideas, feel free to like it and drop in a comment. I love reading your comments below.
Disclosure: This is just my opinion and not any type of financial advice. I enjoy charting and discussing technical analysis. Don't trade based on my advice. Do your own research! #cryptopickk

TOTAL Crypto market cap - New rising wedge on the weekly chart!
2023 is going to be a very bullish year for crypto in my opinion!
I believe we can reach a market cap of 6-7 trillion dollars by December 2023.
Most likely, you have never seen this rising wedge elsewhere, because it's a brand new pattern on the weekly scale (LOG).
200 moving average is considered a strong support by huge institutions and hedge funds, and the bulls successfully defended this area.
As per my Elliott Wave analysis, the ABC correction has been completed on the macro scale, and now we are ready for another bull market.
We have a tremendous confluence to buy cryptocurrencies at this moment, as you can see on the chart.
I expect massive gains for selected altcoins. You can find them in the related section down below.
For more ideas, please hit "Like" and "Follow"!

Bitcoin Detailed Top-Down Analysis - Day 42Hello TradingView Family / Fellow Traders. This is Richard, as known as theSignalyst.
42 out of 500 days done.
I truly appreciate your continuous support everyone!
Let me know if you like the series, and if you would like me to change or add anything.
Always follow your trading plan regarding entry, risk management, and trade management.
Good Luck!.
All Strategies Are Good; If Managed Properly!
~Rich

#TOTAL MCAP Bottomed already?Total Marketcap looks really good on the macro time frame, no matter what the BTC and ETH chart has pointed out in the last 2 months this chart is showing signs of strength from a macro perspective.
We might test the mA one more time but eventually, it's going up soon.
The super trend indicator is might show up as a BUY SIGNAL soon for the entire market. To keep it clear it is a lagging indicator like MACD.
Let me know what you think!
Please hit the like button and share your views in the comment section.
Cheers
#PEACE

Bitcoin Detailed Top-Down Analysis - Day 39Hello TradingView Family / Fellow Traders. This is Richard, as known as theSignalyst.
39 out of 500 days done.
I truly appreciate your continuous support everyone!
Let me know if you like the series, and if you would like me to change or add anything.
Always follow your trading plan regarding entry, risk management, and trade management.
Good Luck!.
All Strategies Are Good; If Managed Properly!
~Rich

TOTAL3 is looking very bullishTOTAL 3 weekly chart:
The Long yellow rectangle support box may
be the most important support in the entire
Market as a whole. When there is around 19,000
Alt-coin projects relying on BTC holding and this
huge monster support box holding, this is Do or
Die...Im confident in the coming 300 days,
we will see all time highs in the TOTAL 3 market.
The Green $2.674 Trillion is my Super bullish
prediction coming from measurements. and the
smaller yellow rectangles are the falling bearish
support boxes....lets hope we dont see the candles
fall lower. The RSI has never been this OVERSOLD, we honestly should be moving up
bc we are in uncharted territories and sentiment should change.

Total market cap roadmap for next 2 years.Hello
now i show you total roadmap for next 2 years. if the price goes above red triangle until December we say crypto winter is ended. but if the price comes under triangle and supported by another triangle we have a good chance to buy cryptos at great discount.

How far will bitcoin go? According to the published data and total chart, bitcoin can have an upward correction in its downward trend, but this does not mean a reversal of the trend, because the Federal Reserve can increase the interest rate to nearly 3%, and this is not suitable for risky markets.
LIKE AND COMMET YOUR OPINION :)

total crypto market cap.Bitcoin longs are at all time highs,
but the market continues to plunge.
This could only mean one thing,
they're continuing to average down.
----
There's an old saying that goes a little like:
"The market can stay irrational, longer than you can stay solvent".
>Once the longs run out of $,
>Liquidations will kick in;
>Once liquidations start spiraling,
>The price will accelerate very quickly to the downside.
----
Be very cautious in the land of crypto,
and understand what it is that you're getting yourself into.
💰

Update: Crypto Total Market Cap long-term-viewUpdate: Crypto Total Market Cap long-term-view
Ignoring the Corona Panic phase with emotional sentiment we saw repeating patterns of the different market phases
Follow that TA we are in the Bear Market phase - in this phase we always saw an A-B-C correction
That might lead to a new lower low before next phases start - not a must
What are your assessments on that chart?
*not financial advice
do your own research before investing

Cryptocurrency Market Cap. Will Hit 1.675 Trillion Pt.2This weeks candle can be read as a Doji, like a Dragonfly doji or something like that.
I don't focus much on the names rather on the fact that they are reversal signals or not.
It can also be consider sort of a hammer depending on how it closes.
The long lower wick/shadow is the important part and a close that ends green high up.
If this happens after a new support level is hit even better because it signals that the markets will turn.
I studied all the charting system and continue to study them now, literally everything that has been written on the topic and the candlesticks are still the best but they need to be combined with the other stuff for better results, so not one of them work perfectly on their own.
Kind of like teamwork.
On the daily timeframe TOTAL closed above EMA50 which is a strong bullish signal.
On the weekly timeframe it still trades below EMA10 which is no good.
But after 4 green weeks with a rounding bottom pattern, the RSI being strong...
You see, we mix multiple systems to get better results.
These signals are telling us that the Total Cryptocurrency Market Capitalization is still set to grow.
This remains true even with another major drop as long as we stay within a higher low.
Namaste.