TOTAL2 - Support Test of This Curved TrendThis curve has been the dominant trend for awhile now and I think it will be used to push TOTAL2 higher.
I believe we are at the early stages of a larger bullrun and this trend will aid in furthering the bull market.
Three circles show bounces off the middle of a down channel drawn against the tops of recent highs.
Personally im still bullish.
4Hr Chart.
Total

TOTAL # 001 ( Last PUSH UPWARD before Market COLLAPSE !!! ) Hello dear traders.
Good days.
On monthly Gann Square, Total market didn’t grow more than 0.25 of Monthly Gann Box level price and it can try to test at least 0.5 Monthly Gann Box Fib level which will be 2.55 T $ .
It can grow beyond to test 0.618 @ 2.91 T $ Or even try to reach itself to 0.75 Gann Box Fib Level which will be about 3.4 T$ .
Weekly and Monthly Gann Square Can match each other to reach to the mentioned Targets and Finally proceed to Hug Bearish Correction at the end of Monthly Or Weekly Gann Square which is depended .
Chart is plotted with help of Gann Square and Gann Box.
Good luck and safe trades.
Thanks for your support and comments.

TOTAL MARKET CAP ANALYSISHello dear traders, we are new so we ask you to support our ideas with your LIKE and COMMENT, also be free to ask any question in the comments, and we will try to answer all, thank you, guys.
ALTS Market Cap
Current Situation:
The ALTS market cap is currently testing the boundaries of a descending triangle pattern.
The 100-day moving average is acting as resistance just above the triangle.
200-Day MA Bullish Momentum: The 200-day moving average suggests underlying bullish momentum.
Anticipate a bounce from the triangle's support level.
A successful breakout above the 100-day MA confirms a bullish trend.
If the retest of the triangle's boundaries fails, expect further consolidation within the pattern.
This indicates continued market indecision.
The ALTS market cap is at a crucial juncture. A bounce from the triangle's support and a breakout above the 100-day MA will confirm a bullish trend. Failure to break out suggests further consolidation and market indecision.
Hit the like button if you like it and share your charts in the comments section.
Thank you

what is going on in crypto market?!hello guys!
today crypto market has gone down a lot!
let's look through the details:
Today's crypto market experienced a bearish trend, with Bitcoin (BTC) falling to $65,000 and Ethereum (ETH) declining to $3,428.45. Altcoins like Solana (SOL) and meme coins Dogecoin (DOGE) and Shiba Inu (SHIB) saw significant drops, while XRP defied the trend, rising slightly.
The global crypto market cap dropped 3.14% to $2.35 trillion, and market volume surged 104.01% to $94.07 billion, influenced by the U.S. Federal Reserve's hawkish stance.
Key Prices:
- Bitcoin (BTC): Down 1.39% to $65,374.98.
- Ethereum (ETH) : Down 4.39% to $3,428.45.
- Solana (SOL): Down 9.25% to $134.26.
- XRP: Up 0.33% to $0.4893.
Meme Coins:
- Dogecoin (DOGE): Down 9.74% to $0.122.
- Shiba Inu (SHIB) : Down 12.12% to $0.00001802.
Top Losers:
- zkSync (ZK): Down 30.23%.
- Fantom (FTM): Down 20.69%.
- Ethena (ENA): Down 18.89%.
- Starknet (STRK): Down 17.82%.
____________________________________
let's come back to Total2:
description:
The **Total2 Index** is a cryptocurrency market index that tracks the total market capitalization of all cryptocurrencies excluding Bitcoin. This index provides a way to measure the overall performance and trends of the altcoin market, without the influence of Bitcoin's market movements, which often dominate the crypto space.
By excluding Bitcoin, the Total2 Index gives a clearer picture of how the altcoin sector is performing, helping investors and analysts understand market dynamics and the relative performance of various other cryptocurrencies. This index can be particularly useful for those focused on altcoins or looking to diversify their portfolios beyond Bitcoin.
technical analysis:
the previous leg Was corrected until 33%, so it seems the next legs become more bullish, and this index will touch the $12.9T area as well, but it's fine if it becomes a little bit bearish until touches more than 480b area, we can consider on an upward movement!
___________________________
✓✓✓ Always do your research.
❒❒❒ If you have any questions, you can write them in the comments below, and I will answer them.
❤︎ ❤︎ ❤︎And please don't forget to support this idea with your likes and comment

$TOTAL Cup & Handle formingAlthough we could zoom out and literally write a book of CRYPTOCAP:TOTAL technical analysis, let´s start with this 12 hour time frame
In green, a Cup & Handle formation, that WILL TAKE US ABOVE ALL-TIMES-HIGH cryptomarket cap
The ATH marketcap is marked on the purple horizontal lines (2,9 to 3,0 trillion) and the C&H targets are marked with the purple arrows, left is most otimistic, right pessimistic
Is important to say price is on a little triangle formed by yearly long support (big blue dotted diagonal line) and yearly fib circle resistence (continuous red thin line0)
This triangle can still break low to find the support on the thick green 200 EMA line and others yearly supports
As we are on a region with a lot of multi year support, guess what? Break up is a matter of time; I´ll give approximately 4 weeks to this setup completion (marked with red flag and another confluence with the next multi year long fib circle)

$CRYPTO Total Market Cap to ~$9.69T$CRYPTO TOTAL MARKET CAP PROJECTION:
CRYPTOCAP:TOTAL Crypto Market Cap en route to my target this cycle: $9.69 Trillion
current $Crypto Total Market Cap: $2.37 Trillion
eyes on the prize. zoom out.
CRYPTOCAP:BTC CRYPTOCAP:ETH CRYPTOCAP:SOL
based on diminishing cycle returns, fib extensions, and some other tricks up my sleeve.
let me hear your feedback!
-@CryptoCurb

Is the TOTAL Crypto MArket cap showing a RESET is incoming ?NOTE - you may notice the Days Count lines are a differnet length, this is because I use the Volume Candles and so, because of their varying width, day counts can appear longer or shorter....
There is a lot to see in this chart and I am having a loko at it today because, for a few days now, I have felt Uneasy. Something is about to happen.
It may just be that I am about to Sneeze but I do not think so.
I remind you, this is NOT the Bitcoin chart, this is the TOTAL Crypto Market Cap
When BTC made its first ATH in March 2021, the TOTAL was Ranging and the MACD has just broken over the High line, approaching OverBought.
The MACD stayed up there, while PA rose, for 91 Days, before dropping back - This Week, it has just repeated that for the first time since 2021. - During that reset, PA Dropped -51% in a 2 week period.
It then ranged for 8 weeks before beginning its rise to new ATH, a 163% rise over 112 days, wit the New ATH on week of 8 Nov 2021.
One thing to notice right away is how the PA has played out very Much the same way - On the left, you can see how PA came up to the first, Lower Green bar, ranged under it before climbing to the upper green bar and got rejected by the Mid line on that green bar....
We have just done very much the same thing but over a longer Time period, a more controlled approach maybe. But we are one again under the Mid line of the upper Green bar and facing that possibility of rejection as MACD is Up high again and needs to reset
Lets assume the same type of thing happens again,
Pure assumptions here but with some date ranges that many have been talking a bout.
PA starts rising Properly, in a Bull run, Later in 2024 and we reach a TOTAL Crypto Market Cap ATH in around March 2025.
I remind you, That #Botcoin is very likely to reach ATH BEFORE the TOTAL market Cap.
One thing to also bear in mind here, Is if this does play out and the ATH is not Much higher, It means a Lack of increase of Liquidity into the Crypto Market.
ETF's HAVE deminished the Liquidity as While companies bought BTC to be able to offer ETF's, The amount of Customer Money entering ETF is way higher than the amount og BTC purchased.
The ATH may not be Muich higher..............RETAIL IS BUYINF ETF's Not BITCOIN

$TOTAL will triple until end of 2024It sounds impossible, but take a look!
As CRYPTOCAP:TOTAL crypto marketcap is inside a multiyear wedge, it will likely continue this trend for next months as we are testing the support
If you take a look at the RSI on the panel bellow, another trend is forming and will likely hit the resistence before end of year (big purple arrow), with more then 230% gain
After that, we may see a strong correction, mirroring last cicles as is showed on the RSI panel with the 3 dashed red arcs

TOTAL2 - Bullish Above Downtrend A down trend can be drawn using the previous highs peaks
Price has risen above this trend line currently and is finding support above it
This is a bullish scenario with the further breakout upwards just a matter of time to occur.
Daily chart

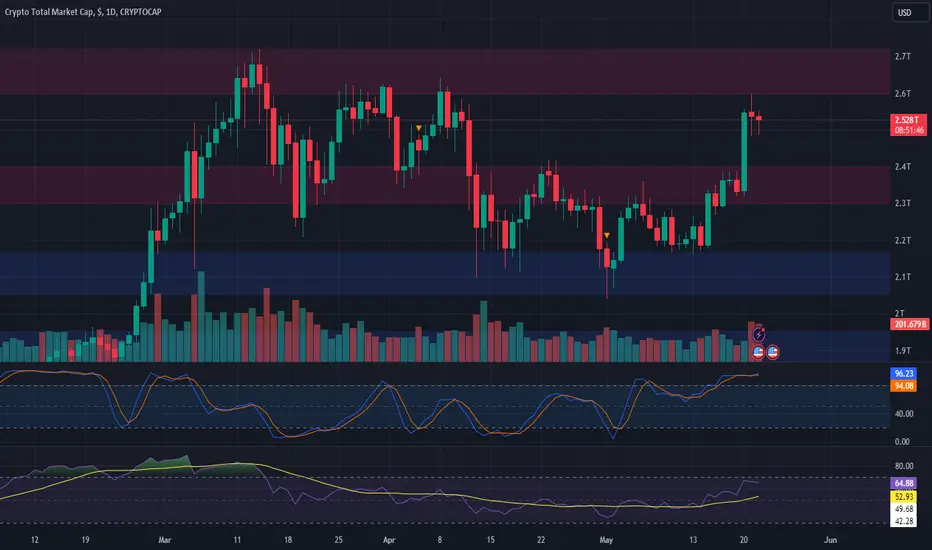
Crypto Market Cap Analysis: Overbought RSI and Potential PumpThe crypto total market cap has followed the potential pump I mentioned last week. So, what's next for TOTAL?
From a technical analysis perspective, as we can see, the RSI is still in the overbought area, indicating a potential retest before continuing its pump. There is a big possibility that the pump will reach the greed zone area of 2.957 - 3.024T.

Market Overview: TOTAL Market Cap AnalysisCurrent Situation:
The total cryptocurrency market capitalization (TOTAL) has rallied over 11% this week, moving from $2.35 trillion to $2.6 trillion, where it faces resistance.
Potential Scenarios:
Consolidation and Retest:
Scenario: The market could consolidate at $2.6 trillion before attempting to test $2.60 - $2.75 trillion again.
Implication: Breaking this range could lead to a test of the 2021 all-time high at $3 trillion.
Rejection and Pullback:
Scenario: Rejection at current resistance might pull the market back to the $2.4 trillion support level.
Strategic Considerations:
Entry Strategy: Consider long positions if there's a breakout above $2.75 trillion with strong volume.
Exit Strategy: Take partial profits at current resistance and re-enter if consolidation shows strength.
Stop-Loss: Set stop-loss orders to manage risk, especially below $2.4 trillion support.
Conclusion:
The TOTAL rally is positive, but be prepared for potential consolidation or pullback. Monitor key levels to make informed trading decisions. #CryptoMarket #TOTAL #TechnicalAnalysis
Bitcoin (BTC/USD) - Weekly - Potential Support Trendline TestBitcoin (BTC/USD) has been in a long-term price uptrend since 2023.
However, Bitcoin has been in a short-term downtrend since April 2024.
Bitcoin price could potentially re-test Support Trendline 1 and support prices of approximately $56000 down to $55000.
Bearish Scenario: price falls and test support levels below such as $58000, $55000, $50000, $45000, $40000.
Bullish Scenario: price bounces and continues higher to resistance prices of $64000, $69000, $73000, $77000, $80000.
Note: crypto regulatory changes, government vs crypto exchange lawsuits, breaking news, corporate earnings, and global events could override technical chart patterns.
Date created: 05/10/2024

From day 12 to day 7 of juneThis is my prediction based on what is most agreedable move in the Total cripto market and USDT.D (USDT DOMINANCE).

#cryptomarket mid term weaknessTOTAL1 #cryptocurrencies total market cap chart. (Inc. #btc #bitcoin #eth #sol #bnb #xrp #doge and all #altcoins) Some dead cat bounces are necessary, but overall weakness is playing out with continuation. Former support zone is now turned into a strong resistance zone (Orange box).Declination will be sour.
Not financial advice.

📉 TOTAL Market Update 📉Yesterday's sharp selloff saw TOTAL market capitalization drop from $2.3T to $2.13T. Today's FOMC meeting could exacerbate downside pressure.
Support Levels:
Immediate support: Bottom of the current range at around $2.054T.
Further support: $1.80T - $1.95T (daily 200 MA) if $2.054T is breached.
Market Outlook:
May historically experiences trading challenges, often characterized by choppiness.
📈💡 Stay cautious and monitor market developments closely! #MarketUpdate #TradingInsights 🌐📊

04/27/2024 - Watchlist, Stocks, Crypto - Video Idea - TA ChartsWatchlist, Stocks Indexes, Bitcoin, Crypto TA Charts by @NoFomoCharts
00:25 Watchlist and News
02:05 Stock Indexes
06:22 Crypto, Bitcoin, Altcoins
Watchlist, SPY, QQQ, DIA, IWM.
TOTAL, Bitcoin (BTC/USD), Halving History, ETH/usdt, BNB/usdt, SOL/usdt, ADA/usdt, XRP/usdt.
04/27/2024, 08:00PM EST Video Idea.
Technical Analysis & Educational Chart Videos.
Follow, Comment, Boost, or Cheer to support. Thank you!
All content is Not financial advice.

TOTAL (1H) forming a possible bearish patternLooking at TOTAL chart in 1H timeframe, it's possible that a rising wedge pattern is being formed. if confirmed, market can dump a little for a couple of days. in case the pattern fails and TOTAL crosses above the resistance zone, the current pump in the market shall continue with a better momentum.


Total crypto marketcap similar to large-cap and small-cap stocksWhile Bitcoin rose to new all-time highs this year, many altcoins seem to lag behind it, showing a somewhat similar dynamic to that observed between large-cap and small-cap stocks (where large and well-established companies managed to recover in the past year or so while their smaller counterparts have been struggling). In addition to that, it is often overlooked that despite a huge rally in Bitcoin, the total cryptocurrency market cap has not reached its previous all-time highs from late 2021 (even despite Coinmarketcap currently listing more than 2.4 million different cryptocurrencies on its website, which is far more than at the peak in 2021).
Illustration 1.01
Illustration 1.01 shows the weekly charts of the three largest cryptocurrencies (excluding Bitcoin and stablecoins). Unlike Bitcoin, each token failed to reach new all-time highs (thus far). The same applies to other large cryptocurrencies, including XRP, DOGE, and Cardano.
Please feel free to express your ideas and thoughts in the comment section.
DISCLAIMER: This analysis is not intended to encourage any buying or selling of any particular securities. Furthermore, it should not serve as a basis for taking any trade action by an individual investor or any other entity. Your own due diligence is highly advised before entering a trade.

TOTAL crypto "10:50 crossing"On the appearch of the TOTAL crypto chart the 10 day moving average and the 50 day moving average are crossing. The 10 day line is crossing over the 50 day, as in going under.

TOTAL -- red strong short arrowstrong short showing over the top of the week view of total crypto similar to Cryptex finance's TCAP. This is a new week and brand new candle signal.

DOGE → The realization of the breakdown could give us 50-70%BINANCE:DOGEUSDT is attempting to break through the correction in order to continue the uptrend. On W1 the price enters a new channel and opens a new potential.
On D1 a reversal pattern is forming with the subsequent formation of a pre-breakout formation. The market is buying back the fall in a few days and preparing for realization. This generally indicates a high interest in the coin.
On W1 DOGE enters a new channel 0.16 - 0.34, which in general opens a huge potential for the meme coin in the medium and long term.
On H4, the price breaks the bearish channel resistance (correction channel). A consolidation above the resistance and a retest of the 0.1800 area is being formed. A breakout of this line will open the potential for the coin and also confirm the end of the correction.
Resistance levels: 0.1800, 0.20637
Support levels: 0.16900, 0.14528
I expect the realization of the breakout of resistance with the subsequent distribution of the price to the specified targets
Regards R. Linda!

📉💡 TOTAL Market Retracement Analysis 💡📉📊 Market Overview:
Recent Movement: The TOTAL cryptocurrency market capitalization has experienced a retracement from approximately $2.6 trillion to $2.35 trillion before rebounding briefly and encountering resistance at the $2.5 trillion level.
Current Trend: Despite the bounce, there's a risk of further downside if the daily support line around $2.35 trillion is breached.
📉 Potential Scenarios:
Breakdown Scenario: If the support at $2.35 trillion is breached:
Downside Targets: Look for potential support zones at $2.10 trillion - $2.20 trillion and $1.80 trillion - $1.90 trillion.
Impact on Altcoins: A market retracement could lead to bearish sentiment for altcoins, potentially resulting in further declines.
Recovery Scenario: If the support holds and the market rebounds:
Upside Potential: Anticipate a potential return to previous levels or higher.
Altcoin Resilience: A successful rebound could stabilize altcoin prices and restore confidence in the market.
💼 Risk Management:
Monitoring Support Levels: Keep a close eye on the $2.35 trillion support level and be prepared to adjust strategies accordingly based on price action.
Managing Positions: Consider implementing risk management strategies such as stop-loss orders to protect against adverse price movements.
Market Sentiment: Stay informed about market sentiment and monitor key indicators for signs of potential trend reversals.
📈💰 Trade Responsibly: Stay cautious and adapt to changing market conditions. Managing risk effectively is crucial in navigating volatile market environments. 📉💡 #TOTAL #MarketAnalysis 🚀📊
